
Gain actionable insights with real user monitoring: the latest features in Grafana Cloud Frontend Observability
One of the biggest challenges observability teams face today is gaining end-to-end visibility into their cloud native apps, including modern browser frontends. Without that visibility, you potentially open the door to bad end-user experiences that can hurt customer satisfaction, reduce search engine discoverability, and interfere with overall business goals.
This is the exact challenge we address with Grafana Cloud Frontend Observability. Powered by Grafana Faro, an open source Web SDK to instrument JavaScript-based browser applications, Frontend Observability is a managed real user monitoring (RUM) solution that provides immediate and actionable insights into the end-user experience of your web applications.
With Frontend Observability, you can measure and report on web vitals, such as page load times, interactivity, and visual stability, to ensure you offer the best possible experience to your users. You can also get an end-to-end view into real user interactions with your app frontend, as well as aggregate, triage, and prioritize frontend errors for faster troubleshooting.
In this blog post, we’ll explore some of the latest updates to Frontend Observability in Grafana Cloud, including:
- Tighter correlation between frontend and backend signals via native integration with Grafana Cloud Application Observability, an out-of-the-box APM solution to reduce MTTR and improve app reliability
- New capabilities to upload private source maps
- Improved control over observability costs
What is Grafana Faro?
Before digging into the details and latest updates related to Frontend Observability, it’s helpful to have an understanding of the Grafana Faro Web SDK — a highly configurable and open source JavaScript agent. You can easily embed this agent into your web applications to collect RUM data, such as performance metrics, logs, exceptions, events, and traces. Introduced in 2022, Faro is a powerful tool to monitor web application performance, discover frontend errors, and track user behavior to identify and resolve issues faster.
Correlate between frontend and backend signals
From day one of rolling out both Frontend Observability and Application Observability in Grafana Cloud, we prepared both solutions for a key workflow: correlating, contextualizing, and navigating between backend (APM) signals and frontend (RUM) signals. This is an important component of any observability strategy, as it allows you to get to the root cause of performance issues faster. And to facilitate this seamless integration in Grafana Cloud, all you need to do is check a box in the Application Observability configuration to include web apps in your experience.
Frontend Observability and the Grafana Faro Web SDK have been using the OpenTelemetry JavaScript libraries for distributed tracing since their inception. Thanks to recent developments, users can now navigate more seamlessly from frontend to backend transactions by leveraging user sessions and trace identifiers.
Let’s walk through an example. Imagine you get alerted on a very large time-to-first-byte (TTFB), signifying that the backend is taking a long time to produce a response document.

As we all know, when shopping online, speed matters; it’s a functional requirement. Without it, users might simply go somewhere else to make their purchase, which means your conversion rate — a metric that measures how well an app converts its users into taking a desired action — drops proportionally.
Taking a look at the alert, we can see that the “cart” page is having a performance issue: it’s served slower than 2100 ms, where 800 ms is the threshold for “good” performance.
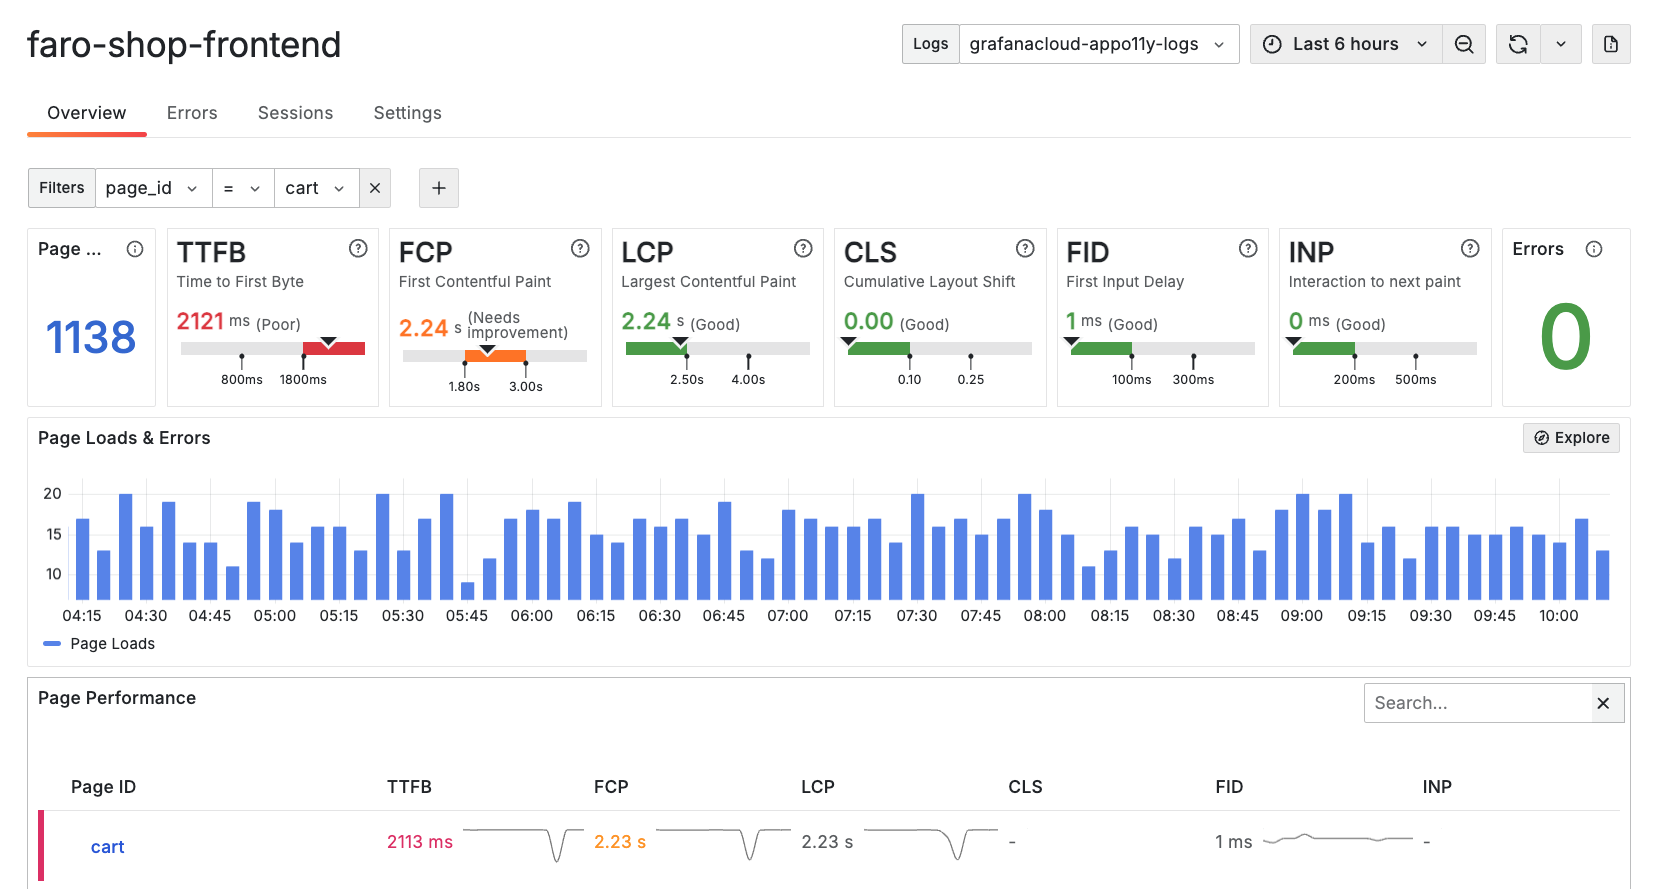
Next, we can navigate to the user sessions from the top-level menu in Frontend Observability to investigate the TTFB issue. Let’s look at one of the user sessions in more detail.
Within the user session, we will find a timeline of events recorded while the user was navigating the app. We can use the filter to narrow it down to just interactions with the cart page. To learn more about the page load metrics, we can expand the “Page Load” row for the /cart page.
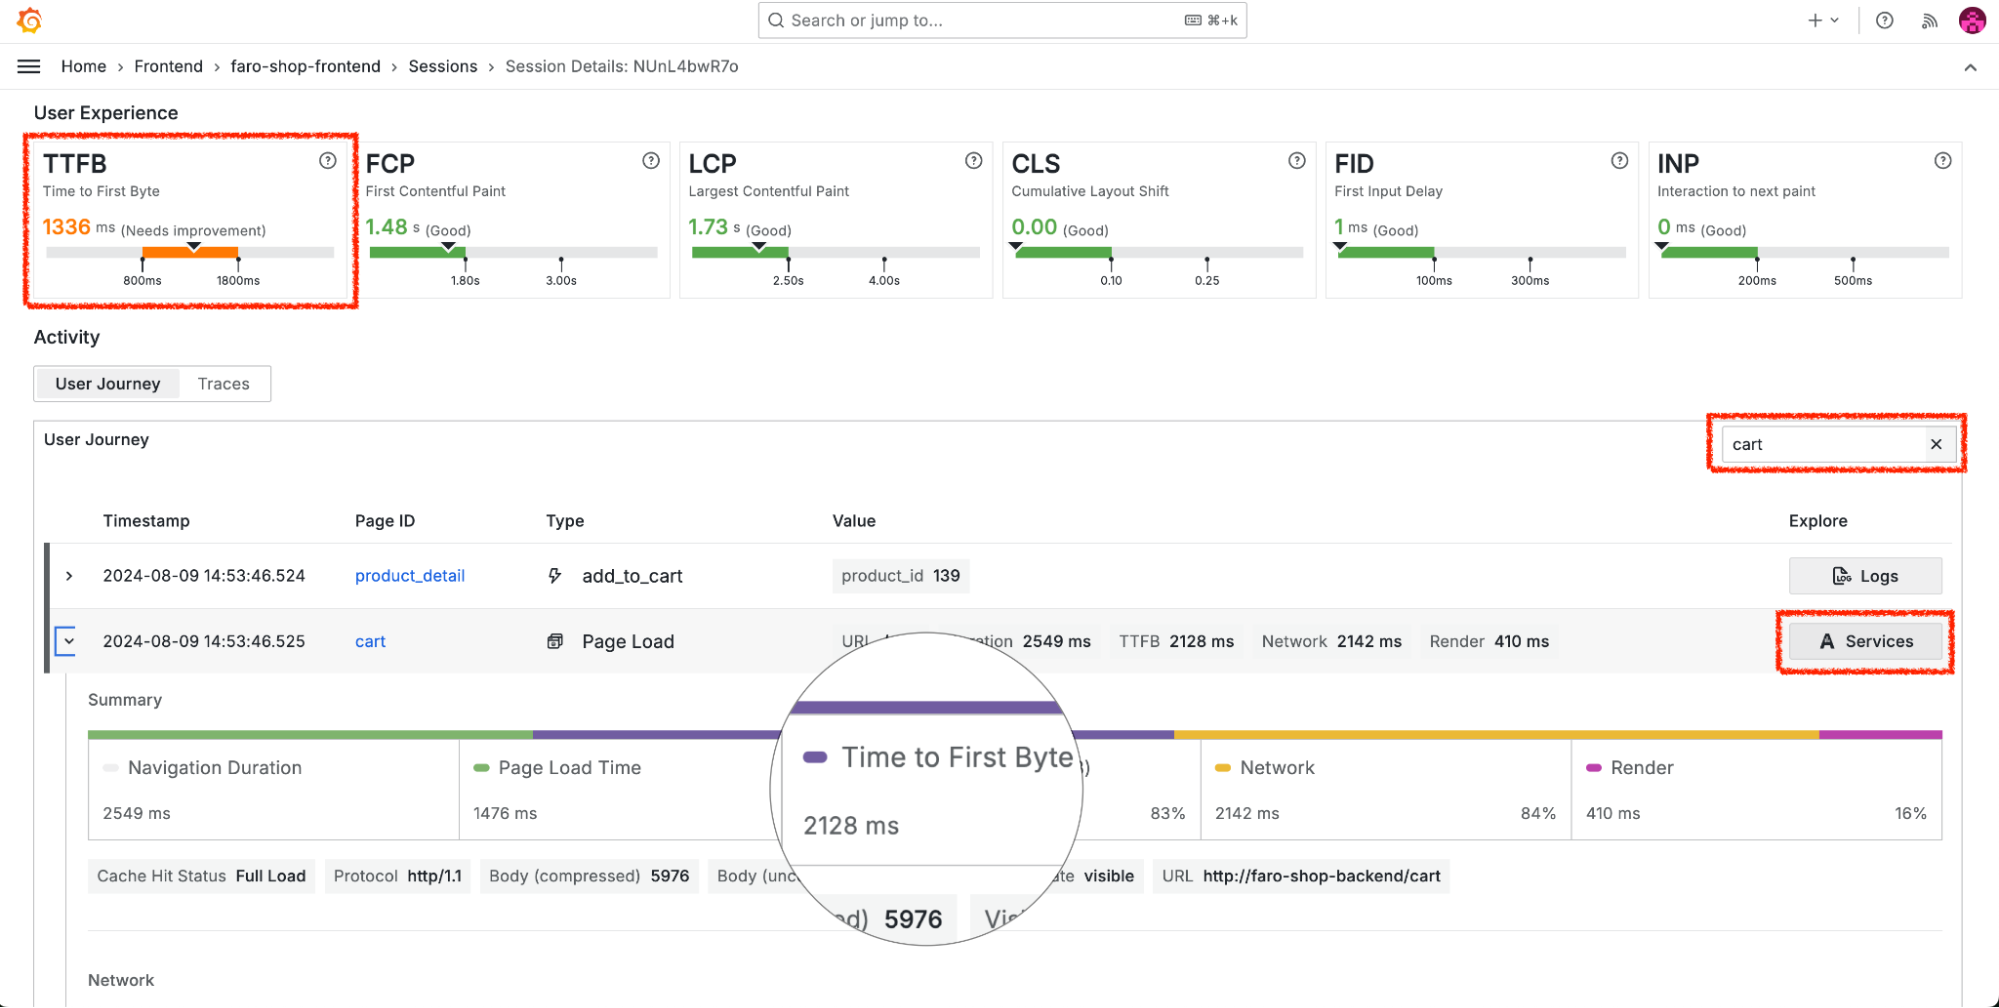
Here we can verify that this page load took more than 2 seconds. Now, we can click the Services button next to the Trace ID to look directly at the backend trace in Grafana Cloud Application Observability.
Pinpoint root causes in backend services
By clicking on that Services button, we access Application Observability, which is scoped to the backend service and the trace that was recorded while the page load metric was produced.
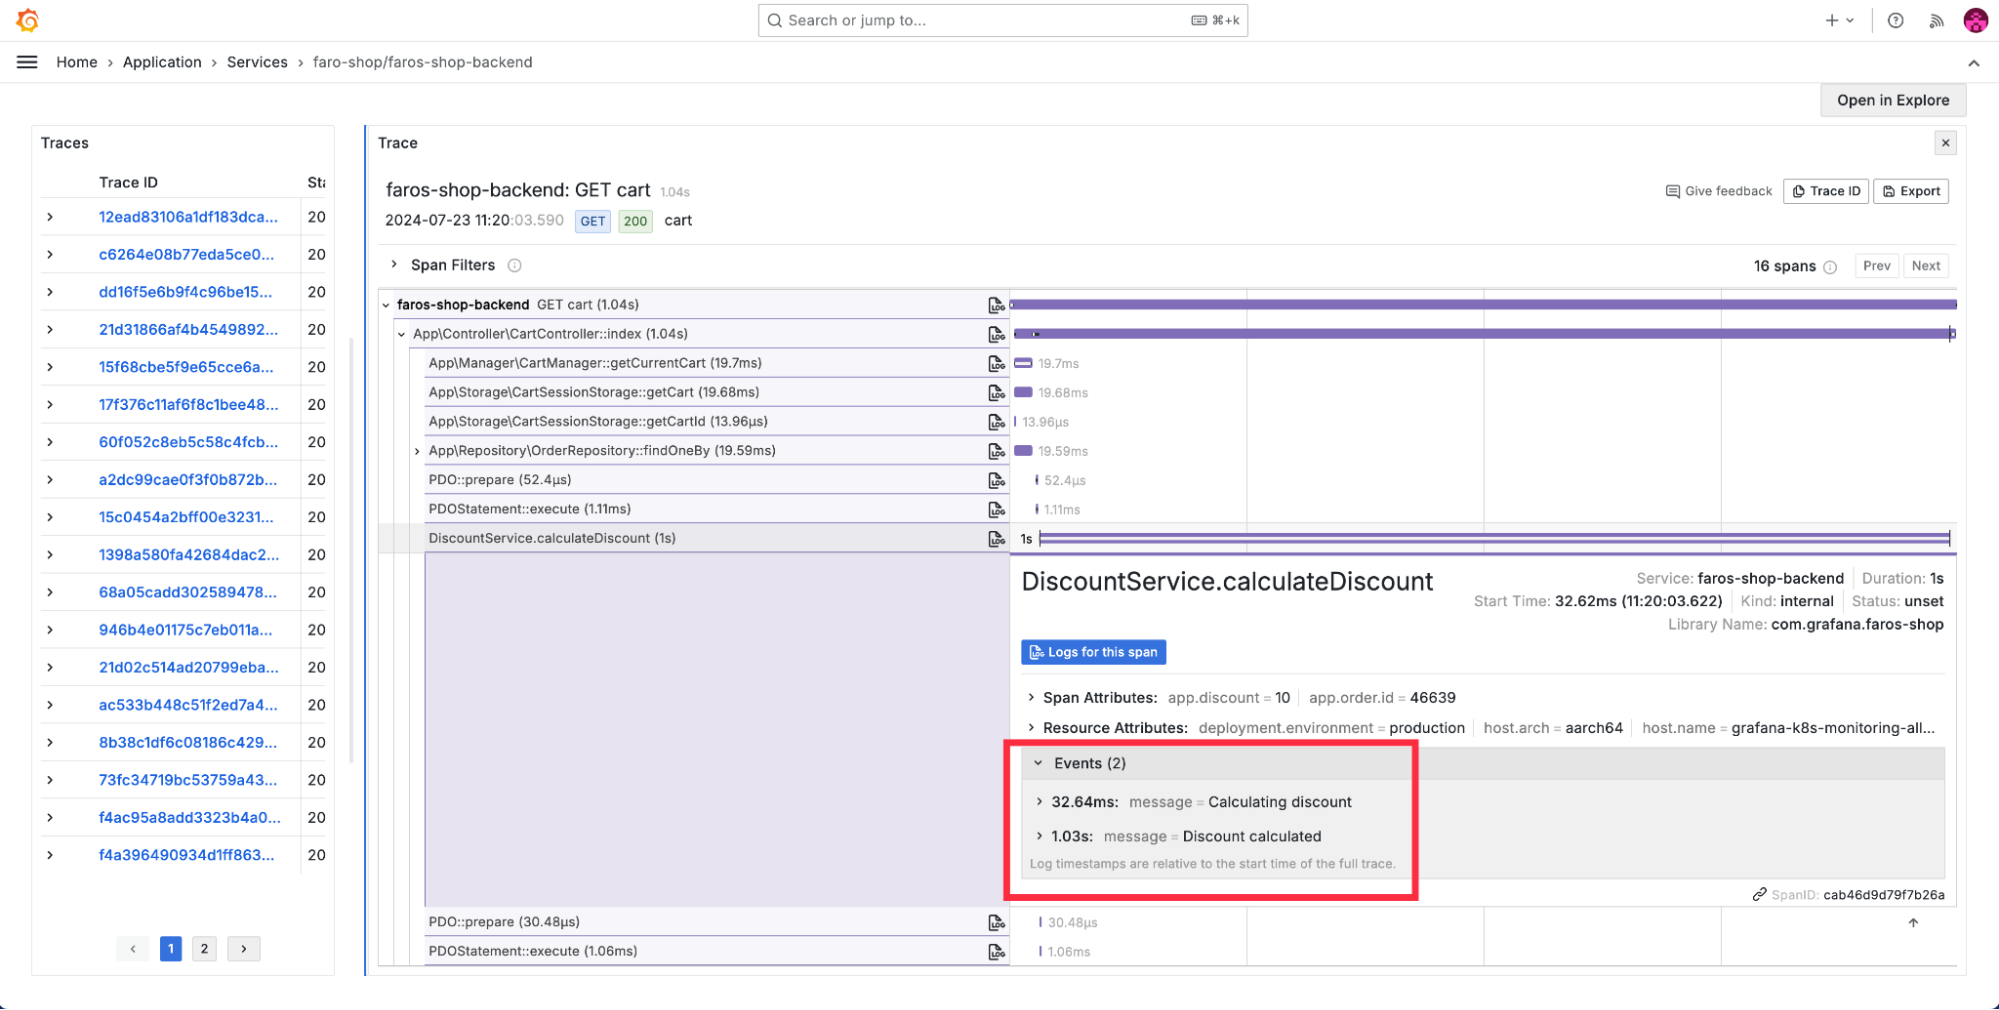
The trace tells us exactly where the time was spent and where our anomaly is located: the Discount service takes one second to calculate the discount for the cart. There’s our root cause. And, thanks to domain-specific attributes on the traces, we have enough context to reconstruct the issue with a test case.
Get a unified view of all discovered services
Let’s look at another scenario to illustrate how you can use Application Observability alongside Frontend Observability to identify and resolve issues faster.
You can now view and troubleshoot websites and mobile apps within Application Observability and see a centralized list of all the services that send distributed traces to Grafana Cloud. To learn how to include websites and mobile apps in your Application Observability configuration, please reference our documentation.

The RED metrics of your frontend services are surfaced within Application Observability. Notice the elevated error rate in the screenshot above? Let’s click on the graph or the action button at the top to start investigating these errors.
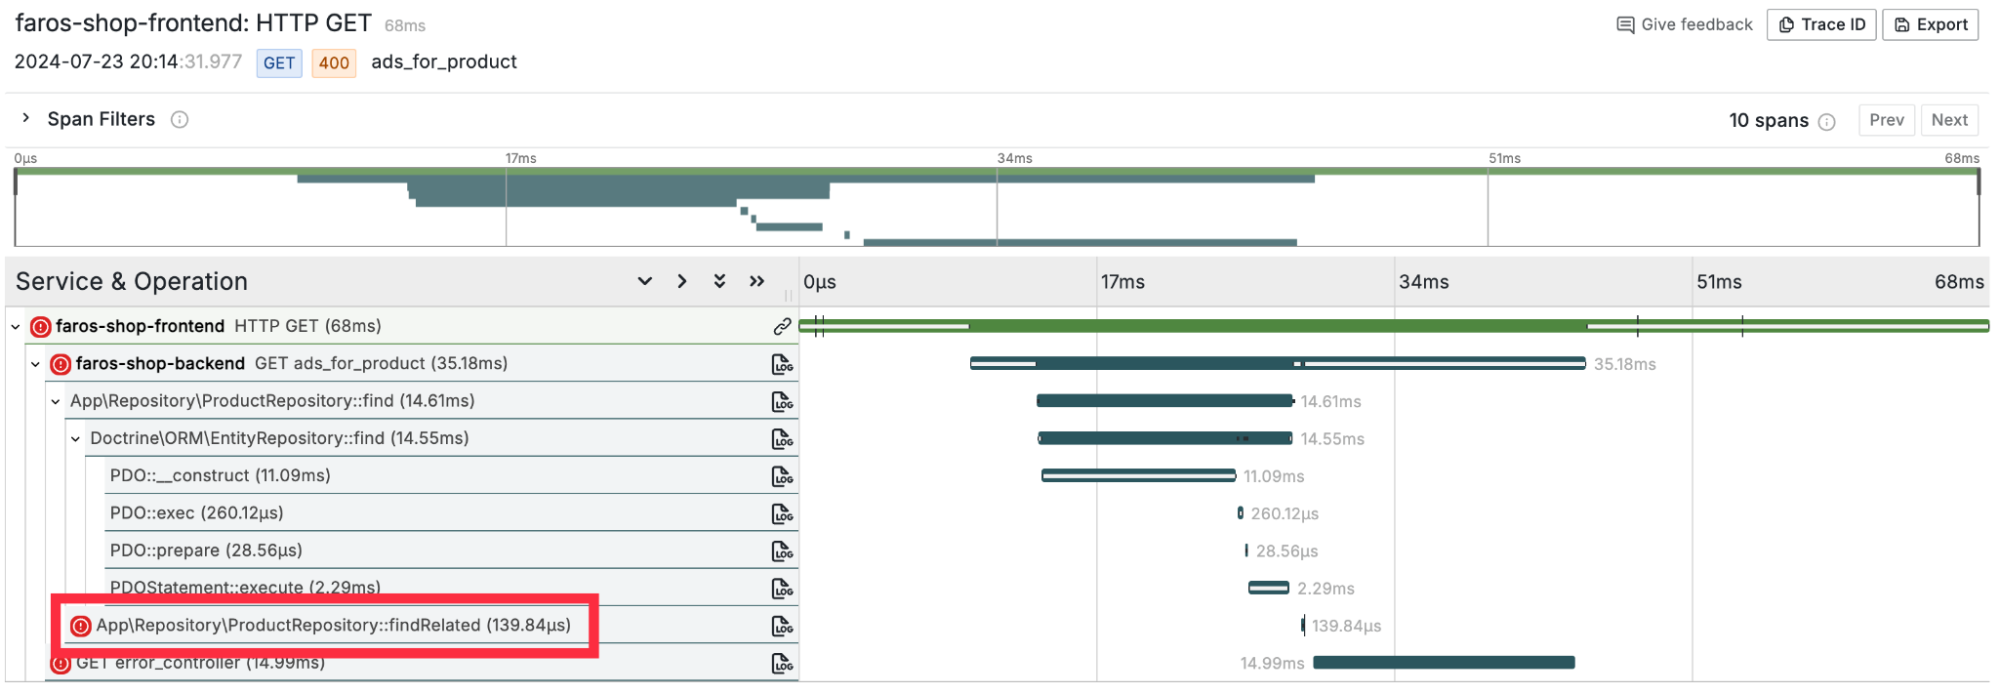
In this trace, we can see the call from the frontend come in and execute the ads_for_product endpoint. Then, an internal transaction to the database is failing. Let’s look at the attached events.
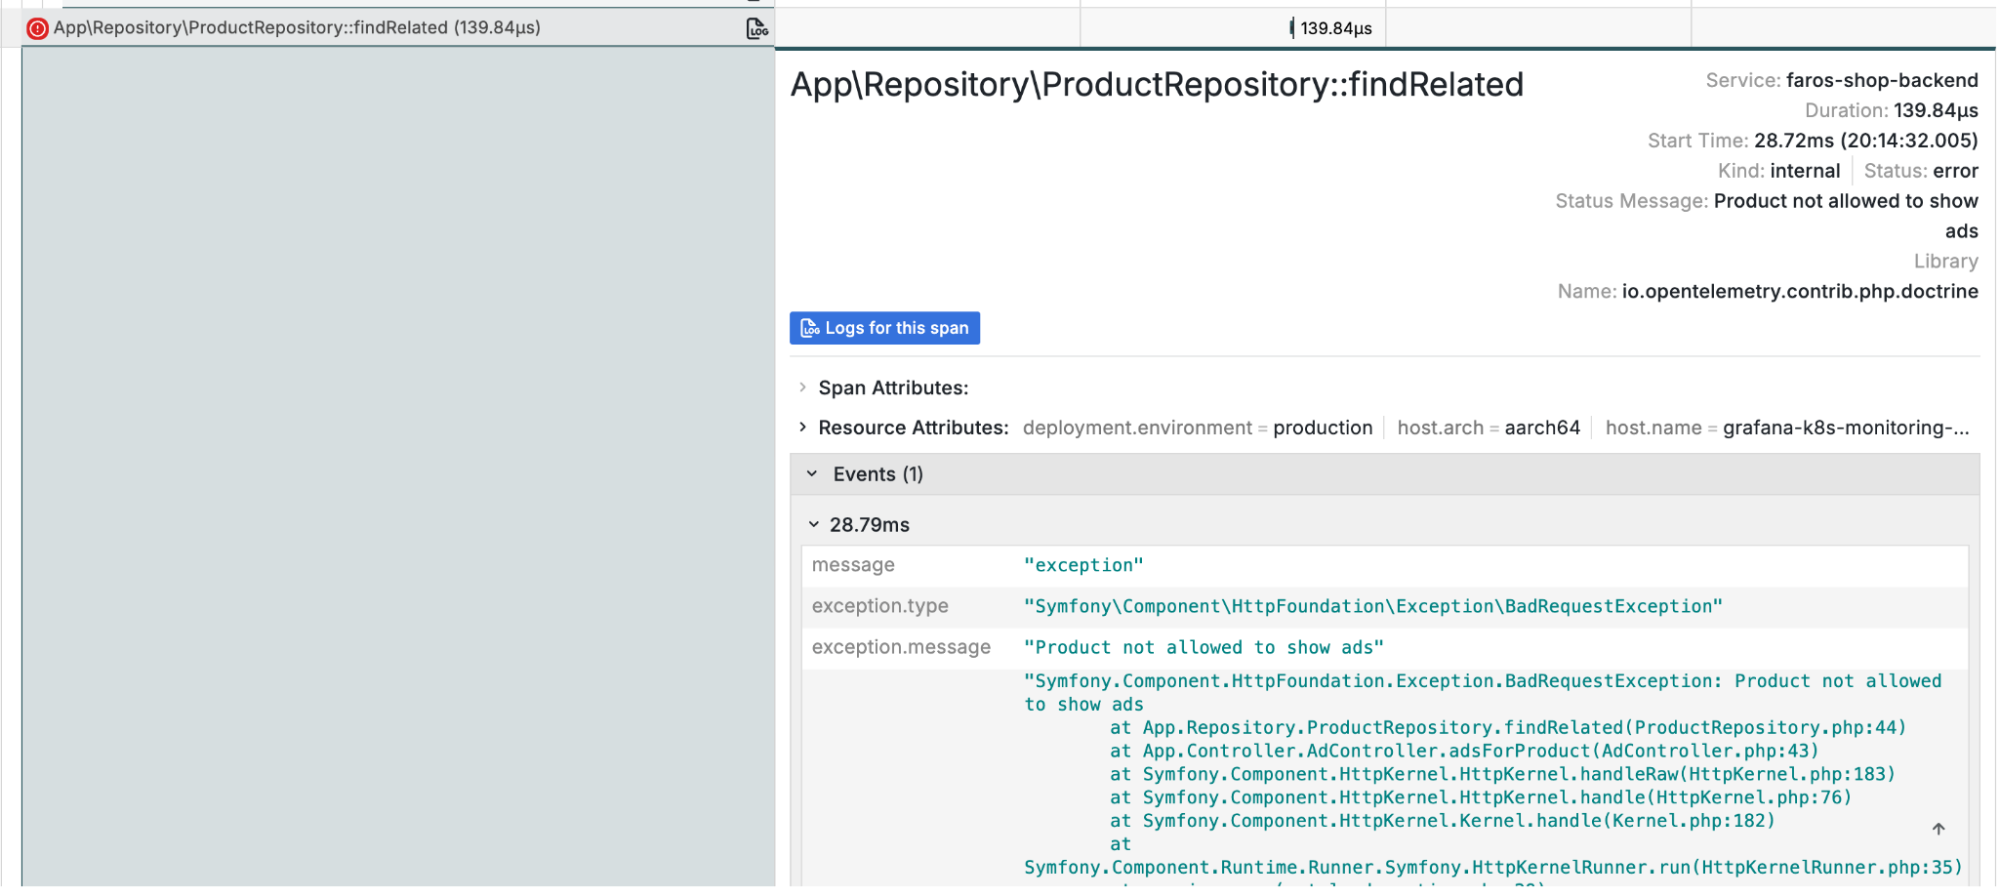
Here, we can see the exact reason, and stack trace, for the exception, which is information we can use to fix the issue. And, in order to understand how the user interacted with the application, we can take a look at the root span. If Application Observability detects a trace that originated in the frontend, it will create a Session for this span button that allows you to quickly navigate to the user session recorded via real-user monitoring.
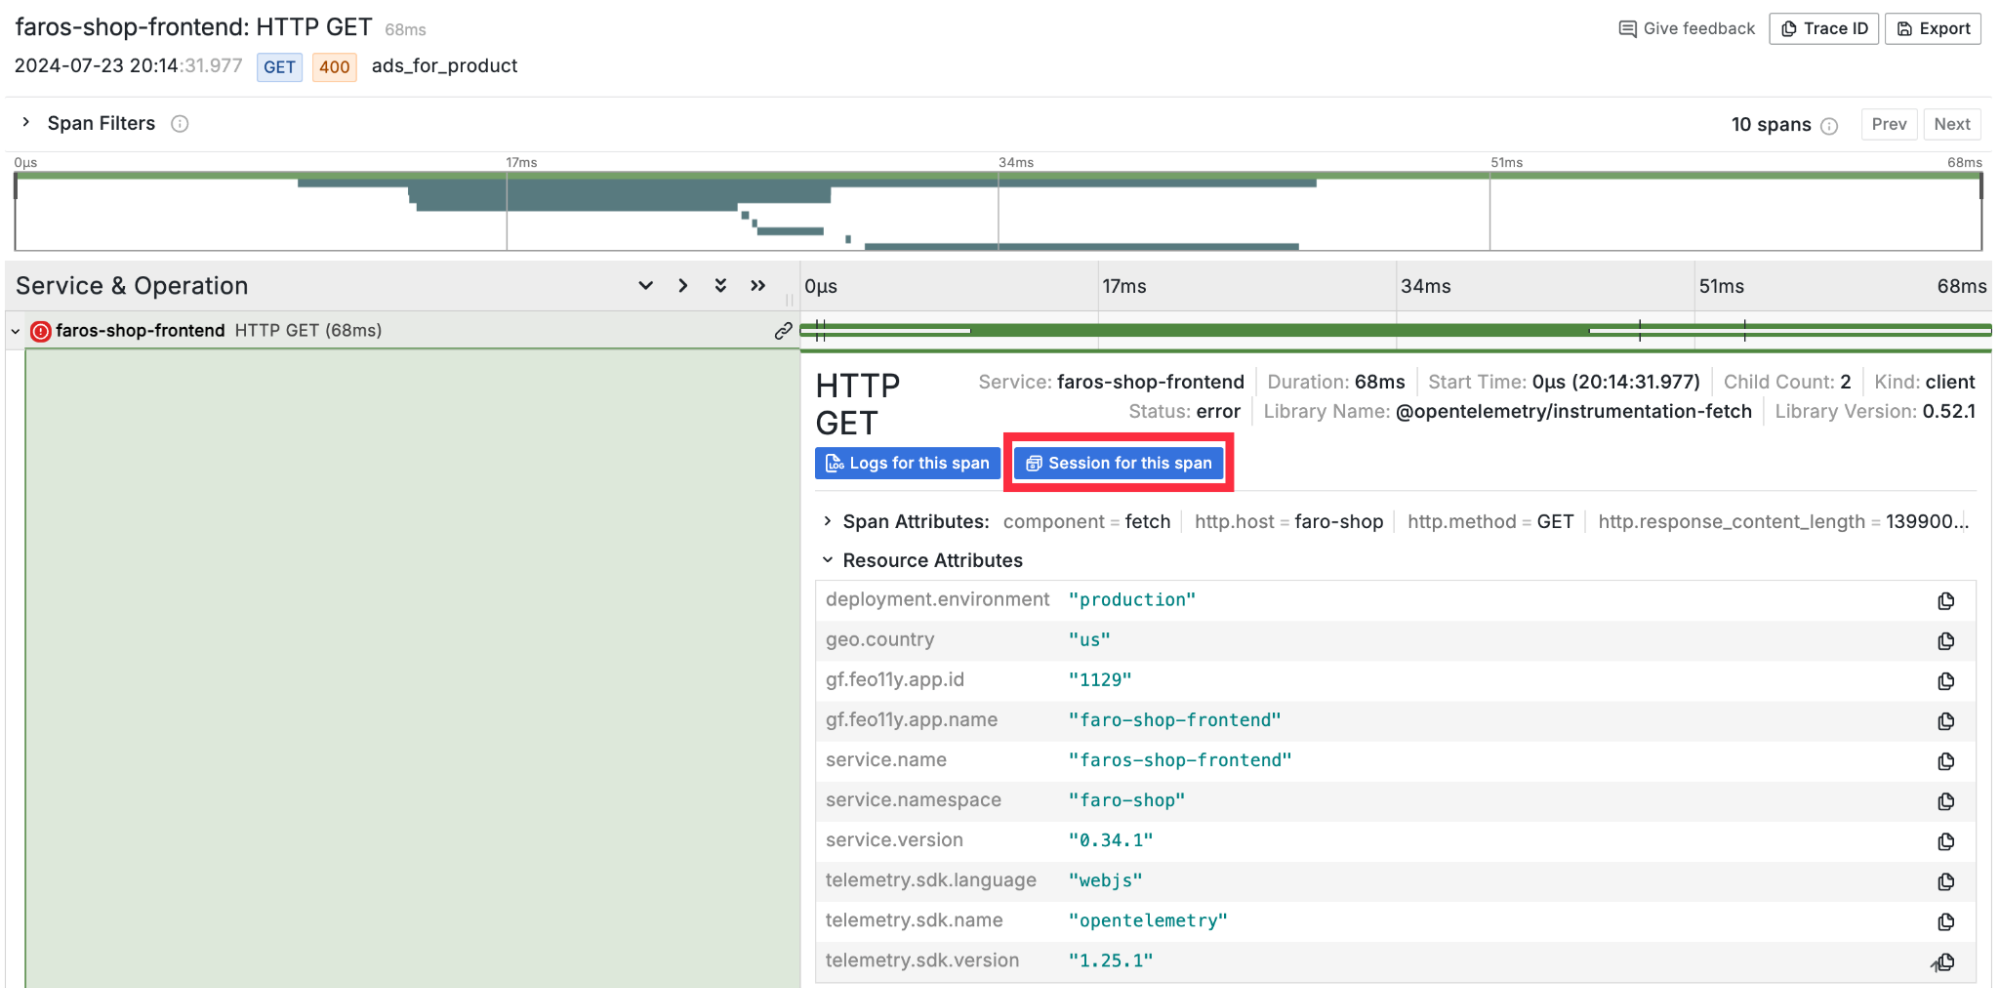
By creating these bi-directional workflows, both Grafana Cloud Application Observability and Frontend Observability empower you to correlate frontend and backend signals.
Control costs while maintaining visibility
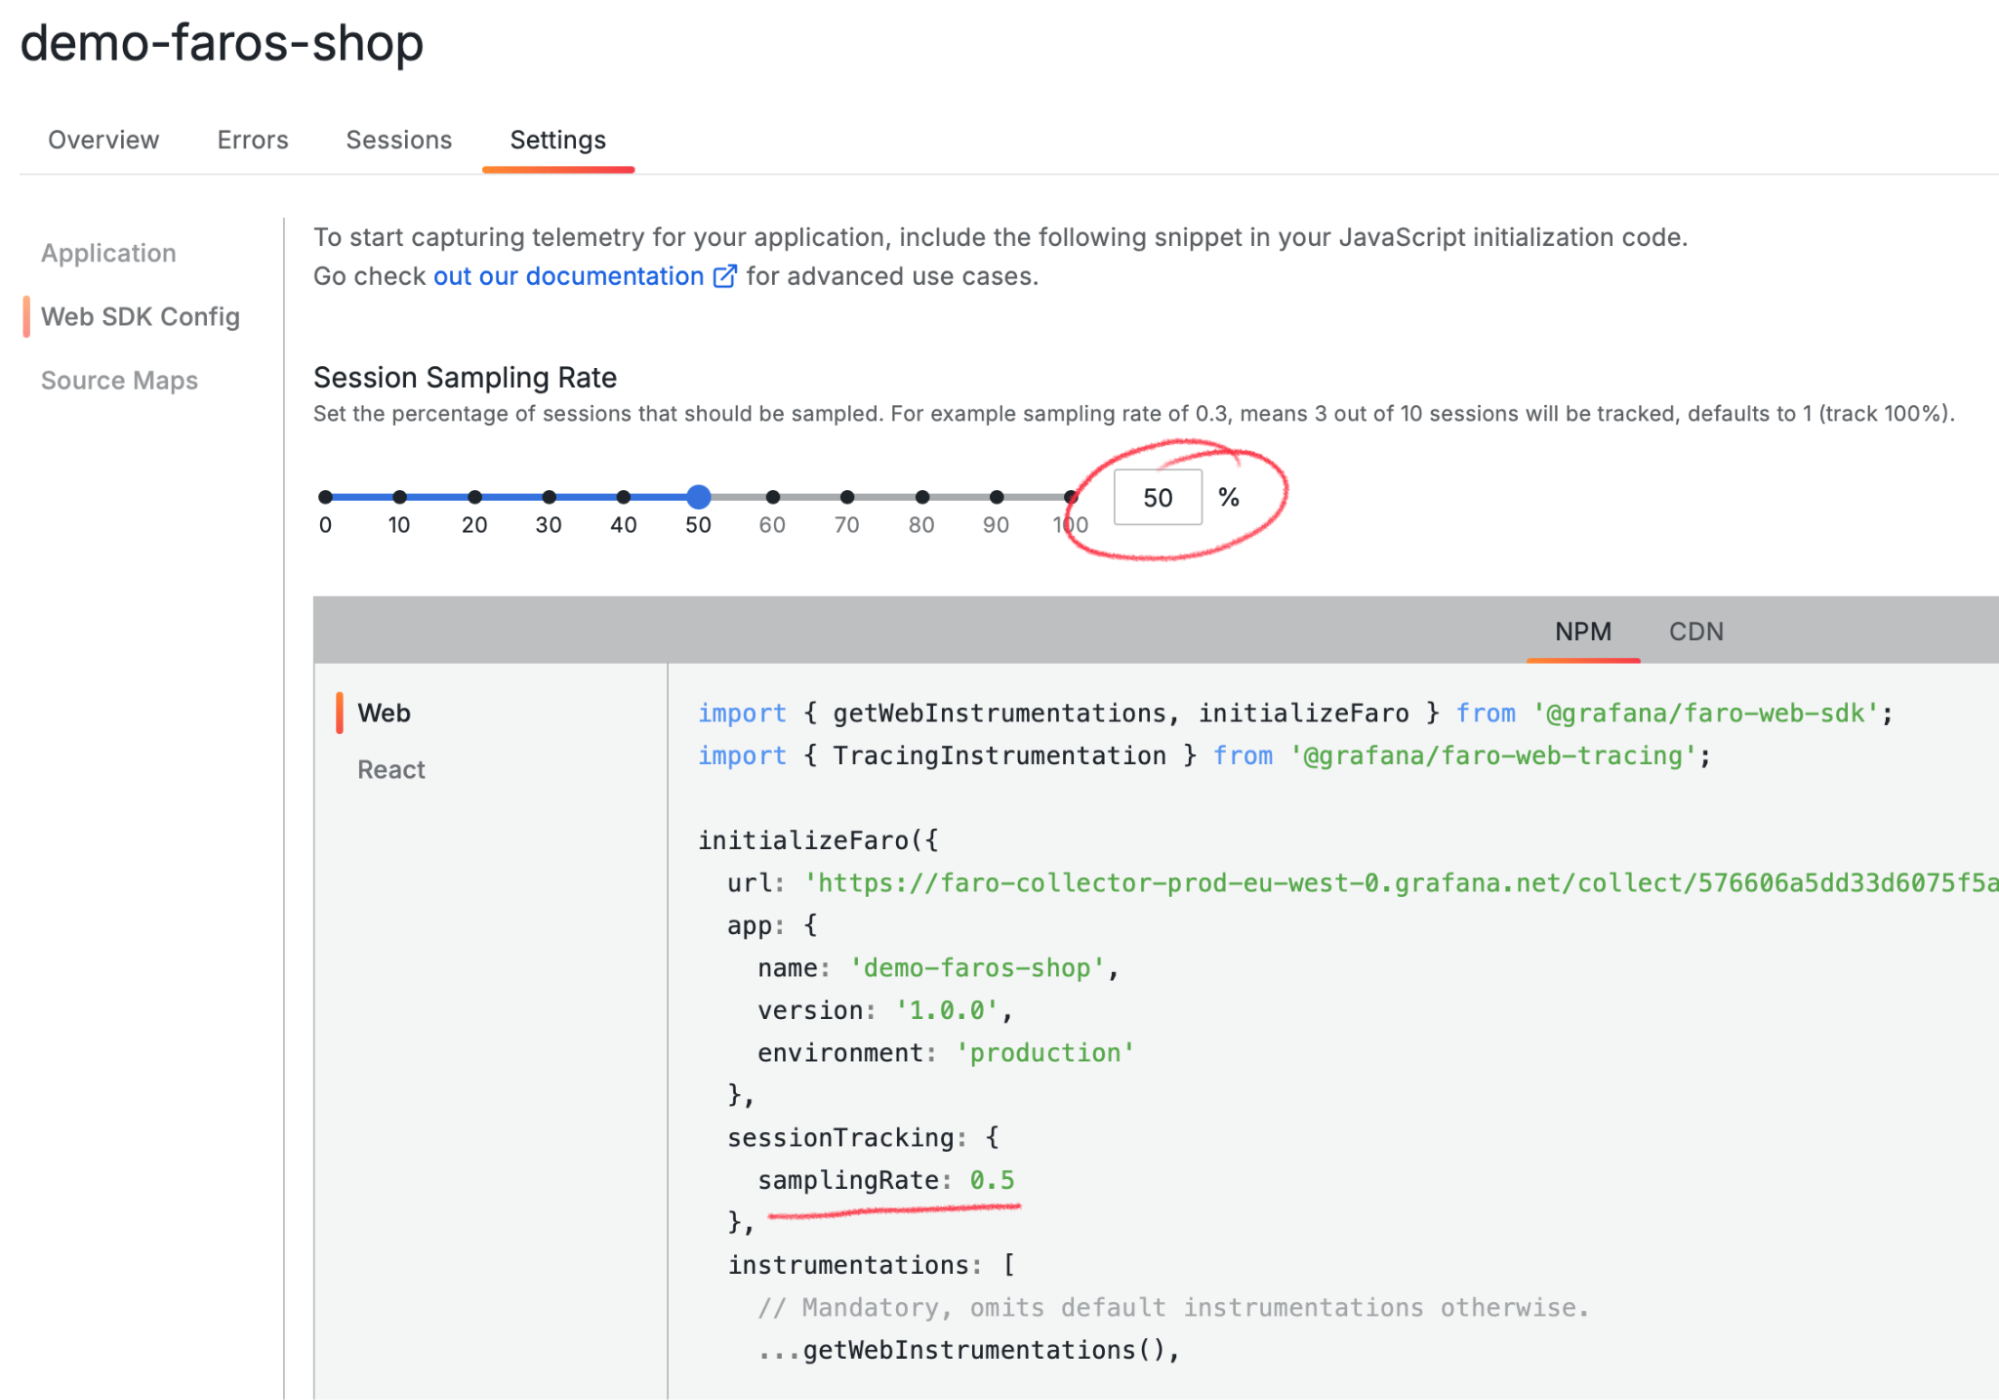
We understand that collecting everything may not be cost-effective — which is why you can now set a sampling factor globally to control how much telemetry you collect. This could also apply to your backend services when using a parentbased_always_on sampler.
Let’s take an example: you want to capture telemetry for 50% of user sessions in your web application to reduce spend. When initializing the Web SDK, you can do that by setting a single parameter.
Upload private source maps
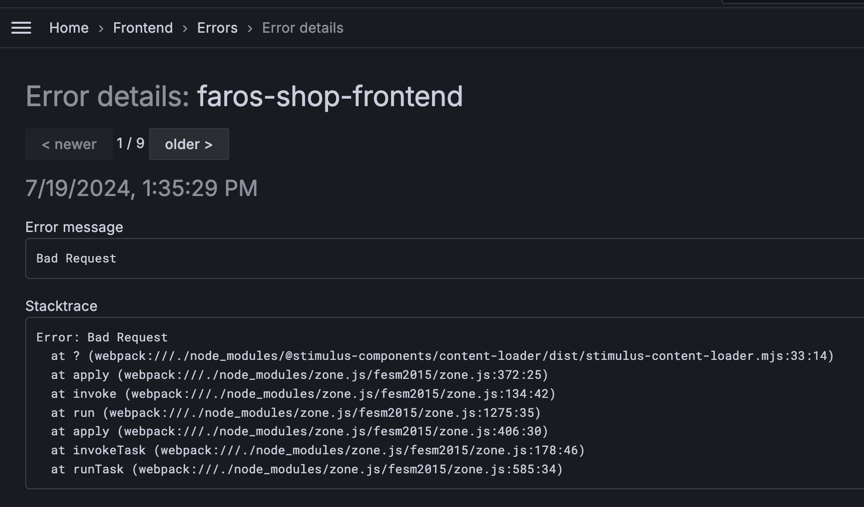
When you bundle your JavaScript code, you typically try to obfuscate and hide the original code from third parties to minimize security risks and protect intellectual property. But if an error occurs, you still want to have maximum context around the issue, including detailed stack traces for the errors captured by Frontend Observability.
Traditionally, Frontend Observability has resorted to fetching source maps, which can transform a stack frame into its original representation dynamically — but this required those source maps to be publically available on the internet.
This has changed: you can now upload private source maps to Grafana Cloud as part of your build process by hooking into your favorite bundler. This means your code remains private and you get the visibility you need.
Read more about private source map uploads in our documentation.
Get started with Frontend Observability
If you haven’t already, it’s fast and easy to get started with Frontend Observability in Grafana Cloud. To launch Frontend Observability:
- Simply look for Frontend under Observability in the vertical left-hand navigation in Grafana Cloud.
- Create an application through the web interface.
- Follow the instructions to add the Grafana Faro Web SDK to your application.
- Enjoy out-of-the-box insights into your end users’ experience!
For full implementation details and best practices, see our Frontend Observability documentation.
Grafana Cloud is the easiest way to get started with frontend observability. We have a generous forever-free tier that includes 50,000 user sessions per month and more. Sign up for free now!


