Multi-cloud monitoring made easy: monitor AWS, Microsoft Azure, and Google Cloud services all in one app
Announced at ObservabilityCON 2024, Cloud Provider Observability is now Generally Available.
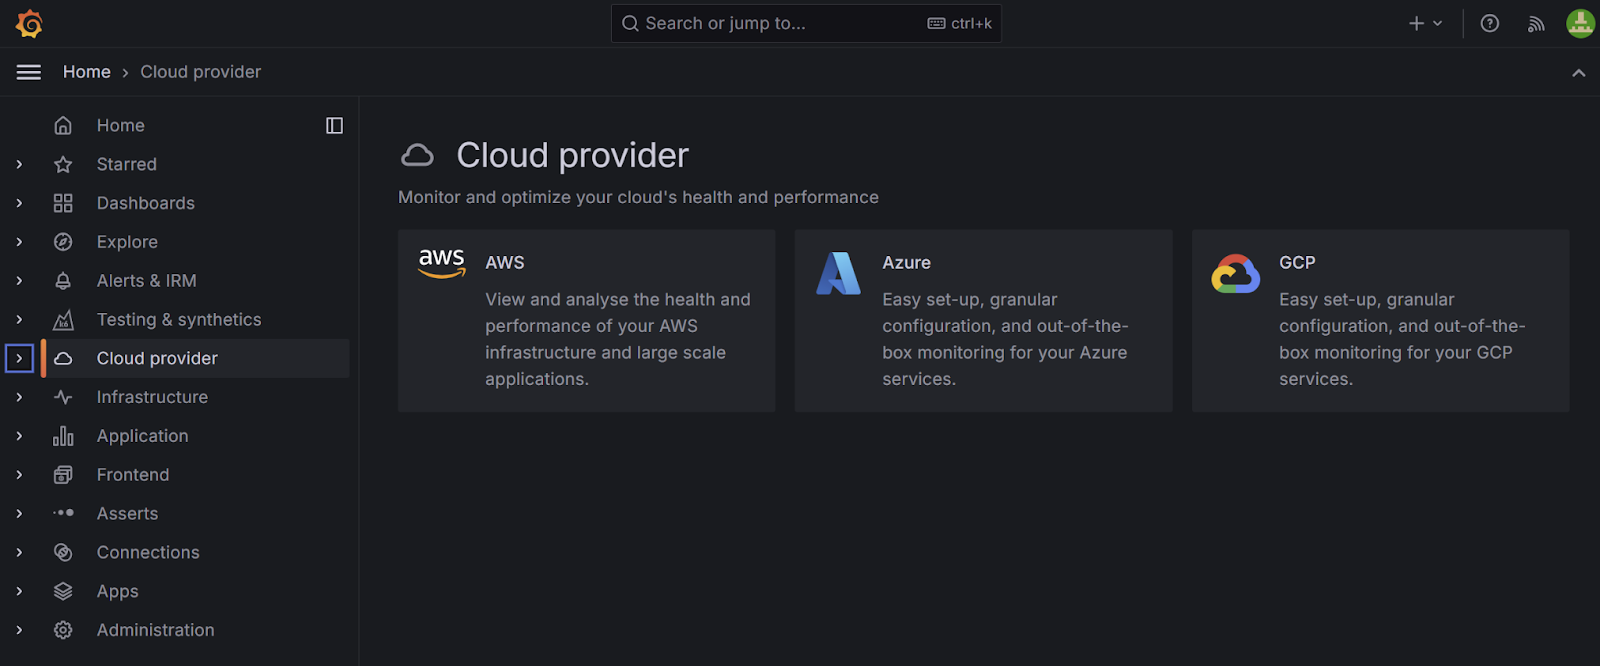
Managing multi-cloud environments often means juggling different monitoring tools for each provider, leading to increased complexity and operational overhead. To solve for that, we’re excited to introduce Cloud Provider Observability — an application for monitoring AWS, Microsoft Azure, and Google Cloud services, all in Grafana Cloud.
The Cloud Provider Observability application (which is in public preview) is an extension of our AWS Observability app, offering expanded support for multi-cloud environments. You can now unify multi-cloud monitoring efforts with a single, out-of-the-box solution that integrates seamlessly with AWS, Azure, and Google Cloud.

Easy to set up and scale
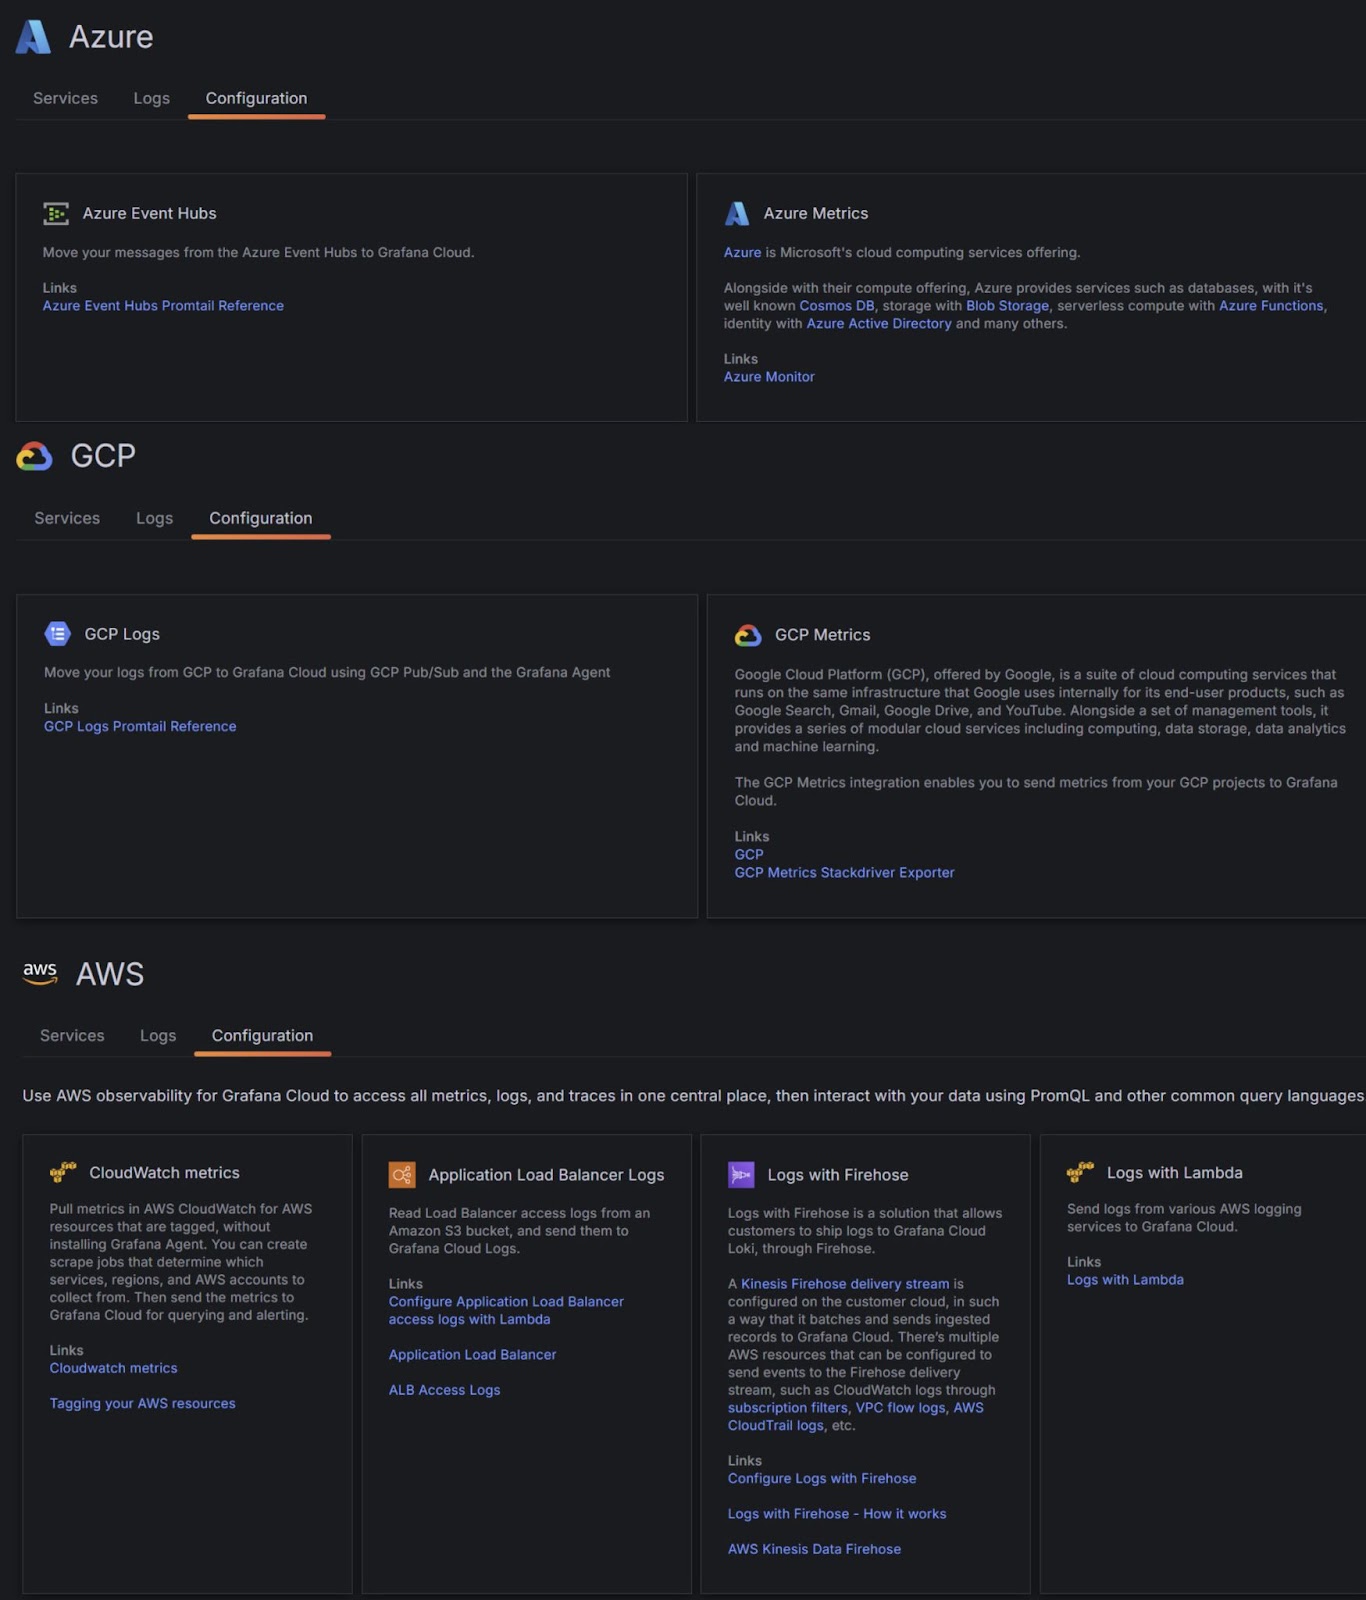
Getting started with Cloud Provider Observability is quick and straightforward. The app provides comprehensive scraping instructions, enabling you to start ingesting cloud provider telemetry without any extra work. Whether you’re dealing with AWS’s Elastic Load Balancing, Azure SQL Databases, or Google Cloud Storage, the app automatically configures and scales to meet your needs, so you can focus on more critical tasks.

Instant service detection
When you connect to any of these cloud providers, Grafana Cloud immediately detects all supported services. This feature eliminates the need for manual effort, saving you time and ensuring your services are monitored from the moment they are deployed.
Here is a full list of currently supported services per cloud provider:
Supported services in Azure
- Azure SQL Database
- Azure SQL Elastic Pool
- Azure Virtual Network
- Azure Service Bus
- Azure Event Hubs
Supported services in Google Cloud
- Google Cloud SQL
- Google Cloud Pub/Sub
- Google Cloud VPC
- Google Cloud Storage
Supported services in AWS
- Amazon CloudFront
- Amazon EBS
- Amazon ECS
- AWS ELB Application Load Balancer
- AWS ELB Classic Load Balancer
- AWS Lambda
- AWS NAT Gateways
- Amazon RDS
- Amazon S3
- Amazon SES
- Amazon SQS
- AWS VPN
Improve MTTR across multi-cloud environments
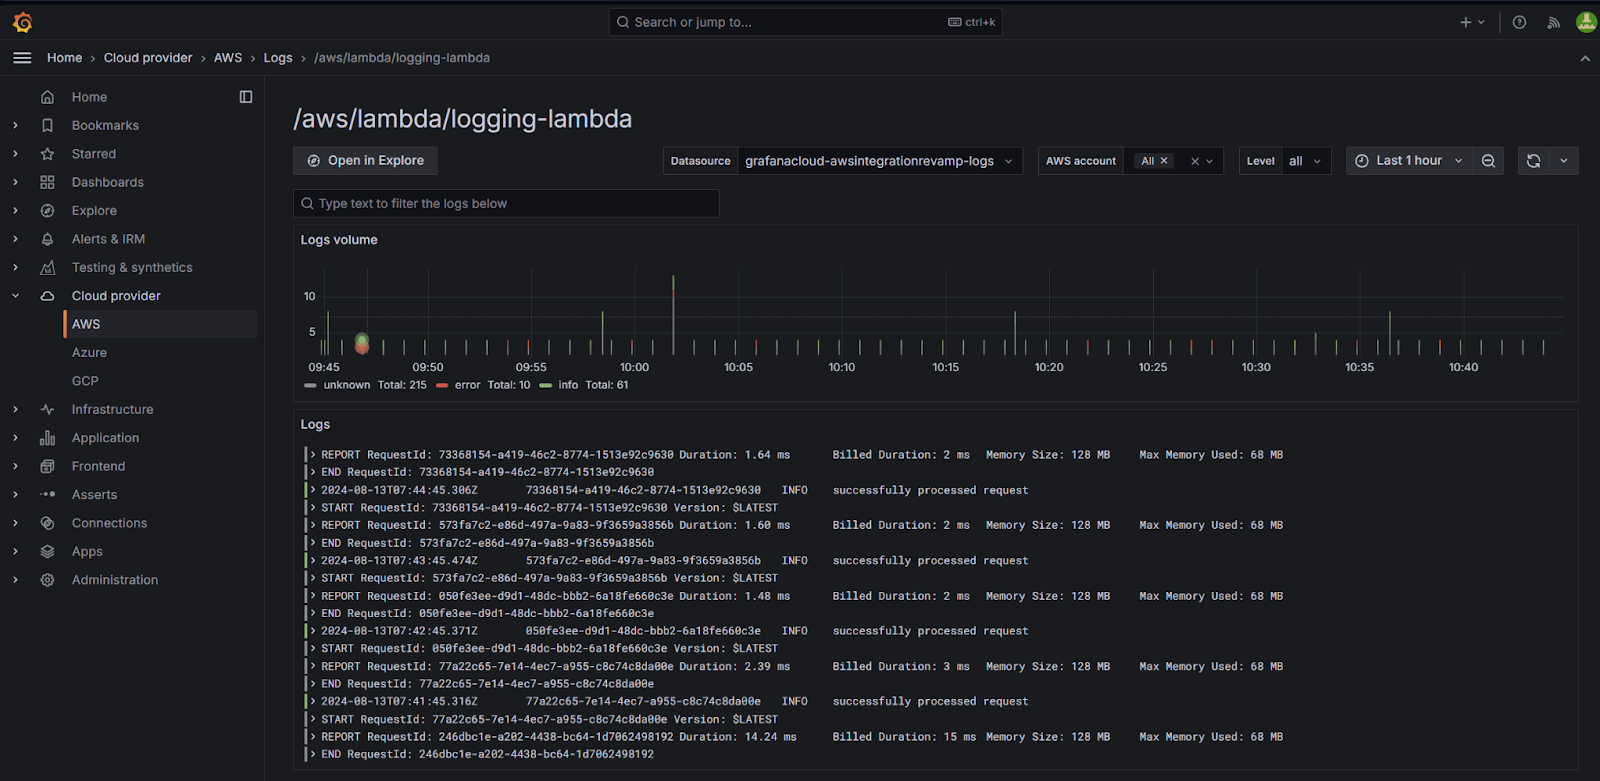
Cloud Provider Observability also offers detailed log views designed to make troubleshooting more intuitive and effective. Logs are displayed in a clear, actionable format that helps reduce mean time to resolution (MTTR), which is crucial in multi-cloud environments where issues can span across different providers.

GCP and Azure observability, powered by Grafana Alloy
For Google Cloud and Azure users, the Cloud Provider Observability app leverages Grafana Alloy — our open source OpenTelemetry collector with built-in Prometheus pipelines and support for metrics, logs, traces, and profiles — providing actionable insights for managing metrics and logs.
We’re currently working towards feature parity with our AWS offerings, and will soon include the same serverless and agentless options that our AWS customers appreciate for GCP and Azure.

How to get started with Cloud Provider Observability
- Setup and configuration: Follow our easy-to-use scraping instructions to begin ingesting telemetry data from your cloud providers. The process is designed to be as seamless as possible, with out-of-the-box dashboards that offer immediate insights.
- Service discovery: Utilize the app’s automatic service detection to ensure comprehensive monitoring from day one. This feature continuously scans for new services and integrates them into your monitoring dashboards automatically.
- Navigation: Access all your cloud monitoring tools via the new Cloud provider navigation item in Grafana Cloud, simplifying the user experience.
- Monitoring and troubleshooting: Leverage pre-configured dashboards for efficient troubleshooting, and use the dedicated log views to quickly identify and resolve issues.
Learn more about multi-cloud monitoring in Grafana Cloud
Cloud Provider Observability in Grafana Cloud simplifies monitoring multi-cloud environments and provides more comprehensive insights across your services. With its unified monitoring capabilities, easy setup, automatic service detection, and dedicated log views, this solution empowers your team to manage complex, multi-cloud environments with confidence and efficiency.
To learn more, check out our Cloud Provider Observability documentation.
Grafana Cloud is the easiest way to get started with metrics, logs, traces, dashboards, and more. We have a generous forever-free tier and plans for every use case. Sign up for free now!


