Grafana Cloud updates: new data visualization options, enhancements to Grafana Cloud k6, and more
We consistently roll out helpful updates and fun features in Grafana Cloud, our fully managed observability platform powered by the open source Grafana LGTM Stack (Loki for logs, Grafana for visualization, Tempo for traces, and Mimir for metrics).
In case you missed it, here’s a roundup of the latest and greatest updates for Grafana Cloud this month. You can also read about all the features we add to Grafana Cloud in our What’s New in Grafana Cloud documentation.
And if you’re not a Grafana Cloud user yet, sign up for an account today! You can try any of these features (and more) for free with our generous Cloud Free plan.
New options for data visualization
We’re always exploring new and creative ways to help you visualize and derive insights from your data. This month, we’re excited to share the following updates to the data visualization experience in Grafana Cloud.
Pagination in state timelines
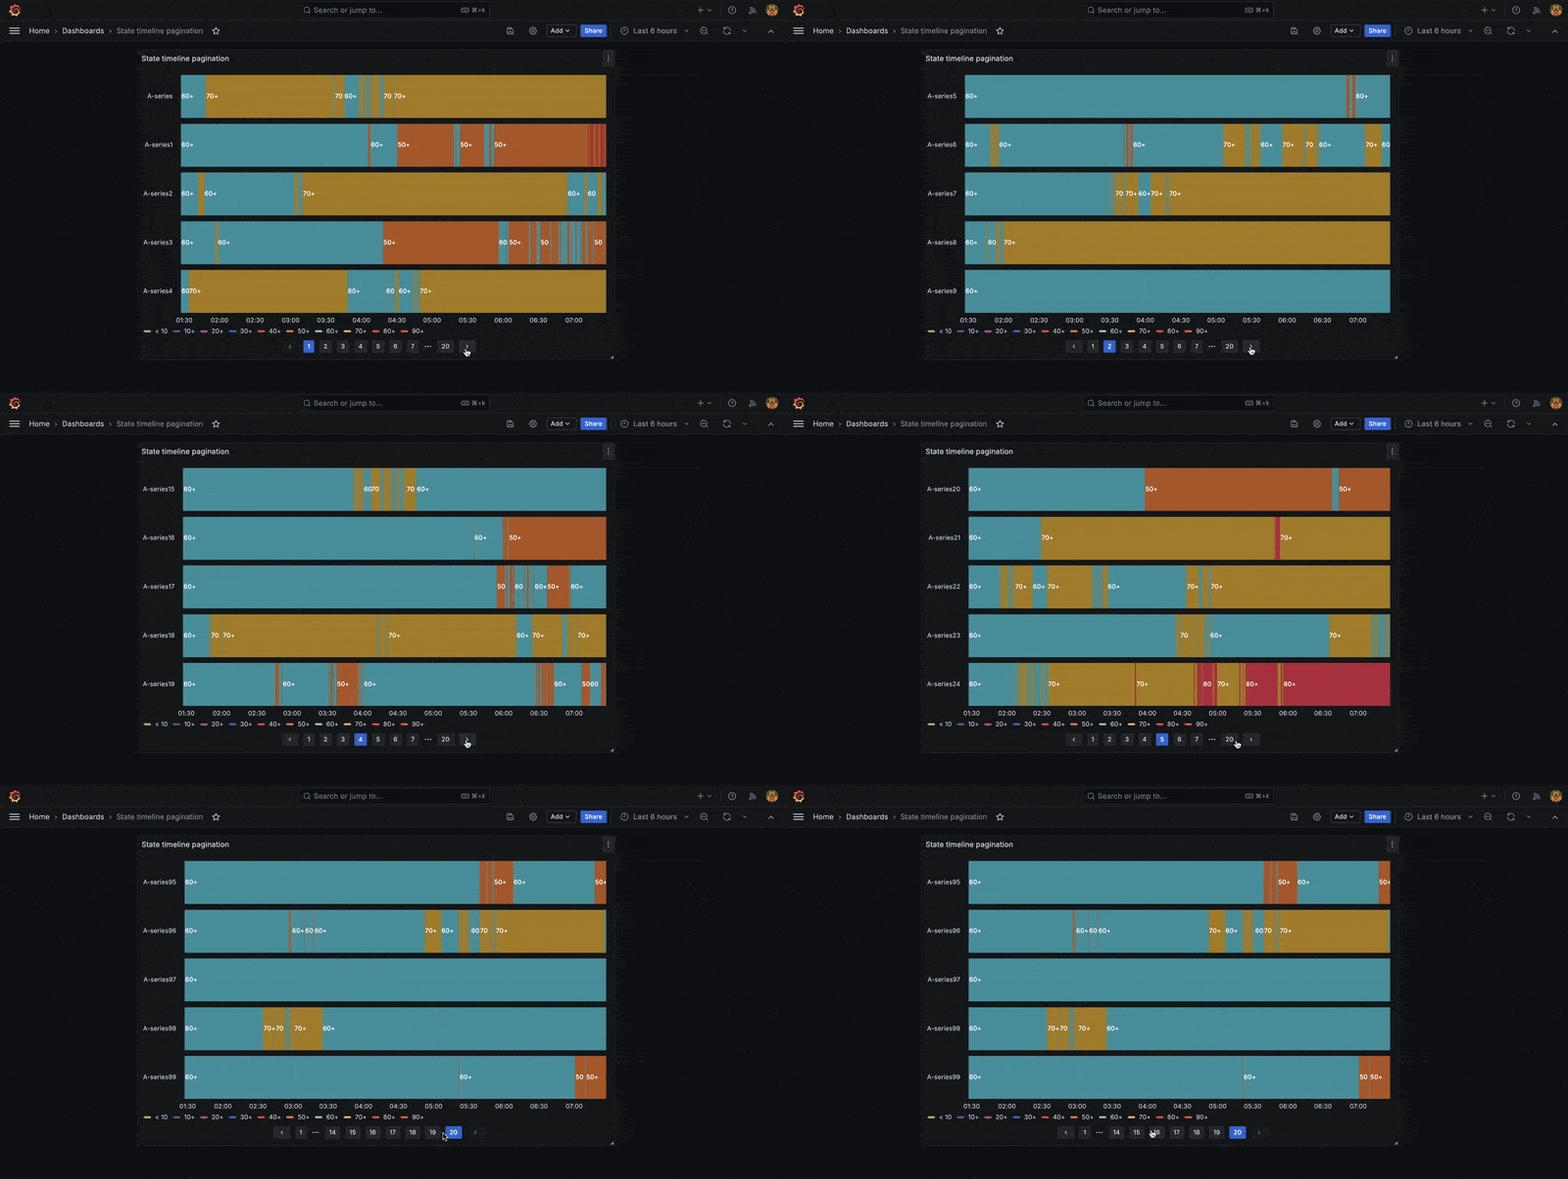
The state timeline visualization now supports pagination, a feature that’s especially useful when running a query on a dynamic data source.
With the Page size option, you can paginate the state timeline visualization to limit how many series are visible at once. Previously, all the series in a state timeline were made to fit within the single window of the panel, which could make it hard to read. With paginated results, the visualization displays a subset of all series on each page. Even cooler? This new feature is based on a community contribution.

Updates to transformations
In Grafana, transformations are a powerful way to manipulate data returned by a query before applying a visualization. We recently rolled out new capabilities for transformations, including:
- The use of variables in some transformations: Template variables are now supported for the Limit, Sort by, Filter data by values, Grouping to matrix (another community contribution ⭐️), Heatmap, and Histogram transformations. This enables dynamic transformation configurations based on panel data and dashboard variables.
- The ability to pivot data frames: With our new transpose transformation, you can pivot the data frame to convert rows into columns and vice versa. This feature is particularly useful for data sources that don’t support pivot queries, enabling more flexible and insightful data visualizations.

For more information, refer to our documentation.
Enhancements to Grafana Cloud k6
This month, we’re sharing several updates to Grafana Cloud k6 — our fully managed performance testing platform powered by Grafana k6 — related to visualizing test results, automation, and security. Here are the highlights.
Export browser tests to a dashboard summary
We recently announced that Grafana Cloud k6 browser tests are generally available. With browser testing, you can measure the performance and UX of web applications, including important metrics such as Core Web Vitals.
Now, you can export your browser test results as a Grafana dashboard to easily view and analyze those important metrics. The exported summary breaks down each metric and explains the impact your application’s performance might have on users. You can share this summary with your team and other stakeholders to identify opportunities for optimization and improve the user experience.

To learn more, check out our technical docs.
Integrate Grafana Cloud k6 into CI/CD pipelines
We have released two new k6 GitHub actions to make it easier to automate your Grafana Cloud k6 performance testing suite and projects:
- setup-k6-action: Use this action to install a specific k6 version in your CI/CD workflow. It provides flexibility when running multiple testing projects, and helps accelerate the execution of testing jobs.
- run-k6-action: With this action, you can run local and cloud tests, as well as upload test results to Grafana Cloud k6. It can also be used to execute browser tests, hybrid performance tests, and pass CLI flags, among other capabilities.
You can learn more about these k6 GitHub actions in our technical docs and this blog post.
Role-based access control
Role-based access control (RBAC) is now available in Grafana Cloud k6!
The new Performance Testing roles in your Grafana Cloud stack offer you fine-grained control over what a user or team can do in the k6 performance testing application, regardless of their Grafana Stack role. By default, your stack role (Admin, Editor, or Viewer) is used for your Grafana Cloud k6 RBAC roles. You can also dive in and customize your RBAC configuration to fit your exact needs.
Some new RBAC capabilities include:
- Performance testing application controls: Define who can manipulate testing environment variables, create new testing projects, and set up testing schedules.
- Per-project controls: Limit who can start performance tests, view test results, and set project usage quotas.
Learn more about how to configure RBAC in Grafana Cloud in our documentation.
Centralized view of alert history
Speaking of unified monitoring, it’s also now possible to see the history of all alert events generated by your Grafana-managed alert rules from one centralized page.
With this new, unified view, you can quickly spot patterns in your alerts over time, observe trends, make predictions, and even debug alerts that might be firing too often. An alert event is displayed each time an alert instance changes its state over a period of time. All alert events are displayed regardless of whether silences or mute timings are set, so you’ll see a complete set of your data history — even if you’re not necessarily being notified.

Energy data in Kubernetes Monitoring
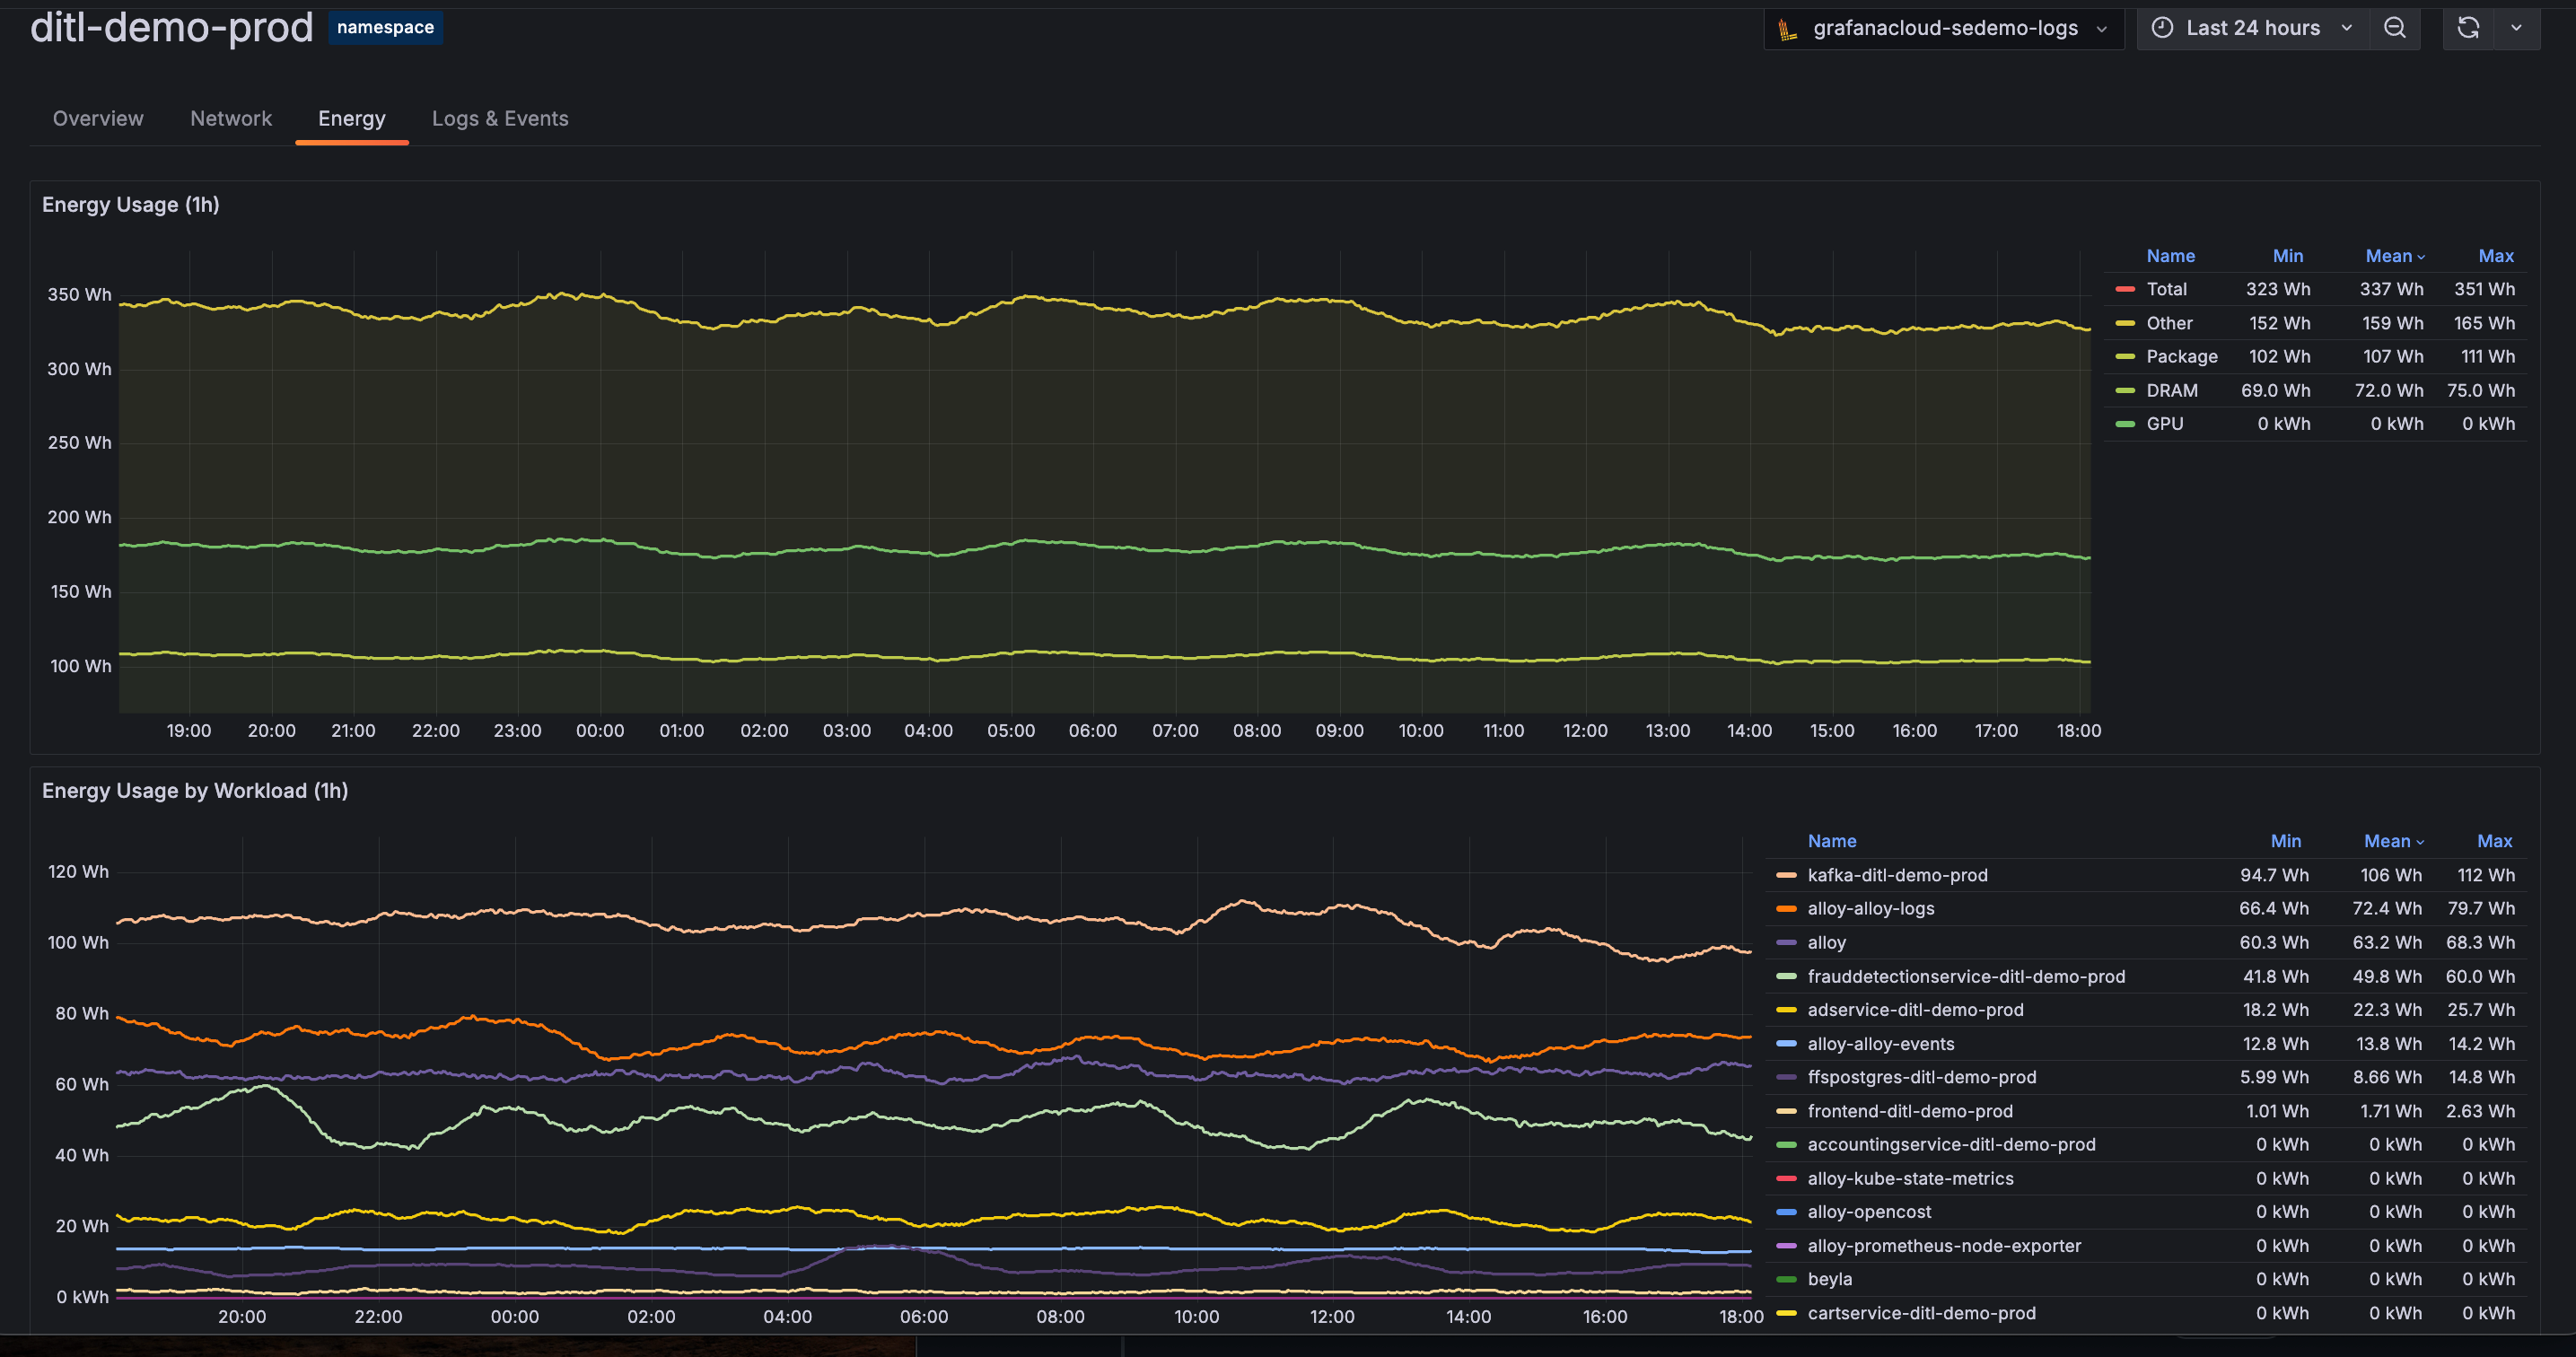
Interested in seeing energy usage metrics related to your Kubernetes infrastructure components? Well, now you can in Grafana Cloud Kubernetes Monitoring.
On any detail page, simply click the Energy tab to view the energy usage of Kubernetes workloads and namespaces, clusters, nodes, pods, and containers.

To learn more, check out our technical docs for Kubernetes Monitoring.
Support for native histograms
Native histograms are a data type in Prometheus that can produce, store, and query high-resolution histograms of observations. They usually offer higher resolution and more straightforward instrumentation than classic histograms.
There are advantages of using native histograms compared to the classic Prometheus histograms.
- Simpler instrumentation: You do not need to think about bucket boundaries because they are created automatically.
- Better resolution in practice: Custom bucket layouts are usually not high resolution.
- Native histograms are compatible with each other: They have an automatic layout, which makes them easy to combine.
To learn more, and to get information about the private preview for this feature, check out our technical docs.
Grafana Cloud integration updates
We’re always expanding and updating our line-up of Grafana Cloud integrations. Some of the latest updates include:
- VMware vSphere: You can now easily monitor your deployment of the vSphere virtualization platform with Grafana Cloud.
- Alloy Health: You can use this integration to monitor the metrics and logs of Grafana Alloy instances.
- HTTP code histograms have been added to the Apache HTTP Server integration.
- Kubernetes support has been added to the Apache Hadoop, Apache Mesos, and Squid integrations.
- Asserts support has been added to the Docker, MongoDB, MySQL, and Windows integrations.
New Enterprise data source plugins
We’ve also been steadily expanding our catalog of Enterprise data source plugins. All Enterprise plugins are fully supported by Grafana Labs and are available across all tiers of Grafana Cloud, including our generous forever-free tier. Here are some of the new data sources you can use to query and visualize data:
Our roadmap for data sources
We’re also excited to share a new public roadmap for data source plugins being built by Grafana, our partners, and our community. All existing and potential users of Grafana can now see our current plans and request new plugins, upvote existing requests, or comment with ideas and requirements.
Grafana Cloud is the easiest way to get started with metrics, logs, traces, dashboards, and more. We have a generous forever-free tier and plans for every use case. Sign up for free now!


