Empowering every user: How Schwarz IT harnesses Grafana Enterprise for their diverse observability needs
At Schwarz IT, they have a mission statement: deliver the right information to all employees, at the right time, and through the right channels. And to achieve that goal, they use Grafana.
“Grafana is an interface for everyone,” says Felix Spitzer, Monitoring Specialist at Schwarz IT, the internal IT service provider for multinational retailer the Schwarz Group. “We have teams that are working closely with Grafana that are very technical, but we also have teams using it that are not technical users. With Grafana, we reach more customers — a bigger variety of users — than ever before.”
In fact, this versatility was one of the biggest reasons Schwarz IT chose to implement Grafana OSS in 2014, and then later move to Grafana Enterprise in 2022. Yes, the team found significant value in being able to centralize and streamline their overall monitoring strategy with Grafana, but the “biggest selling point” for the platform, they say, is its ability to empower such a wide variety of users — both business and technical — to visualize the data that’s most important to them.
“Our internal customers know best what they need to see and how to interpret it,” says Michael Dallmann, team lead for Monitoring and Observability Solutions at Schwarz IT. “With Grafana, we provide a tool where the customer can build their own view.”
Schwarz IT, headquartered in Germany, is responsible for the IT infrastructure and software solutions that support the various divisions of the Schwarz Group. These include the Lidl and Kaufland food retailers; food production firm Schwarz Produktion; environmental services provider PreZero; and digital innovation firm Schwarz Digits. All in all, Schwarz IT ensures IT operations run smoothly for roughly 575,00 employees across 32 different countries.
Today, Grafana Enterprise is used by more than 100 organizations within Schwarz IT. They have more than 6,000 dashboards and close to 1,500 active users. In addition, Schwarz IT supports the open source Grafana instances used by Lidl and Kaufland.
But the monitoring team has done so much more than enable users to visualize data in Grafana. With a commitment to knowledge-sharing and dedicated time for innovation (hackathons, anyone?), they’ve fostered an active and thriving Grafana community that today spans nearly all facets of the Schwarz Group.
“We don’t have a community around other tools like we have with Grafana,” says Spitzer. “I would say a big part of that community is because you can use Grafana in so many different ways.”
Grafana Labs recently sat down with Spitzer to talk about the variety of ways Schwarz Group employees use Grafana, how his team has supported such large-scale adoption, and the unique culture and community Schwarz IT has created around the observability platform.
Note: The below interview has been edited for brevity and clarity.
Can you tell us more about the team you’re on at Schwarz IT?
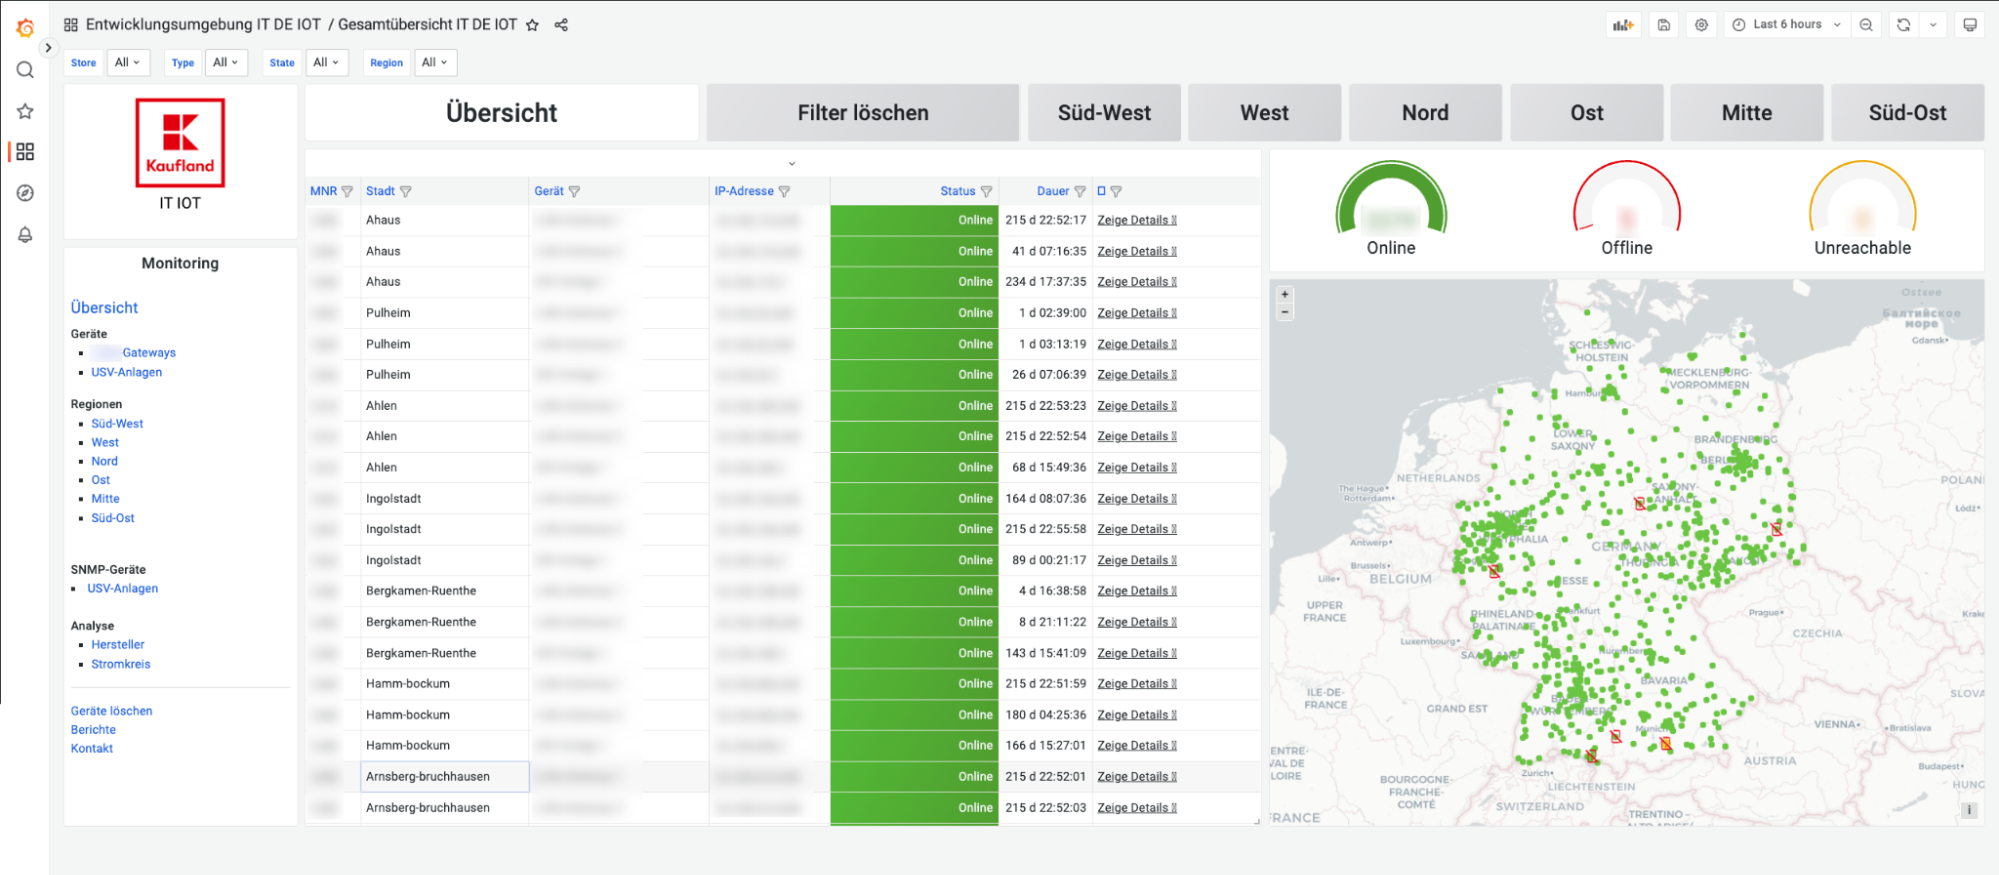
Felix: On the monitoring solutions team – we are about 18 people at the moment — we are supporting the Lidl and Kaufland countries, mostly, and the internal IT colleagues when they have monitoring questions. We maintain the monitoring environment. We have different products including Splunk, Dynatrace, our own Open Monitoring Distribution appliance with the NAGIOS fork Naemon, Prometheus, and Grafana, which is a very, very big part of it at the moment. We use Grafana Enterprise to monitor the health of systems, including our network, website and Windows Server.
We use Grafana Enterprise as the foundation for all the raw monitoring data we have, and then we provide and administer open source Grafana instances, so other teams can also use it for themselves.

What are some of the other Grafana use cases you see across Schwarz IT or the Schwarz Group, more broadly?
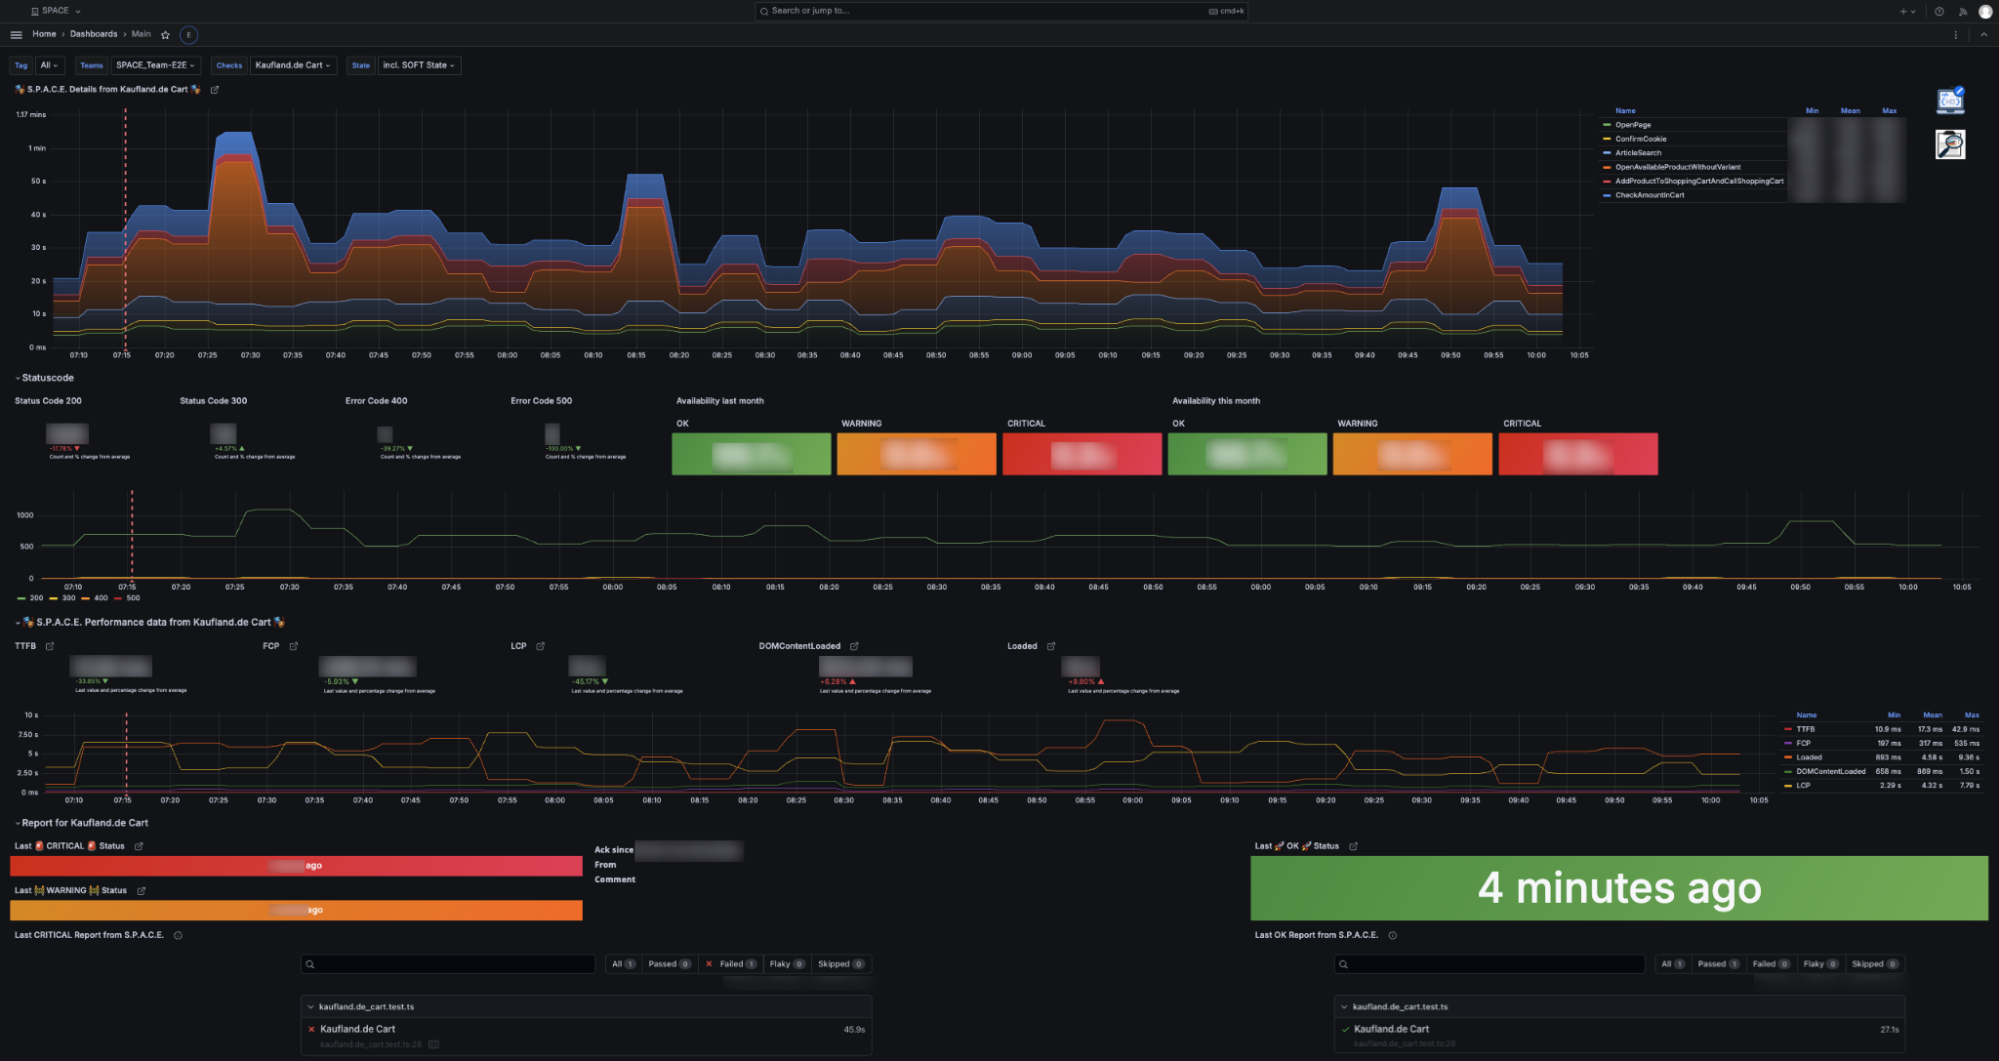
Felix: So, the website teams use Grafana for an overview of JavaScript errors. We also have a team that created their own end-to-end website monitoring program that simulates user input and then uses Grafana as an endpoint to display results related to response time and latency.
We have a team using Grafana to track orders and check the resources and warehouses for Lidl food retailers. They have big data in Oracle and MongoDB, and then get the data into Grafana, where they can track, for example, the stock of a product across different stores in the German division.
The countries have different use cases because they want to monitor things that are specific to their retail stores.

How did you help facilitate Grafana adoption at such large scale?
Felix: We started to get specific questions about how to do things in Grafana. Grafana Labs has very good webinars and videos on their site, but they aren’t customized for our environment.
So we started our own internal Grafana training. We created this big Teams channel where we share dashboard ideas, the next big thing we’re going to try, success stories — and everyday somebody new would join. We would look for customers using Grafana and ask them about their use case and dashboards, and ask them to share a blog post about it on our Teams channel.
We also hold a training session every three to four months. We are doing a basic one and are starting an advanced one this year. But every training is around 100 users. It’s very big, and we need even more.
What inspired you to host your internal Grafana hackathon and what has the impact been?
Felix: The idea for the first hackathon in March 2023 stemmed from wanting to help drive Grafana use within the countries. In person, you can do little team workshops and be face-to-face — we wanted knowledge transfer. The Schwarz Group is so big and the Lidl countries are like their own companies, so there isn’t much knowledge transfer or communication between them. So we thought, okay, we are like the connection point for them. Let’s create a hackathon.
We had an agenda where we showed them our goals. Then we asked about their goals with Grafana and what problems they wanted to solve. We were brainstorming with the different countries, and then we broke off into groups to build a dashboard for their particular problem. Everybody then shared their dashboard and was really excited; people were sharing the JSON because everybody was like, “yeah, I need that.”
After the hackathon, we had a very big increase in Grafana usage throughout the countries. In a few weeks, there was an increase of more than 100 dashboards. And that was one of our main goals.
You use a number of products in your monitoring stack. Why focus only on Grafana for these hackathons?
Felix: Because you can use Grafana in so many different ways; we are using it as a visualization layer for everything. That’s created this sense of community, and it’s why the hackathons work so well. We’re really trying to push all the data we have to Grafana, making it possible for the end user who’s not technical, and the one who is technical, to use the same interface.
What’s next for Schwarz IT?
Schwarz IT recently held a second Grafana hackathon for their IT hub in Sofia to further expand Grafana usage.
“We will also push standard dashboards for the countries to use predefined views and include business process monitoring visualizations,” said Michael Dallman, team lead for Monitoring and Observability Solutions. “For the countries, we will also set up a deep dive for all our monitoring tools, which will include, of course, Grafana.”


