Observing exchange rates: How to keep tabs on currencies during the summer travel season
It’s summertime in the Northern Hemisphere, and for many people that means it’s also travel season. But before you depart for your dream holiday, don’t forget the essentials: passport, suitcase, and … Grafana?
That’s right. If you’re headed to a different country, odds are you’ll use a different currency when you get there. And you can use Grafana to track changes in the exchange rates so you can get the most bang for your buck.
Exchange rates are set by the foreign exchange market (also known as forex or FX), a global decentralized market for currency trading. The value of any currency on this market is determined by its exchange rate with another currency. For example, it’s actually possible to make a profit by buying 1,000 U.S. Dollars (USD) for 0.7 Great British Pounds (GBP) at 9 a.m. and selling it for £0.708 later that same day, a whopping $8 profit (before any fees or commission) — give yourself a pat on the back and buy an extra little something at the gift shop with your earnings!
In this blog post, we won’t get into what causes these fluctuations. Instead, we’ll show you how you can monitor them so you can stay informed and react when rates are in your favor. For the remainder of this piece, we’ll walk through how we can use Prometheus and Grafana Cloud to:
- Get the latest forex rates from openexchangerates.org and expose them as Prometheus metrics
- Scrape the forex rate metrics using Grafana Alloy and forward them to Grafana Cloud
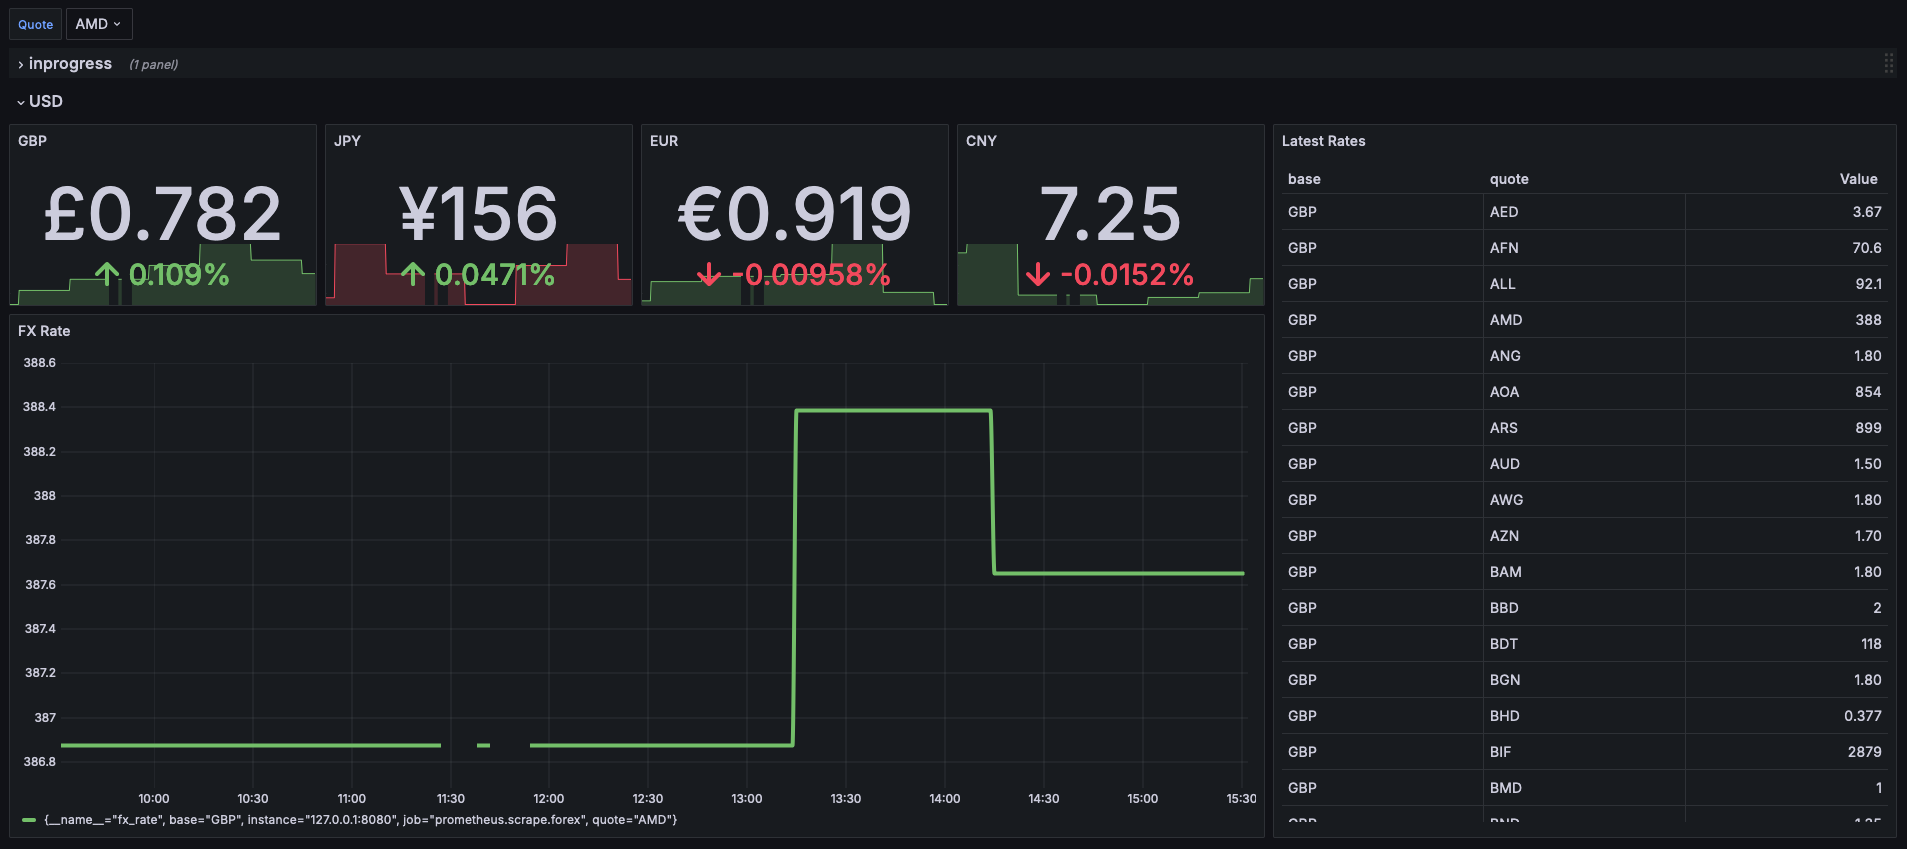
- Visualize the changes in forex rates
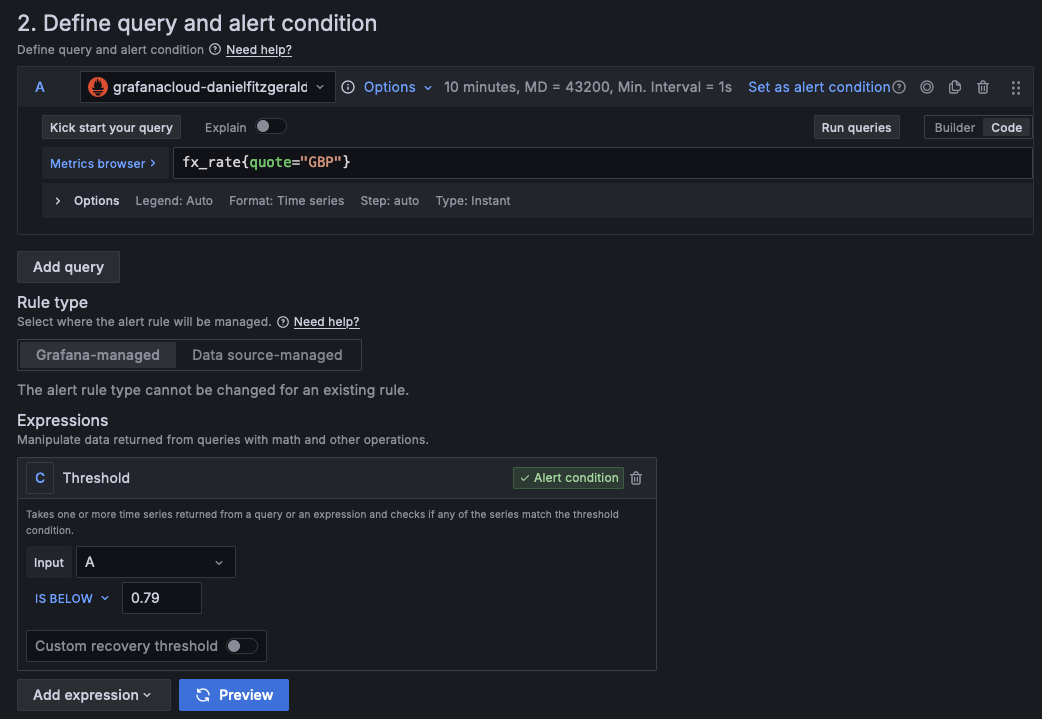
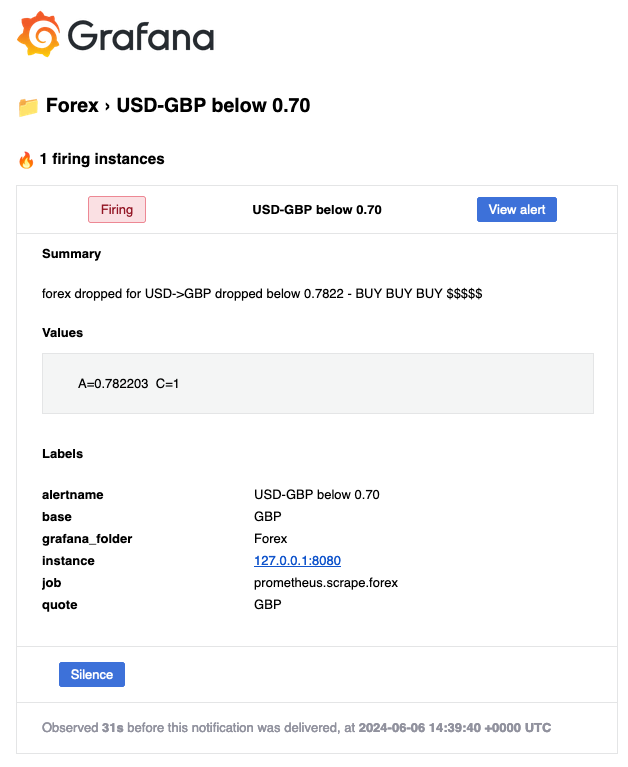
- Define alerts to be notified of changes in forex rates even when we’re not looking at our dashboard
How to monitor exchange rates with Grafana Cloud
To get started, follow these steps:
- Log into Grafana Cloud. If you don’t have one already, you can sign up for a forever-free account today.
- Sign up for the free plan at https://openexchangerates.org/signup and create a new APP_ID — make note of it, as you’ll need it later.
- Run the forex Prometheus exporter as a Docker container on your local machine.
- Go to your Grafana Cloud Admin panel. Under the Prometheus section, click Send Metrics, then find the Remote Write Configuration section, generate a new token, and copy the generated configuration.

- Install Grafana Alloy, our vendor-neutral distribution of the OpenTelemetry (OTel) Collector, according to your operating system.
- Edit the Grafana Alloy configuration file to scrape the
/metricsendpoint exposed by the forex Prometheus exporter. Here I have used the remote write configuration from step 4 and added a scrape target, which is our running forex exporter container. Once you have edited the configuration file, you need to restart Alloy for the configuration to take effect. - You should now be seeing a metric in Grafana Cloud. Verify that it’s working by heading to your Grafana Cloud instance and going to Explore — you should see a metric called
fx_rate - Now you can run queries, make dashboards, and set up alerts based on the forex rate. Below I’ll show some examples for your inspiration


Potential areas for further exploration
I hope you’ve found this guide to monitoring forex rates helpful. If you want to expand this exercise further, either to keep a closer tab on forex rates or to just get better acclimated to what you can do in Grafana Cloud, try one of the following:
- Define a rotation in Grafana OnCall with your travel companions so you know when the exchange rate is favorable enough to snap up a holiday bargain.
- Use the candlestick visualization, which is commonly used in forex rate visualizations.
Grafana Cloud is the easiest way to get started with metrics, logs, traces, dashboards, and more. We have a generous forever-free tier and plans for every use case. Sign up for free now!


