Industrial IoT visualization: Why United Manufacturing Hub chose Grafana to power its IIoT platform
Denis Gontcharov is a data consultant who helps aluminum smelters break down data barriers. For the past five years, he has supported the aluminum industry with IT and data services as an independent consultant. Denis also works as a Developer Advocate at the United Manufacturing Hub.
Jeremy Theocharis is co-founder and CTO at United Manufacturing Hub. He is an expert in industrial IoT with over seven years of experience leading large-scale IIoT projects in various industries. With a background in mechanical engineering and business administration, he has been a programmer since he was 14 years old and has published several articles on topics such as scalable data processing in IIoT.
Most IT professionals are familiar with Grafana as a visualization tool to monitor IT telemetry data, such as CPU consumption. Grafana is also, however, a powerful tool for industrial IoT (IIoT) — which is why our team at United Manufacturing Hub (UMH), a startup that provides an open source industrial IoT platform for enterprise manufacturers, chose to leverage Grafana in our core product.
In this article, we’ll explore why UMH grew frustrated with specialized industrial visualization solutions, how those solutions compare to Grafana in the IIoT space, and, lastly, how Grafana is creating a positive business impact for manufacturers.
Grafana data visualization: from home automation to IIoT
Grafana has become the de facto standard for visualization in IIoT. At major industrial fairs, such as the Hannover Messe in Germany (one of the largest in the world), Grafana is prominently featured at many IIoT booths. Dashboards built with Grafana display data from all layers of the manufacturing enterprise: from the boardroom all the way to the shop floor. While the CEO observes their company’s high-level financial KPIs, the machine operator can keep a watchful eye on the critical parameters and real-time process values.
But how, exactly, did Grafana gain such widespread adoption in manufacturing? At UMH, we believe it’s because Grafana found its entry via the home automation niche, where it became popular for visualizing metrics from IoT sensors.
Hobbyists experimenting with Grafana in personal projects realized its potential at work. After all, if you can display the temperature of your living room in real time, why not the temperature of your melting furnace on the manufacturing floor? This realization is what led the team at UMH to choose Grafana for visualizing client’s sensor data.
Why Grafana beats existing industrial technologies
But wait — why did UMH, along with other IIoT vendors at the Hannover Messe, put our faith in Grafana? Why not simply implement any of the existing industrial products that are specifically designed for manufacturing?
The reason is simple: the existing industrial products weren’t meeting our needs. To be fair, some of these tools do have advantages over Grafana in some niche applications. Nevertheless, the market has demonstrated a clear preference for Grafana in general applications. Some of the key reasons for this are:
- Although the manufacturing industry, being rather traditional, is generally wary of modern open source IT tools, Grafana has a mature reputation, given that it’s been around for over a decade.
- Open source tools like Grafana are incredibly cost-effective, especially compared to some of the manufacturing-specific solutions, such as industrial Human Machine Interfaces (HMIs). In essence, businesses can save a lot of money by leveraging a combination of powerful, modern IT technologies, such as Grafana and TimescaleDB (more on that below), rather than stick with more traditional manufacturing solutions and HMIs.
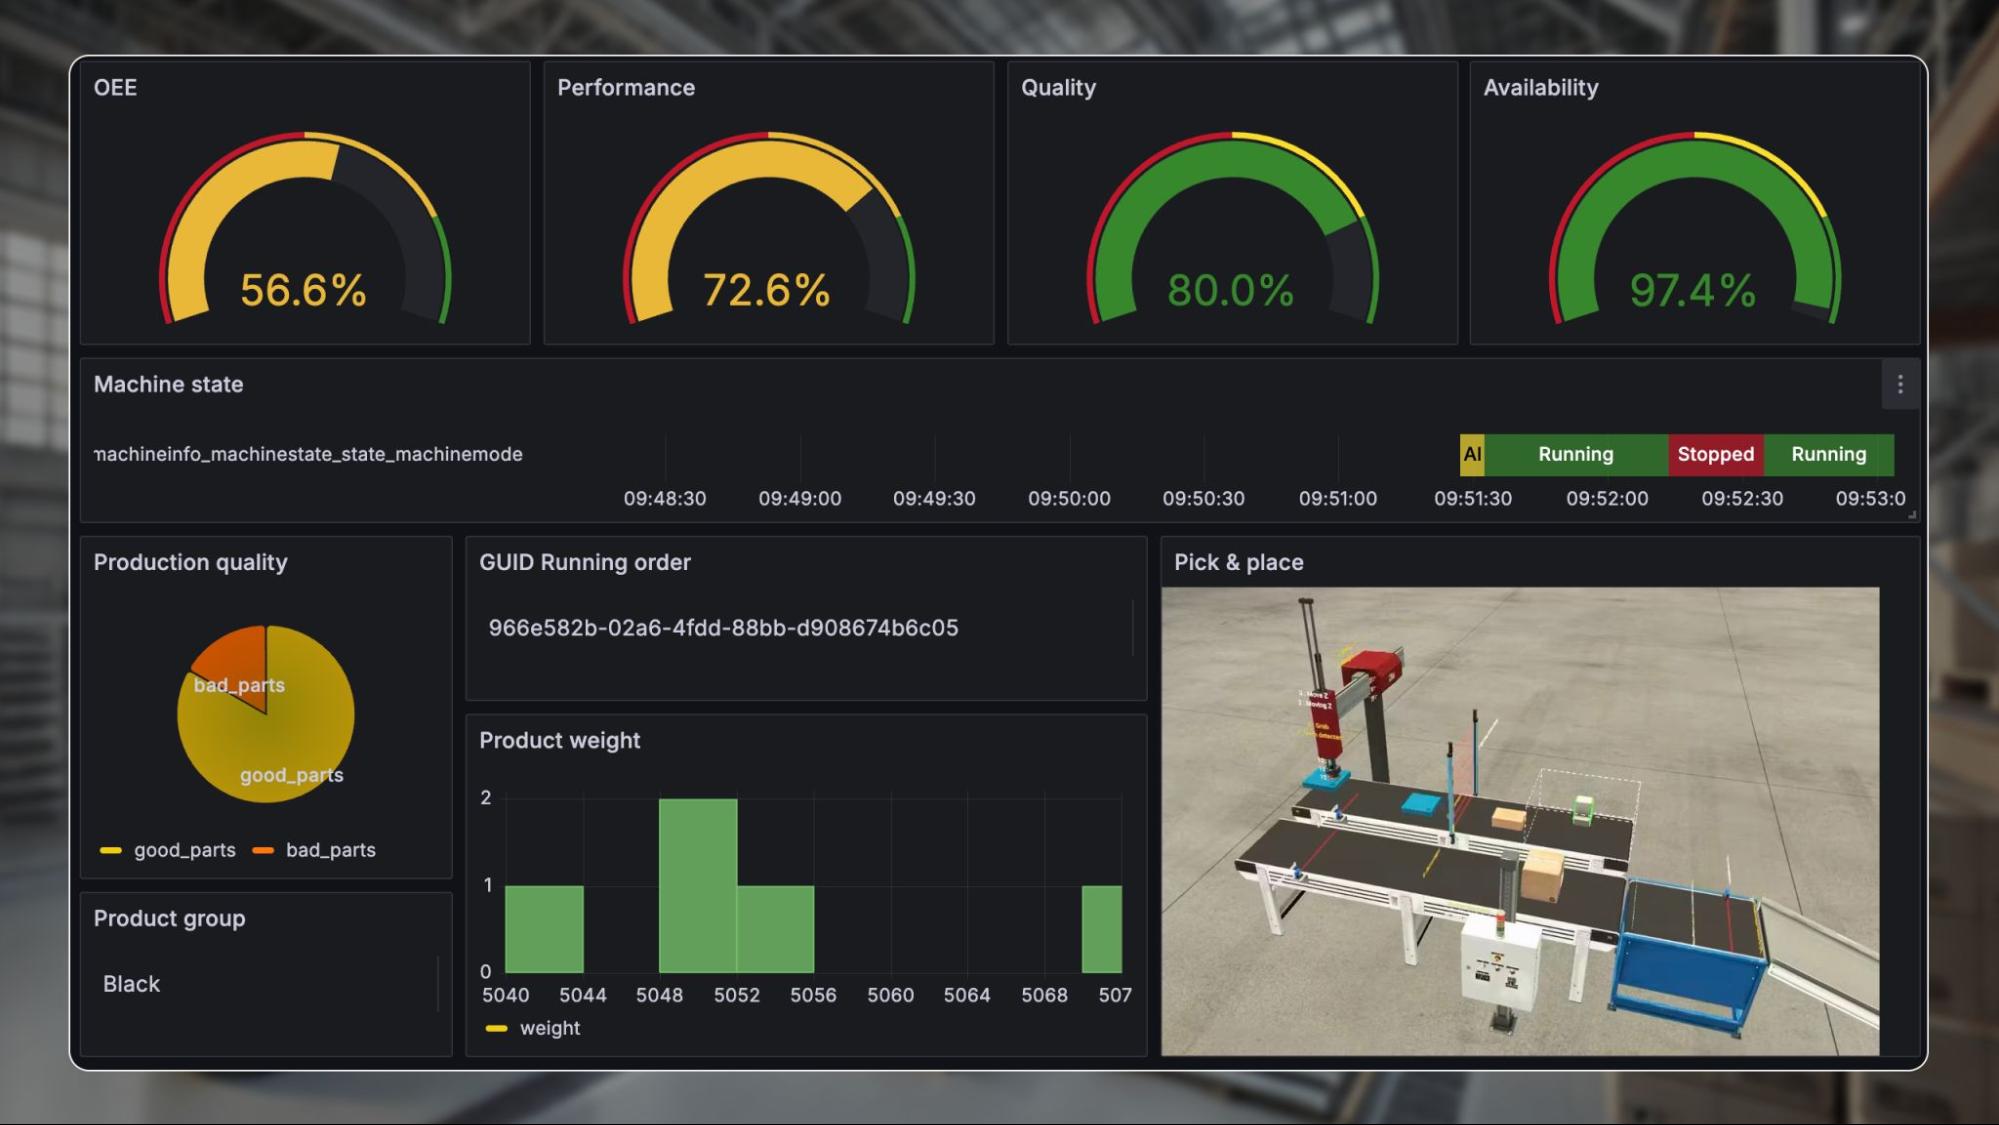
- HMIs often have a user interface that feels limited and antiquated compared to Grafana’s sleek and visually compelling dashboards (example below).

Another advantage of open source tools like Grafana is the large online community behind them. The availability of public knowledge makes it easy for inexperienced users to find help and ramp up quickly. This means manufacturers won’t get stuck on some niche edge case. There’s also a large gallery of community dashboard templates.
In addition, open source technologies provide unhindered access to data. This may sound trivial, but it’s not uncommon for traditional historians — which are storage and visualization solutions for manufacturing data — to save their data in a proprietary file format, hampering the ability to transfer data to an external system, including those in the public cloud.
The main reason, however, that Grafana became so popular is its ease of use. Given Grafana’s single-pane-of-glass approach to data integration, visualizing data from disparate sources is very convenient: there is no need to combine the data in a backend store or some other vendor’s database — you can unify all your data wherever it lives. Once the data is made available in Grafana, it’s easy to create beautiful visualizations.
While Grafana is a powerful visualization solution for real-time data, it’s not possible to directly send information from Grafana back to an industrial controller (as you can with some specialized industrial solutions). This isn’t a dealbreaker, however. With the Business Forms panel (previously called the Data Manipulation panel) plugin for Grafana, data can be sent from the dashboard to a database. This workaround allows communication between the Grafana dashboard and the underlying process by means of the database.
Note: If you are embedding Grafana or Grafana Enterprise in a product for third parties to access, please ensure you have reviewed the open source license or your commercial agreement with Grafana Labs. If you are interested in embedding Grafana for a commercial application, please reach out to OEM@grafana.com.
How Grafana helps power the UMH stack
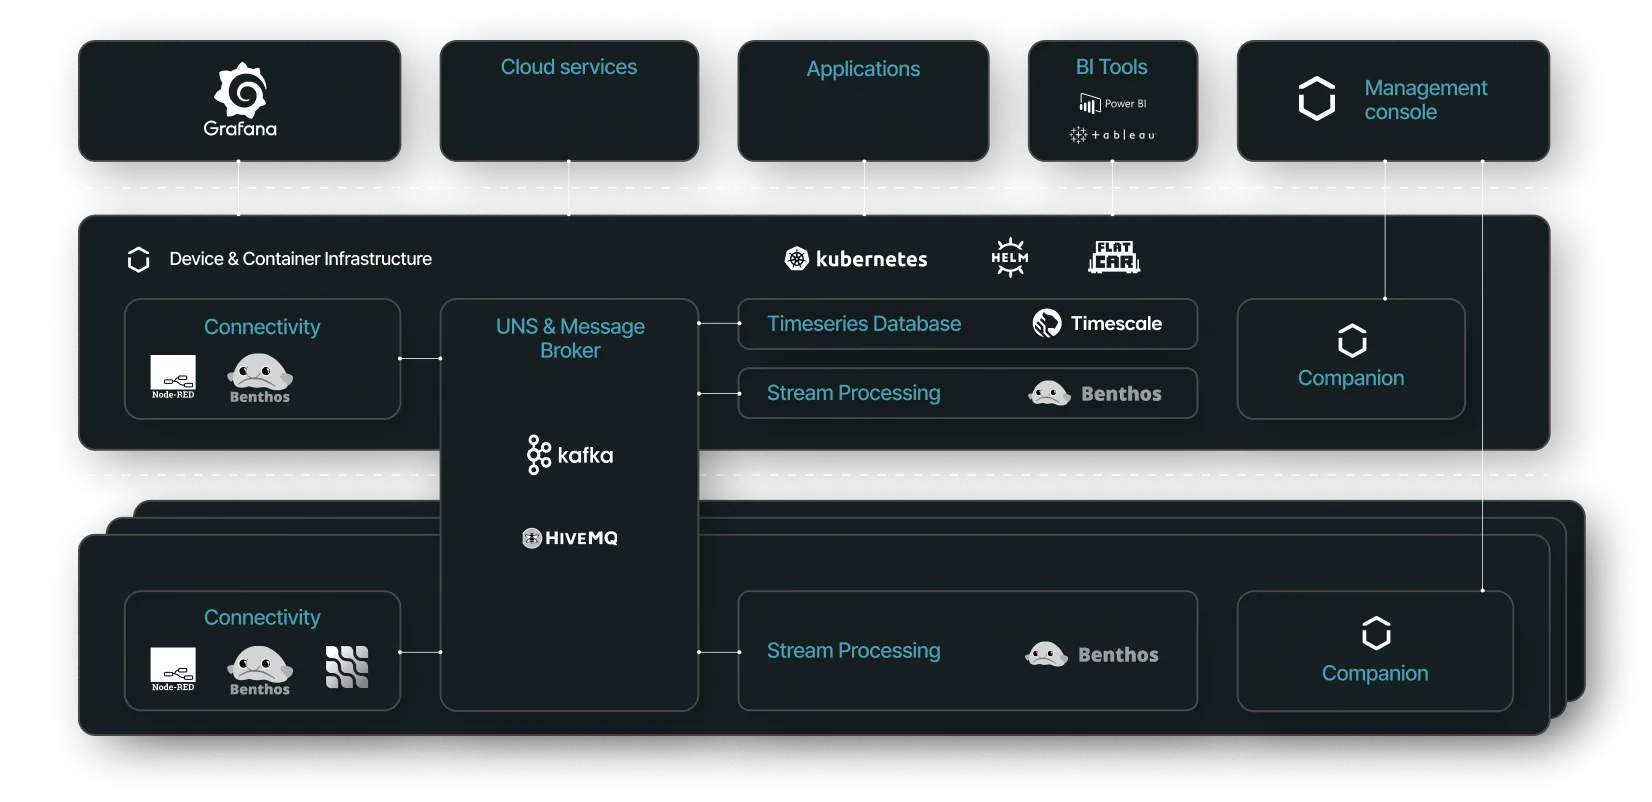
Grafana is a core component of UMH’s open source IT/OT Integration Platform. The UMH system operates by initially extracting data from various sources, such as Programmable Logic Controllers (PLCs), which is then streamlined into a central integration point known as the Unified Namespace. This framework utilizes MQTT and Kafka to ensure robust data handling. Within this Unified Namespace, time series data — commonly referred to in the industry as tags (unique identifiers for data points) — is systematically organized and subsequently stored in the open source historian.
Together with the open source TimescaleDB database, which is based on PostgreSQL, Grafana forms an essential part of this open source historian setup. The setup not only stores, but elegantly visualizes, time series data from manufacturing and IIoT devices. Grafana excels at making beautiful, real time visualizations of important process metrics and KPIs, such as temperature, flow rates, and overall equipment effectiveness. This way, operators can quickly inspect and diagnose the production process.
The UMH platform acts as an invisible interface between Grafana and the TimescaleDB database, making it easy to retrieve the desired data. The platform exposes a “data model” to Grafana that a user can leverage to make graphs without having to write complex SQL queries. This is important in manufacturing, because operational technology (OT) workers are often not comfortable using SQL — plus, you don’t have time to write a query when a machine malfunctions!

How UMH uses Grafana Cloud to monitor internal systems
In addition to using Grafana OSS as part of our IIoT platform, UMH has also leveraged Grafana Cloud for several years to monitor the internal services that underpin our Management Console. This Management Console enables our users to access their instances from any location, which requires a robust suite of services, including PostgreSQL, Kafka, Redis, and our front end and back end APIs. As long-time users of Grafana Cloud, we channel the logs and metrics from these services into it, setting up alerts and employing Grafana OnCall to address any issues that might affect our service availability.
How to learn more
If you want to learn more about UMH’s open source IT/OT Integration Platform, and the role of Grafana, you can explore the UMH Learning Center. And if you’re interested in checking out a real industrial use case with Grafana, you can watch this YouTube video from UMH, which demonstrates how to build a Grafana dashboard to visualize PackML data in under 20 minutes, simply by clicking, dragging, and dropping.
Grafana Cloud is the easiest way to get started with metrics, logs, traces, dashboards, and more. We have a generous forever-free tier and plans for every use case. Sign up for free now!


