Grafana Cloud updates: new visualization options, performance test analysis, Grafana Alerting improvements, and more
We consistently roll out helpful updates and fun features in Grafana Cloud, our fully managed observability platform powered by the open source Grafana LGTM Stack (Loki for logs, Grafana for visualization, Tempo for traces, and Mimir for metrics).
In case you missed it, here’s a roundup of the latest and greatest updates for Grafana Cloud this month. You can also read about all the features we add to Grafana Cloud in our What’s New in Grafana Cloud documentation.
And if you’re not a Grafana Cloud user yet, sign up for an account today! You can try any of these features (and more) for free with our generous Cloud Free plan.
Data visualization enhancements
We’re always exploring new and creative ways to help you visualize and derive meaningful insights from your data. This month, we’re excited to share a few minor (but helpful) updates we’ve made to the data visualization experience in Grafana Cloud.
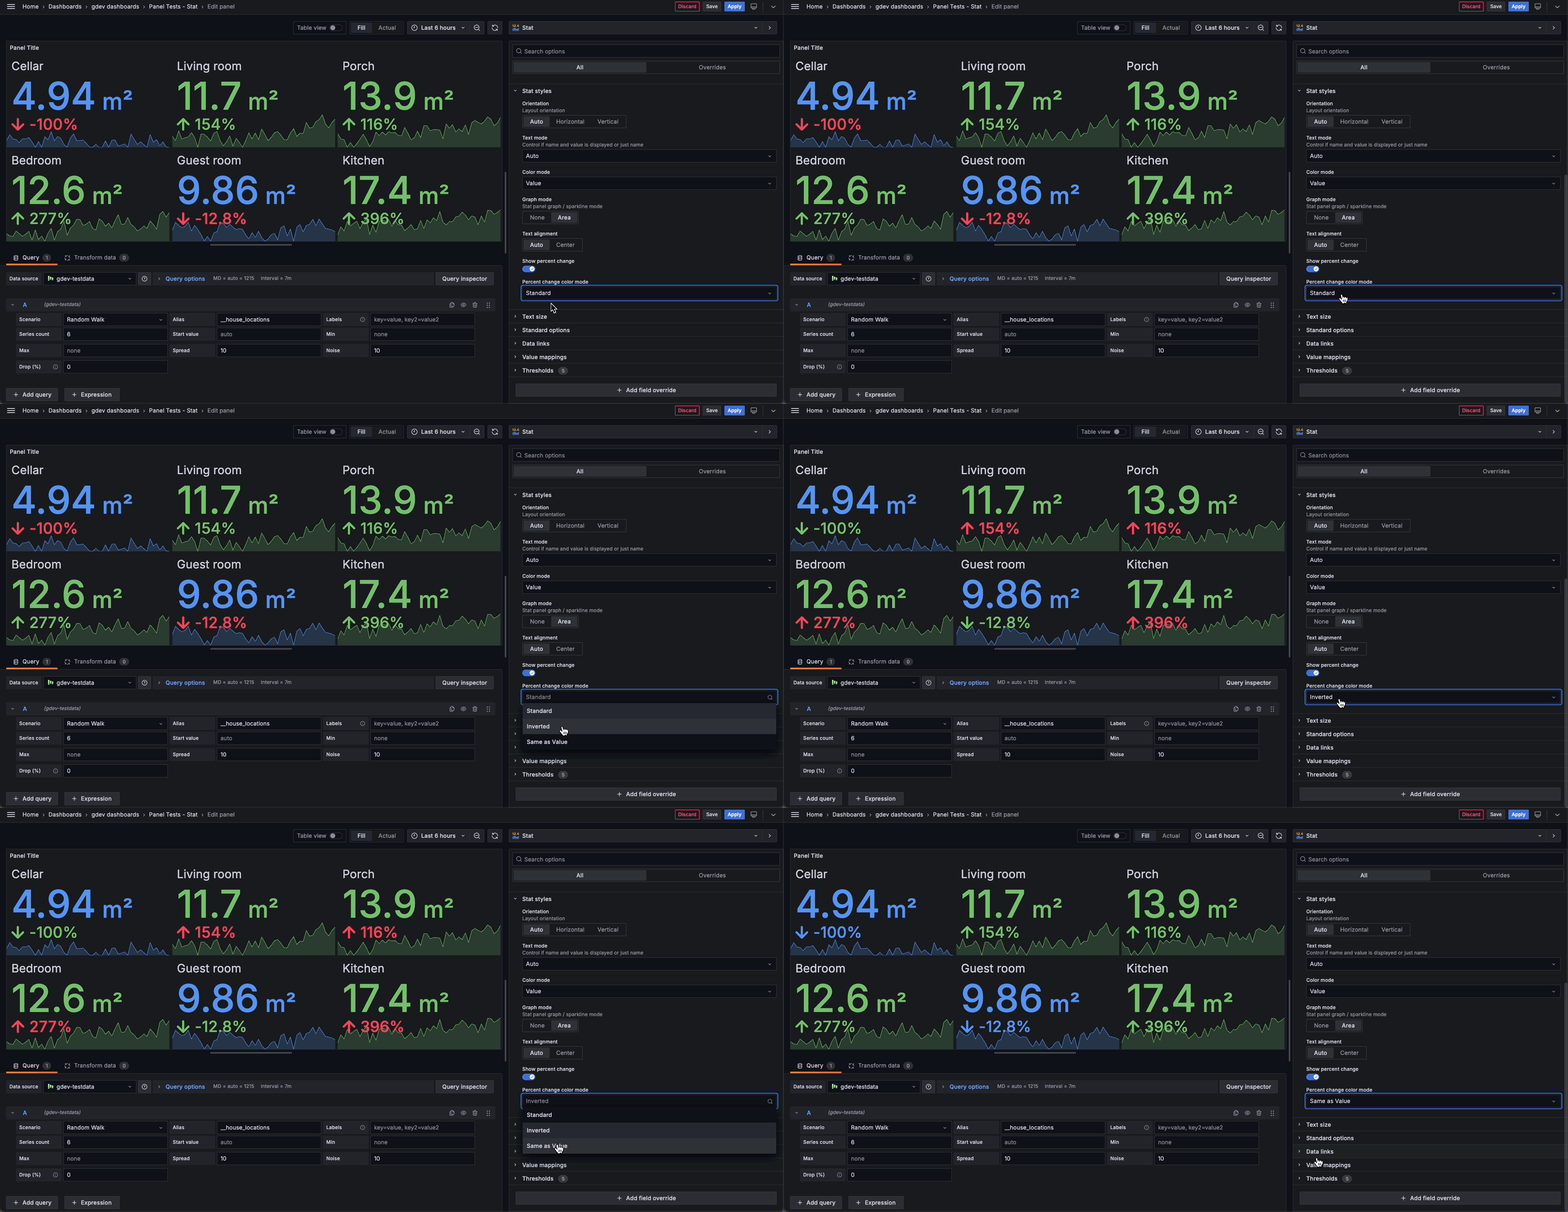
Customize percent change colors
In stat visualizations, the standard behavior for a percent change is to display positive changes in green and negative changes in red. Depending on your use case, however, we realize you might want to customize these percent change colors. Now, you have the option to invert the percent change color, showing positive changes in red and negative changes in green. You can also choose to have the percent change color match the color of its associated value.

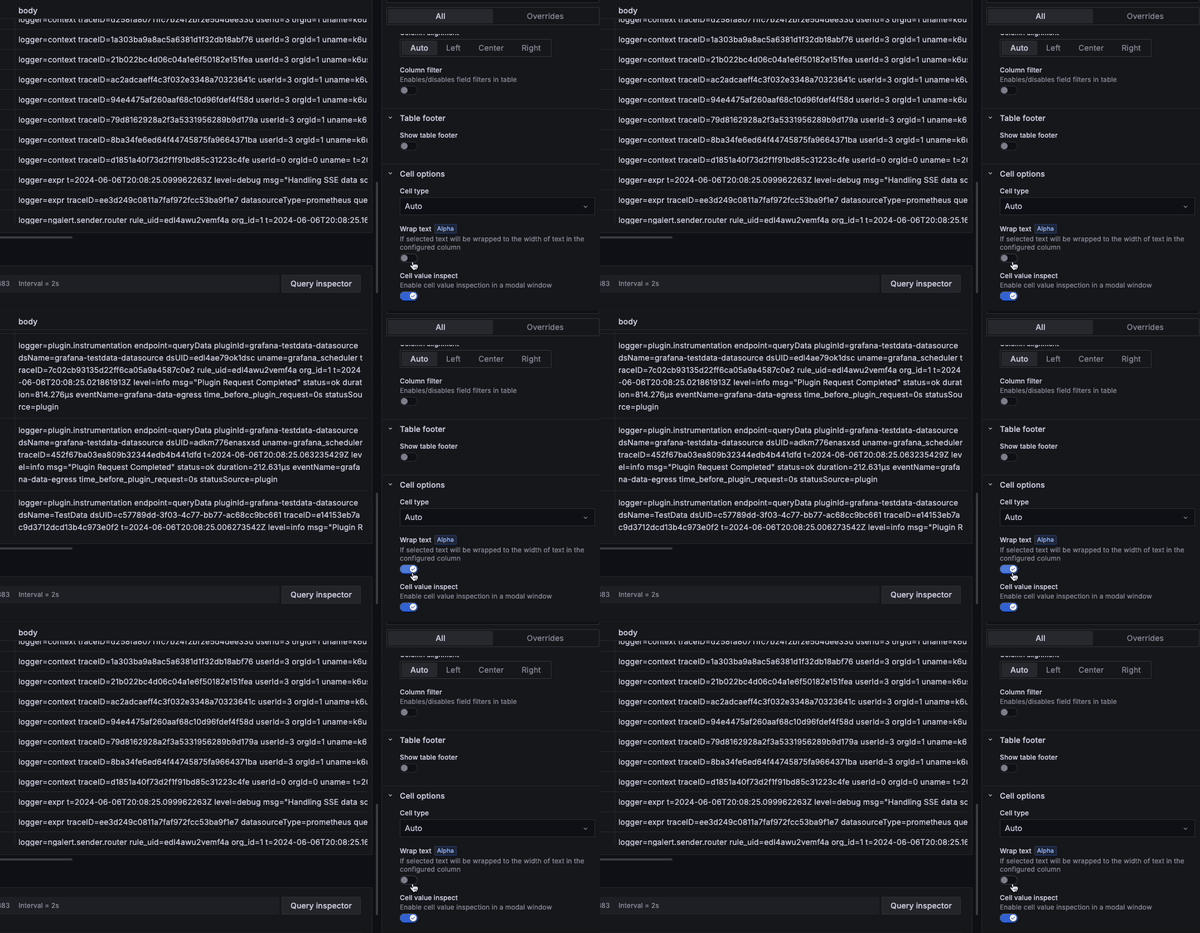
Wrap text within cells
One of the most frequent requests we’ve heard from users is to enable text wrapping within cells for the table panel. With the release of Grafana 11.1, we’re adding this long-requested capability!
By default, the column with the longest text will be selected for wrapping. Alternatively, you can manually configure wrapping using field overrides.

Visualize x and y values in the XY chart
XY charts — which we’re officially promoting out of public preview and into general availability — help you visualize arbitrary x and y values in a graph so you can easily show the relationship between two variables. XY charts are typically used to create scatter plots, but you can also use them to create bubble charts where field values determine the size of each bubble.

Refer to our technical documentation to learn more about Grafana Cloud visualizations.
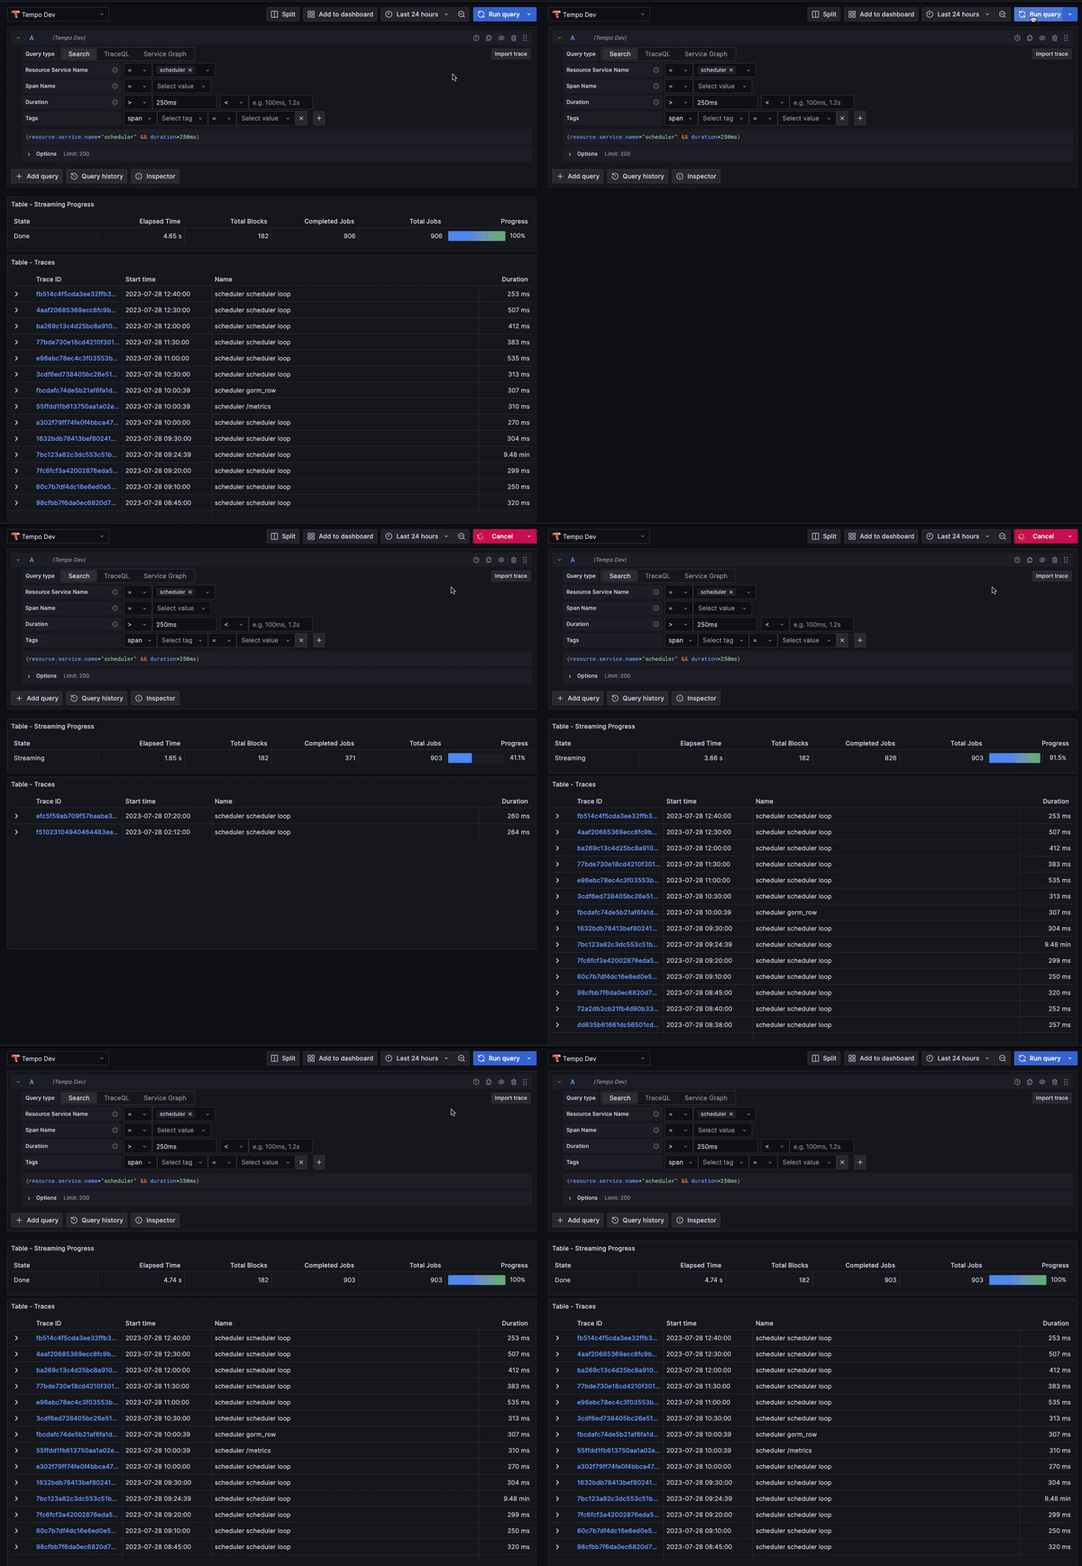
Streaming query results for Grafana Cloud Traces
Grafana Cloud Traces users now get partial results from TraceQL queries as they come in, rather than having to wait for all results to be returned at once. This allows you to start looking at traces matched by your query immediately, speeding up your root cause analysis.

To learn more about Grafana Cloud Traces, check out our technical docs.
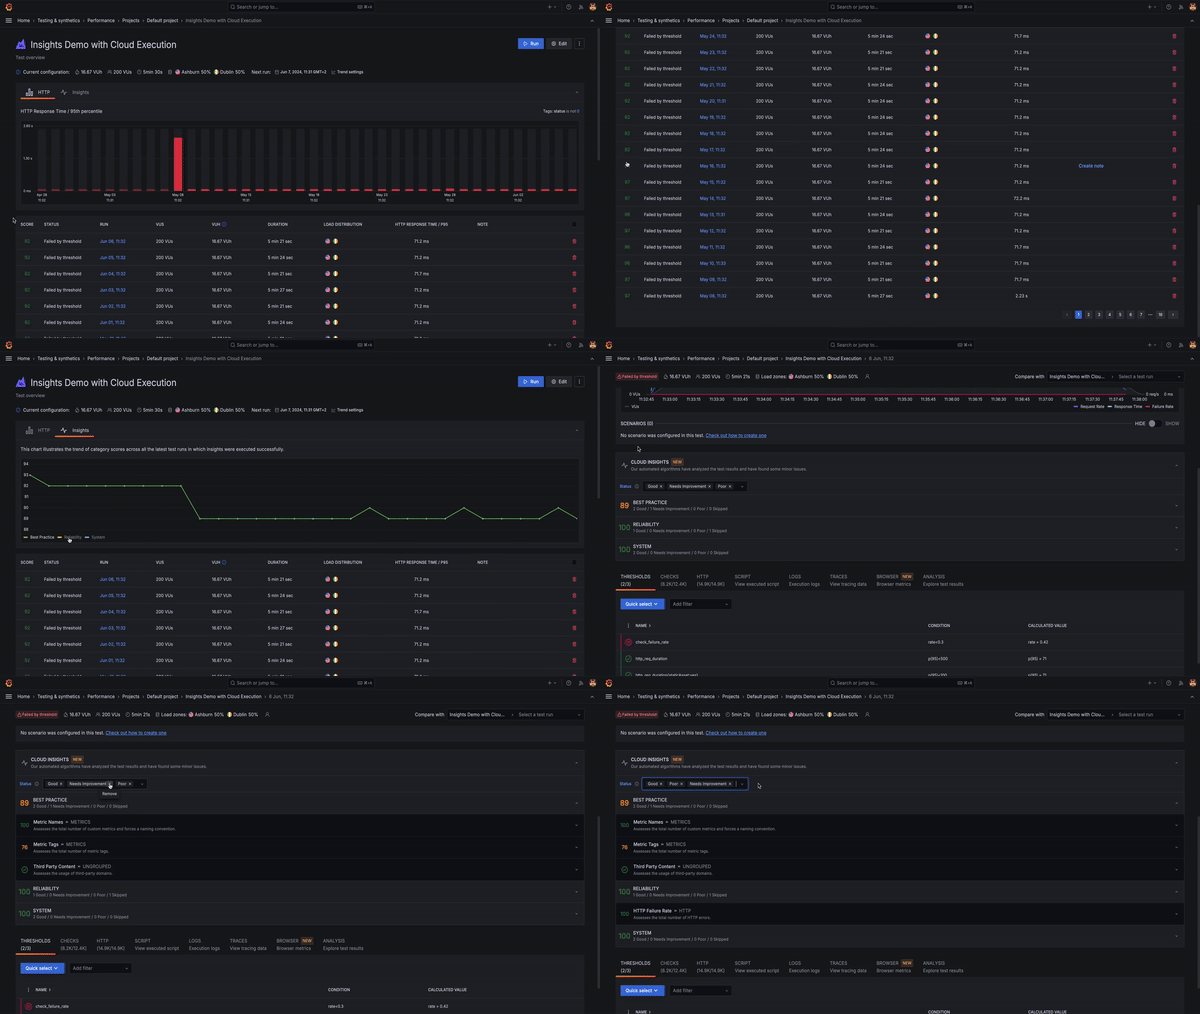
Performance test analysis with Cloud Insights in Grafana Cloud k6
The real value of performance testing is not the test itself, but being able to analyze and draw conclusions from the results. This isn’t always easy, however, given today’s increasingly complex systems. When something goes wrong in a test, finding the root cause can be difficult and time-consuming.
We aim to address these challenges with Cloud Insights in Grafana Cloud k6. Cloud Insights analyzes telemetry data generated during a test run, such as metrics, logs, and traces, to automatically identify issues in the system you’re testing and provide recommendations to fix them. This helps you and your team save time and identify root causes faster.
To use Cloud Insights, enable it in the Beta Features modal window in Testing & synthetics > Performance. For more information, refer to the Cloud Insights documentation.

Logs filtering and pinning in Grafana Explore
Grafana Explore now supports logs filtering and pinning in the content outline, a side navigation bar that keeps track of the queries and visualization panels you create. All log levels are now automatically available in the content outline.
Filtering logs: You can now filter by log level, which is currently supported for Elasticsearch and Loki data sources. To select multiple filters, hold down the command key on Mac or the control key on Windows while clicking.
Pinning logs: You can also pin logs to the content outline, making them easily accessible to reference during investigations. To pin a log, hover over a log in the logs panel and click on the Pin to content outline icon in the log row menu. Clicking on a pinned log will open the log context modal, showing the log highlighted in context with other logs. From here, you can also open the log in split mode to preserve the time range in the left pane, while having the time range specific to that log in the right pane.
You can read more about Grafana Explore in our technical docs.
Private source map uploads in Grafana Cloud Frontend Observability
This month, we introduced private source map uploads in Grafana Cloud Frontend Observability, our hosted service for real user monitoring (RUM) that provides actionable insights into the end user experience. With this new capability, Frontend Observability can now use source maps to convert stack traces from JavaScript browser errors back into their original representation. This way, you can see the exact line of code that caused the issue.
Before rolling out this feature, source maps had to be publicly available on the internet in order for Grafana Cloud to fetch them. For many users, this wasn’t ideal, as it meant they needed to expose some of their IP. Now, Frontend Observability provides an option for users who want de-minified stack traces for errors while keeping their source map private.
Simply include the newly released JavaScript bundler plugins into your build pipeline, input some configuration context provided by the Frontend Observability plugin app, and you will be able to see full error stack traces without needing to host source maps publicly alongside the application bundle.
To learn more, refer to our Frontend Observability documentation.
Grafana Alerting improvements
We have several updates to Grafana Alerting, including new options to manage silences and an easier way to select templates for your alert notification messages.
Rule-specific silences with RBAC
You can now choose who can create, edit, and read silences using the following permissions:
- Users with the
alert.silences:createpermission, scoped within a folder, are able to create silences for rules contained within that folder and its subfolders. - Users with the
alert.silences:readpermission, scoped within a folder, are able to read silences for rules contained within that folder and its subfolders, and general silences. - Users with the
alert.silences:writepermission, scoped within a folder, are able to expire and recreate silences for rules contained within that folder and its subfolders.
Rule-specific silences with permissions
More easily create silences directly from the Alert rule list view or detail page. These rule-specific silences are guaranteed to only apply to a single rule and permissions to read, create, update or delete are tied to a user’s permissions for that rule.
Alerting template selector
You can now easily choose which templates you want to use in your alert notification messages by adding a template selector in the Contact Points form. Select from existing templates or customize one for your specific needs. You can switch between the two tabs to access the list of available templates and copy them across to the customized version.
To learn more about setting up alerts in Grafana Cloud, refer to our technical docs.
New integrations: Catchpoint
You can now easily monitor Catchpoint, a digital experience platform that provides real-time insights into the performance and availability of websites, applications, and infrastructure, within Grafana Cloud. The integration includes five useful alerts and three pre-built dashboards to help monitor and visualize Catchpoint metrics.
In addition, we introduced the Catchpoint Enterprise data source plugin, which allows you to query and visualize Tests, RUM, and SLO data from within Grafana.
Grafana Cloud is the easiest way to get started with metrics, logs, traces, dashboards, and more. We have a generous forever-free tier and plans for every use case. Sign up for free now!


