Mobile app observability with OpenTelemetry, Embrace, and Grafana Cloud
We are excited to announce an expansion of our partnership with Embrace to bring mobile observability to our users using open standards like OpenTelemetry.
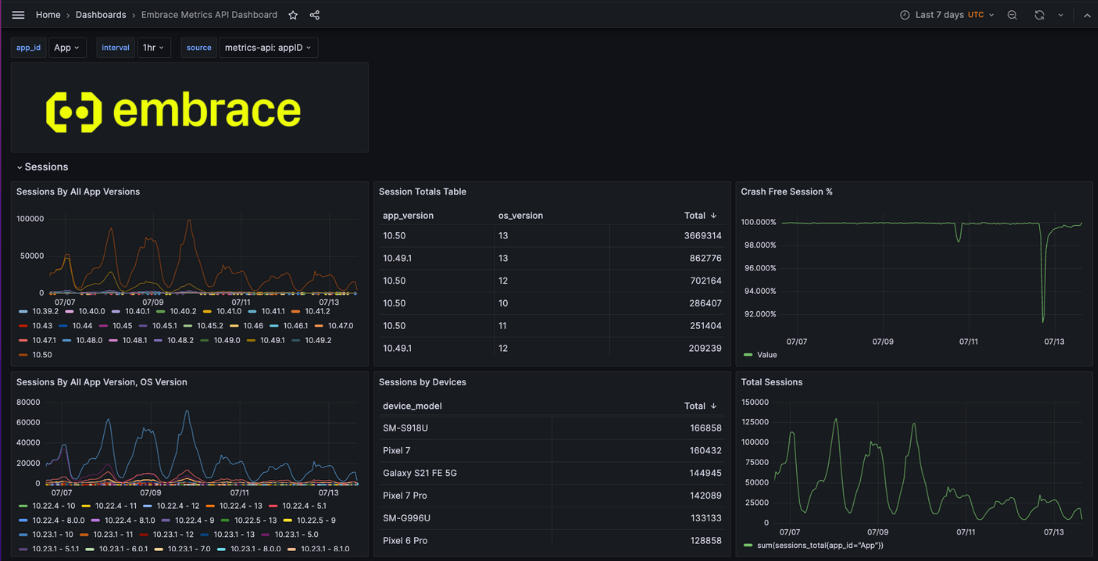
We first worked with Embrace last year when they created a plugin for Grafana that gives mobile teams an easy way to visualize and analyze real-time mobile metrics directly in a Grafana dashboard.

Recently Embrace introduced a new integration for Grafana Cloud that allows Grafana users to connect frontend mobile telemetry data from Embrace to infrastructure and application performance data in Grafana Cloud. The result? End-to-end observability that extends from a user’s device to an organization’s complex cloud infrastructure, giving SREs and DevOps teams a comprehensive look at how technical failures in their mobile apps impact end users, the underlying user experience, business outcomes, and more.
What is Embrace?
Embrace provides a user-focused mobile app observability solution based on OpenTelemetry. By delivering mobile telemetry across DevOps and mobile engineering teams, Embrace illuminates customer impact at the mobile app level.
Embrace’s OpenTelemetry SDKs give teams the transparency, portability, and extensibility they want in modern observability instrumentation, while Embrace’s data backend and analysis platform is enterprise-supported for powerful mobile performance insights. By tying frontend mobile telemetry to backend performance data, Embrace helps companies modernize their observability practice and deliver the best user experiences possible.
Why use Embrace and Grafana Cloud?
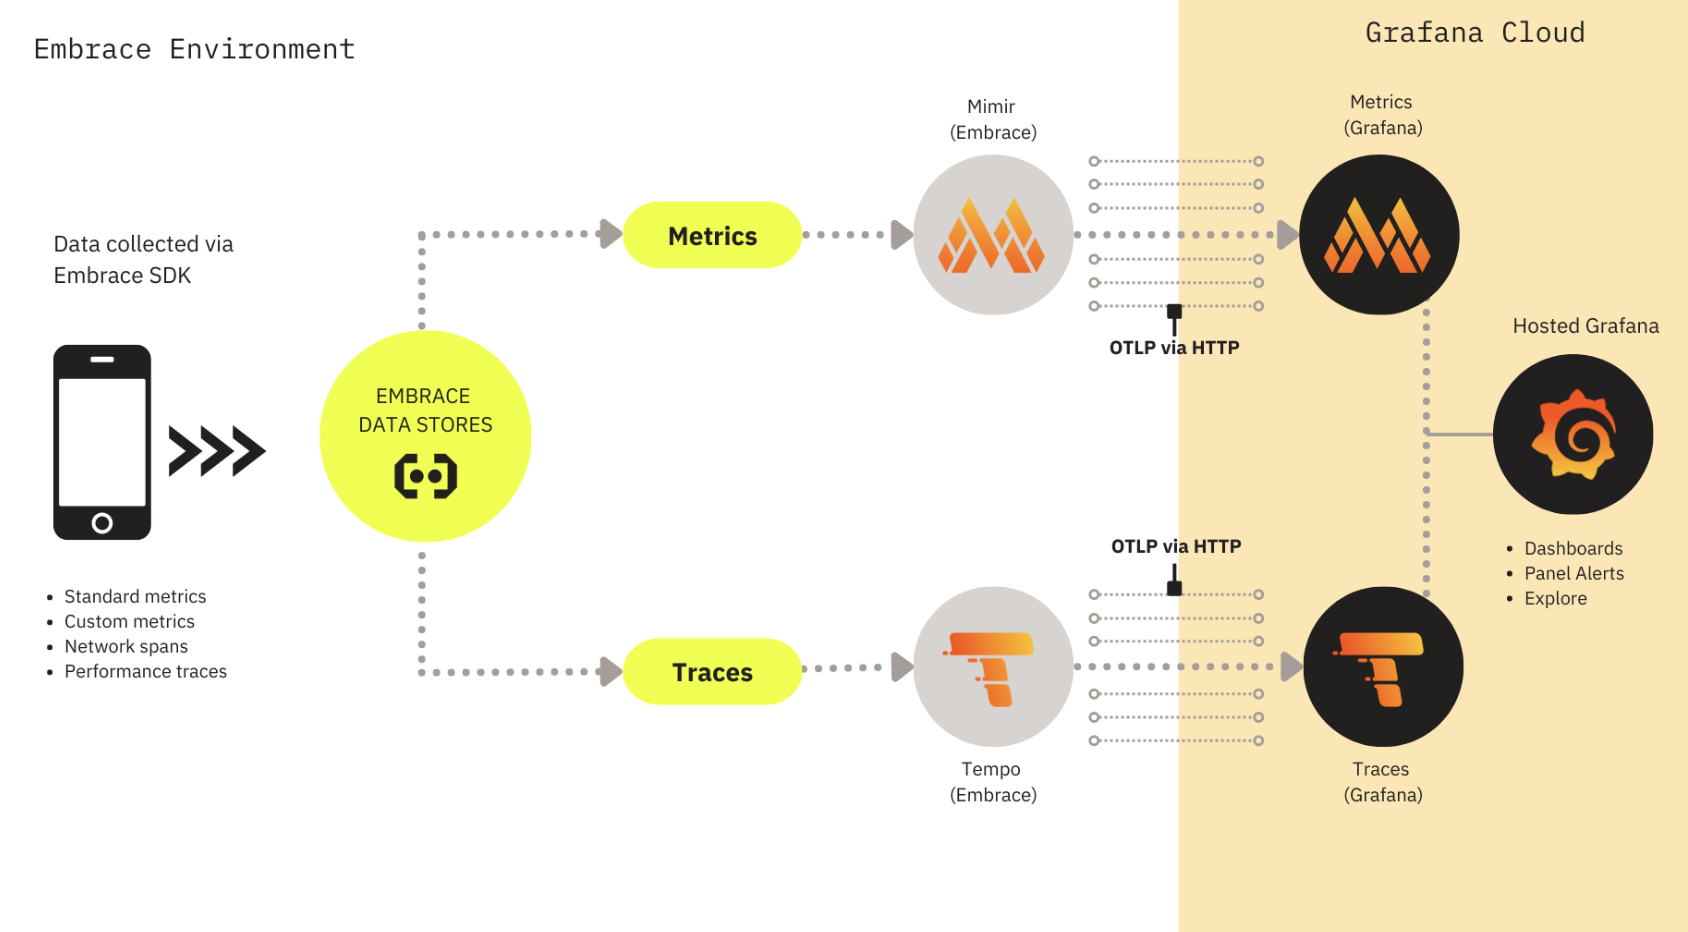
The latest Embrace integration for Grafana Cloud allows you to push your mobile application’s metrics and traces (and soon logs) from Embrace directly to Grafana Cloud using the OpenTelemetry Protocol via HTTP. You will then be able to visualize context-rich mobile data in Grafana Cloud alongside your other observability data, giving you a more complete view of the user experience in one place.

Teams can then correlate mobile observability data with infrastructure and application performance observability as well as telemetry from any of the data sources in our vast Grafana ecosystem (there more than 100 data sources and counting) to gain a better understanding of how performance issues affect SLOs and user experiences. Your team will also be able to shift from a reactive to a more proactive practice in how you identify and resolve mobile app performance issues in real time.
How to connect Embrace to Grafana
There are three ways that SREs and DevOps users can leverage Embrace data in their day-to-day workflows with Grafana Open source and Grafana Cloud:
- Query mobile metrics (default or custom-built) directly in Grafana OSS using PromQL
- Automatically forward mobile metrics (default or custom-built) directly to Grafana Cloud Metrics for analysis and alerting
- Automatically forward mobile network call data (as spans) directly to Grafana Cloud Traces for analysis and alerting
Learn more about Embrace and Grafana Cloud
We are always looking for ways to partner with organizations to help enhance the Grafana experience and support our growing community. We are excited to see how our shared users take advantage of the deep integration between Embrace and Grafana Cloud to improve their mobile observability.
To learn more about the Embrace integration for Grafana Cloud, check out the Embrace documentation.
Have questions or feedback? We would love to hear from you at integrations@grafana.com.
Grafana Cloud is the easiest way to get started with metrics, logs, traces, dashboards, and more. We have a generous forever-free tier and plans for every use case. Sign up for free now!


