How we use Grafana Alloy clustering to scrape nearly 20M Prometheus metrics
If you are interested in running your own Grafana Alloy cluster for high availability or horizontal scalability, then you’re in the right place. That’s because we’ve already done it with our own agentless exporters system, which allows you to scrape data from providers such as Amazon CloudWatch, without running any applications on your own infrastructure. This system is built using Alloy clusters, and as of this writing, it serves a whopping 19.5 million active series (metrics) across all of the regions we offer in Grafana Cloud.
We are quite happy with how it meets our scaling needs, so we’d like to share a little bit about our experience. In this blog post, we’ll take a closer look at how Alloy clustering works, how it can be used alongside our agentless exporters (in this case, to query Amazon CloudWatch), and how it can simplify scrape jobs in Grafana Cloud.
What is Grafana Alloy clustering?
Grafana Alloy is our open source OpenTelemetry Collector distribution with built-in Prometheus pipelines and support for metrics, logs, traces, and profiles. One of its fantastic features is its clustering capability, which you can use to configure and distribute a pool of Prometheus scrape jobs across a cluster of Alloy nodes. This cluster can then coordinate cluster membership and job ownership via a gossip-based protocol, similar to what has been done for other Grafana Cloud products that are implemented as a distributed system.
Grafana Cloud’s agentless exporters are special integrations that are developed for, and operated on Grafana Cloud infrastructure. These integrations are configured directly on Grafana Cloud and run on our own hosted Alloy clusters, so you don’t have to set up Alloy or exporters on your infrastructure to use them. Currently, agentless exporters are offered for AWS Observability CloudWatch metrics, Confluent Cloud, and Metrics Endpoint.
How Alloy clustering works
In this section, we will focus on the Alloy configuration needed to enable clustering and supply the cluster with components to operate on.
Enabling clustering in its most basic form has two parts:
- The Alloy binary needs to be run with its
cluster.enabledflag set to true. This can be done in the CLI arguments, or the Kubernetes Helm chart, depending on what infrastructure you’ll be running Alloy on. The CLI arguments doc also describes a couple of other cluster flags that you may need to use, if you want to customize the cluster’s networking settings. This part sets up the cluster in a base state so that any clustered components are distributed among the Alloy nodes. - Zero or more supported Alloy components are configured to enable clustering on them, described in the links below. This part actually gets work distributed among the Alloy nodes.
- loki.source.kubernetes
- loki.source.podlogs
- prometheus.operator.podmonitors
- prometheus.operator.servicemonitors
- prometheus.scrape
- pyroscope.scrape
Here’s a small example of what our base Alloy configurations roughly look like, in the UTF-8 textual file format:
import.http "pipelines" {
  url = "https://api/pipelines"
  // Generally want this to be set higher
  // than poll_timeout
  poll_frequency = "120s"
  // Set to the write timeout of the HTTP
  // server which serves the configs
  poll_timeout = "90s"
  arguments {
    api_url_base = "https://api"
  }
}
This block in the base config tells Alloy to retrieve and execute dynamically generated config blocks from an HTTP server. An example of the API’s plaintext response body looks roughly like this:
argument "api_url_base" {}

discovery.http "cloudwatch" {
  url = format("%s/targets/cloudwatch", argument.api_url_base.value)
}

prometheus.scrape "cloudwatch" {
  clustering {
    enabled = true
  }
  targets = discovery.http.cloudwatch.targets
  forward_to = [prometheus.remote_write.cloudwatch.receiver]
  // We use the timestamps at which the metric is scraped,
  // rather than the timestamps reported by the metrics themselves.
  // This helps with alert queries.
  honor_timestamps = false
}

prometheus.remote_write "cloudwatch" {
  endpoint {
    url = "https://grafana-cloud-metrics/api/prom/push"
  }
}

// This hash is generated by the API and can help with
// debugging, e.g. getting a sense of whether each
// Alloy instance is using the same version of configuration.
output "pipelines_hash" {
  value = "c06d59a8dc5629d7457a9aa7cff36f46"
}
Each Alloy cluster node must converge on exactly the same config in order for the cluster to distribute prometheus.scrape components among each other. The scrape component will be assigned to a particular cluster node, and it will periodically gather metrics from the agentless exporter via a JSON array of exporter configurations retrieved by the discovery.http block. We have our API compute a hash of the rest of the preceding blocks so we can compare what’s being served by the API to what’s configured in each Alloy instance via its debug UI, to see if a propagation issue arises.
A closer look at Grafana Cloud agentless exporters
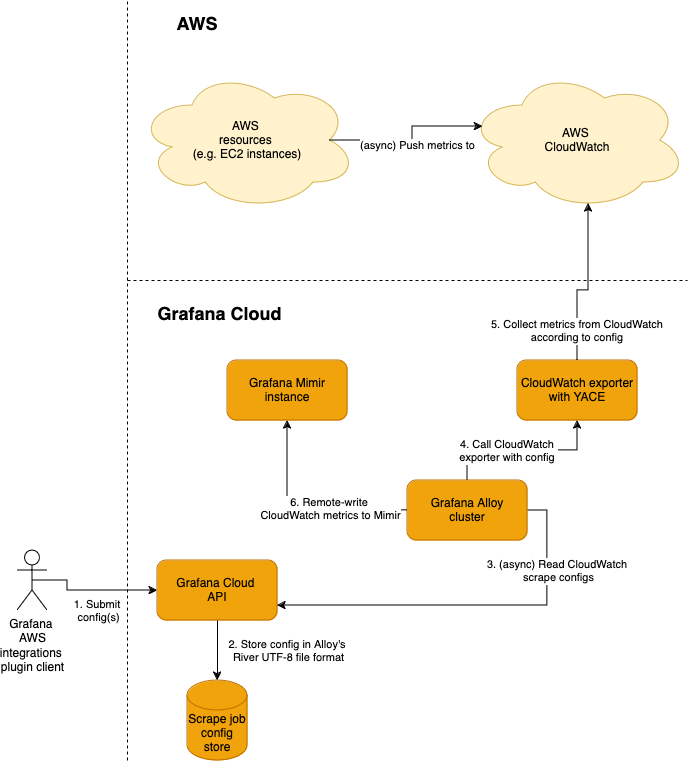
Next, let’s take an in-depth look at what an agentless exporter is, using our AWS Observability app as an example. There are several options for getting metrics data from AWS into Grafana Cloud, and AWS Observibility runs on Alloy clusters operated by Grafana Labs. If we look at the high-level flow for creating a CloudWatch metrics scrape job using our current system with Alloy clusters, it looks roughly like this:

It all starts with the Grafana Cloud API, which helps you manage and persist your hosted scrape job configurations. It serves your scrape job configurations over HTTP in Alloy’s config format. Then, there’s a Grafana Alloy cluster, where each cluster node periodically pulls the set of scrape jobs from the API and communicates and/or uses the result of communication with other cluster nodes to determine which scrape jobs it should run. Each scrape job is run on a regular time interval, where the exporter is called with the specific query time range, metrics to pull, and the aggregation function to perform on those metrics.
The exporter may be responsible for performing complex metadata operations like figuring out which metrics actually exist with recent data, or associating particular time series with vendor-specific resource identifiers. Read the section about CloudWatch data fidelity in our recent blog for more information about metadata association.
How Alloy clustering improves on Grafana Agent’s scraping service
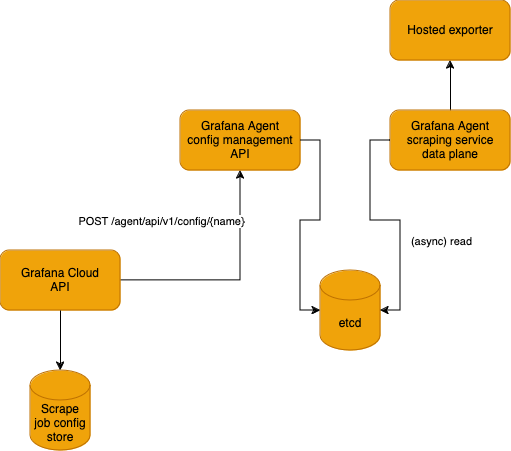
What is now a Grafana Alloy cluster pulling scrape job configs asynchronously from the Grafana Cloud API used to be a much more stateful push from the Grafana Cloud API to something called the Grafana Agent scraping service, using an etcd cluster.

Grafana Agent scraping service requires cluster membership state as well as the scrape configs themselves to be stored in a distributed KV store like etcd or Consul. As a result, the Grafana Cloud API has to persist every config via the Grafana Agent’s Config Management API in the Agent’s YAML config format, in addition to its own distinct persistence layer.
This approach has two major drawbacks:
- An extra persistence layer opens the system to complex failure modes regarding data consistency, known as the dual write problem.
- Operating that extra persistence layer, etcd, is no small feat, and any software system with complex configurations and interactions will hold its share of misconfigurations and misinteractions that lead to outages.
Alloy’s clustering feature eliminates both of these problems completely through its import configuration components, which enable dynamic Alloy configuration to be retrieved from remote sources. Specifically, we make primary use of the import.http component, with which we configure Alloy nodes to call our Grafana Cloud API to generate the latest set of scrape job configs.
Migrating to Alloy clustering
In order to use Alloy Clustering as the sole system scraping metrics for our customers, we had to migrate off Grafana Agent and its scraping service feature. Now, the scraping service feature is in beta in Grafana Agent, which has been deprecated, so we don’t expect many of you will need to go through this exact exercise. Still, we wanted to provide a broad overview so you could get a sense for what it’s like migrating from Grafana Agent to Alloy.
At a high level, we had to work our Grafana Cloud API to remove the scrape job configs from the Agent scraping service etcd store, and instead serve those configs for Alloy to pull.
The preparation of the migration was roughly as follows:
Our Grafana Cloud API was instrumented with new paths to be able to serve prometheus.scrape and prometheus.remote_write components as an Alloy module, which allows Alloy to retrieve and run them.
The API and persisted scrape job data was instrumented with a flag that determined whether or not a particular job should be served over the new paths.
Migration tooling was implemented that enabled sets of jobs to be served over the new paths to Alloy, which was followed by deleting the copies of those jobs running on Grafana Agent scraping service.
New Alloy nodes were deployed to match our target capacity.
- These Alloy nodes were configured with import.http blocks pointing to the relevant Grafana Cloud API paths, and the
cluster.enabledrun flag was set. - Through some preliminary testing, we found that Alloy clustering nodes had roughly the same resource demands for our setup as the Agent scraping service nodes, given the same scrape job load.
- These Alloy nodes were configured with import.http blocks pointing to the relevant Grafana Cloud API paths, and the
The actual migration was roughly as follows:
- We ensured that before migrating, the API would be configured to serve all newly created jobs to the deployed Alloy nodes
- Then, we ran our migration tooling, first on small batches of small jobs (determined by their total active series), followed by larger and larger batches of the remaining small jobs. Finally, we carefully chipped away at the largest jobs, until it was all done.
- We saw success immediately upon migration, though we still gave each set of migrations at least a couple days of bake time to be on the safe side. We tore down the old infrastructure by removing the now-defunct Agent nodes, and that was that.
Start using Alloy today
It was easy to get on board with Alloy’s clustering feature, and even to migrate all of our production scrape jobs. Using the gossip protocol, Alloy allowed us to choose our own store layer components that make sense for our service’s needs, without having to worry about any additional persistence requirements. We just needed to output configs in Alloy’s textual file format, which was straightforward to implement using Go’s templates package.
We hope that you enjoy using Alloy as much as we have! Be sure to check out these blogs and docs to help you get started:
- Read this recent blog for more information about all the options to visualize Amazon CloudWatch metrics in Grafana.
- For all the latest information about getting started with, and using Alloy in general, refer to our docs.
- And if you’re interested in Alloy clustering specifically, you’ll find all the latest on this docs page.
Grafana Cloud is the easiest way to get started with metrics, logs, traces, dashboards, and more. We have a generous forever-free tier and plans for every use case. Sign up for free now!


