How to explore metrics without PromQL queries in Grafana
At GrafanaCON 2024, Grafana founder Torkel Ödegaard introduced Grafana 11, which has a feature set that aligns with the same goals we’ve had since the OSS project launched in 2013.
“The core mission of Grafana that we’ve had from the start is to make observability easy and powerful through good UX design, a focus on ease of use, and user flexibility and freedom,” Torkel said.
Throughout the years we’ve approached this in various ways over the years — by creating powerful query editors that are easier to use; improving ways to build panels and dashboards; updating how you navigate data; or making it easier to explore or connect dashboards together by data links.
But we always ask how can Grafana do better? It can take some time to learn how to build dashboards, and even the most advanced dashboards can sometimes be a little too static. So what if Grafana could do it all for you dynamically and on the fly?
In Grafana 11, the latest major release which is now generally available, we’re excited to introduce Explore Metrics, a queryless experience that allows you to effortlessly browse Prometheus-compatible metrics, identify anomalies, and uncover insights with just a few clicks — and no PromQL.
How Explore Metrics works
At Grafana Labs, we love metrics, and spend a lot of time carefully crafting PromQL queries to answer questions and build beautiful Grafana dashboards. However, not everyone is a PromQL wizard, and in the heat of an incident, the last thing you want to do is search for the right query to visualize a heatmap … again.
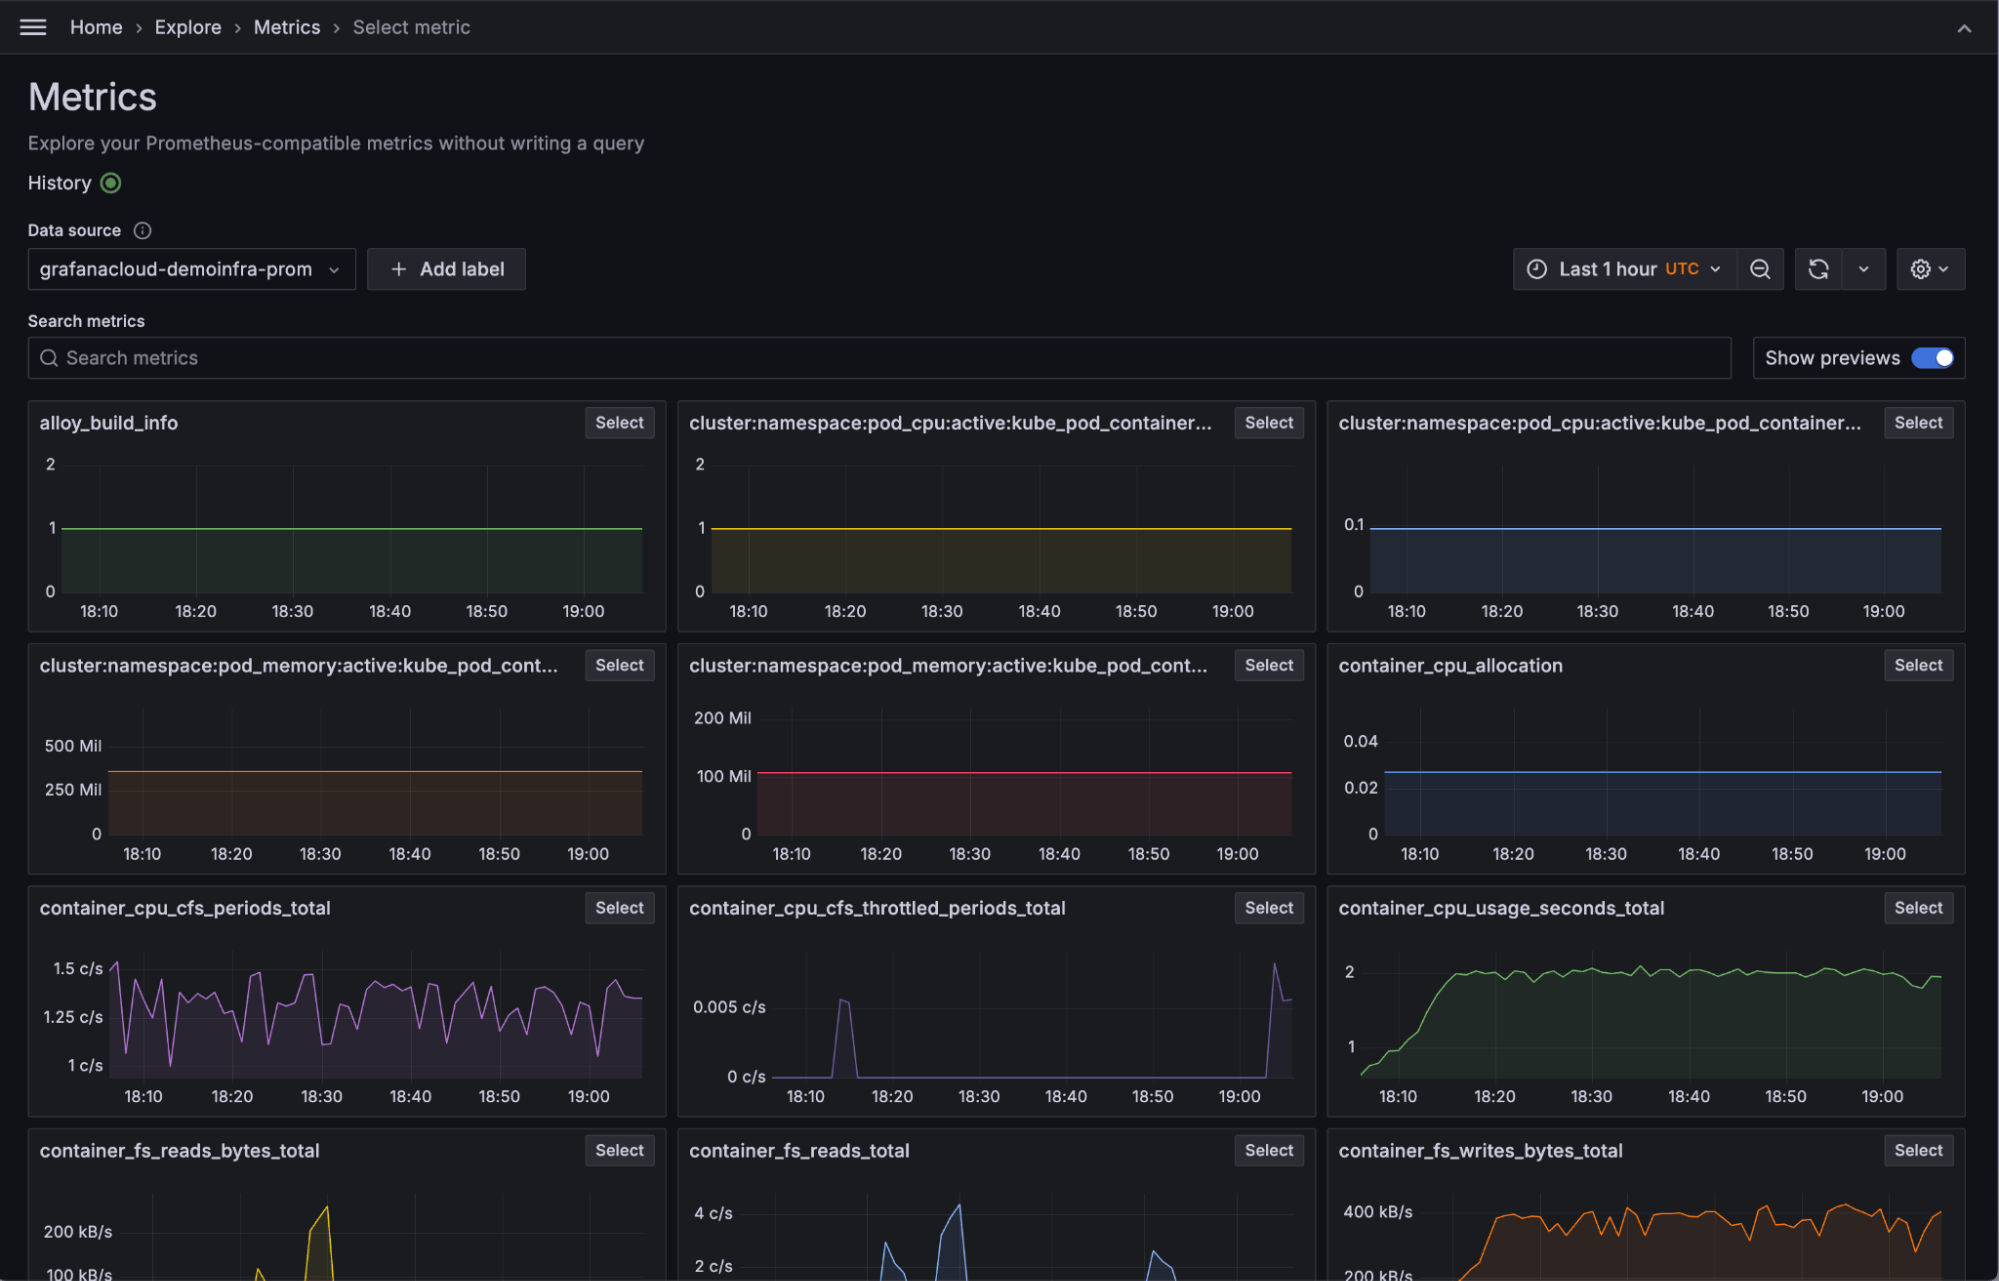
Explore Metrics, which is in public preview in Grafana 11, eliminates this barrier, enabling users to navigate metrics effortlessly, without the need to write queries in PromQL. So instead of managing labels, Explore Metrics allows you to immediately dive into your data with functions that show you:
- Metrics breakdown: Easily segment metrics based on their labels to identify anomalies and troubleshoot issues quickly.
- Intelligent visualization: The right visualization for your metric type is automatically selected, saving you time, effort, and guesswork.
- Related metrics: Surface other relevant metrics related to your current selection for a broader context for your analysis.
- Additional data in a drawer: The Explore in a drawer functionality allows you to see metrics in a drawer overlaid on a dashboard, providing additional content without losing your place.
- User step history: View the history of your navigation through metrics and their filters, making it easy to revisit and reference parts of your process and analysis.
Below is a demo of how to get started with Explore Metrics and how to drill into your metrics to see breakdowns and other related metrics.
Get started with Explore Metrics in Grafana 11
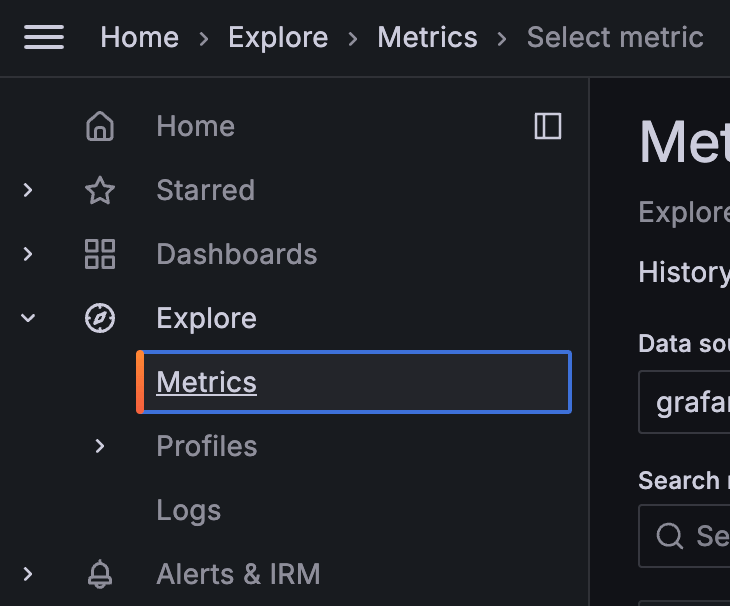
Explore Metrics is available in public preview in Grafana 11. You can access Explore Metrics from the Grafana menu under Explore > Metrics. To learn more, you can check out our Explore Metrics documentation.

Or you can also take Explore Metrics for a spin in the Grafana Play environment.

Learn more about Grafana 11
Grafana 11 is generally available and includes a host of new features that makes Grafana easier to use, operate, and extend. Learn more about what’s new, including
- 10 ways to get more out of your data with transformations
- The latest tools in Grafana Alerting for faster incident response
- How to build custom visualizations with new features in Canvas panel
To see all the latest features in action, watch our “Grafana 11 Deep Dive” session from GrafanaCON 2024, available on demand now.
For an in-depth list of all the new features in Grafana 11, check out our Grafana documentation, the Grafana changelog, or our What’s New documentation.
Upgrade to Grafana 11
Download Grafana 11 today or experience all the new features by signing up for Grafana Cloud, which offers an actually useful Cloud Free tier and plans for every use case. Sign up for a free Grafana Cloud account today.
Our Grafana upgrade guide also provides step-by-step instructions for those looking to upgrade from an earlier version to ensure a smooth transition.
Join the Grafana Labs community
As always we love hearing from the Grafana community. We’d love to hear how you use Explore Metrics and if you have any feedback. You can find the team in the #grafana channel on the Grafana Labs Community Slack.
We also invite you to engage with the Grafana Labs community forums. Share your experiences with the new features, discuss best practices, and explore creative ways to integrate these updates into your workflows.
A special thanks to our community
We extend our heartfelt gratitude to the Grafana community!
Your contributions, ranging from pull requests to valuable feedback, are crucial in continually enhancing Grafana. And your enthusiasm and dedication inspire us at Grafana Labs to persistently innovate and elevate the Grafana platform.
The easiest way to get started with Grafana 11 is with Grafana Cloud. We have a generous Cloud Free tier and plans for every use case. Sign up for free now!


