Grafana transformations: 10 new ways to get more out of your data
One of the superpowers of Grafana is the ability to bring all of your data into a single platform thanks to our rich catalog of data sources.
Oftentimes you will want to visualize information from disparate data sources together in a single dashboard or panel. Or you might want to refine data returned from queries without altering the original data source. Or you may need to modify data due to limitations of a query language that stops you from getting the required formatting.
For all of the above, this is when Grafana transformations come into play, helping you to manipulate your data before visualizing it and to get more insights from your dashboards. This capability is especially useful in creating and managing multiple Grafana dashboards from the same data source, enhancing the efficiency and flexibility of data visualization.
Common use cases for transformations include:
- Changing field names for clarity or consistency across visualizations.
- Performing joins to merge data from different sources based on time or other shared fields.
- Mathematical operations enable calculations across queries, such as sums, averages, and counts.
Grafana transformations can do even more:
- Complex workflows. Transformations are applied in sequence, each acting on the result of the previous, which enables complex data manipulation workflows.
- Debugging. Grafana provides tools (view in table) to visualize the intermediate data states through the transformation process, helping to identify and fix issues with transformation logic.
- Enhance performance. Using transformations can lead to performance gains by minimizing the need to fetch or compute data repeatedly for different visualizations.
Grafana transformations: 10 new improvements
On our road to Grafana 11, we made dozens of changes and updates focused not only on adding new transformations, but also on making it easier to browse, filter, and choose the ones that are most helpful for the outcomes you need and the data sources you have.
1. New UI for improved developer experience
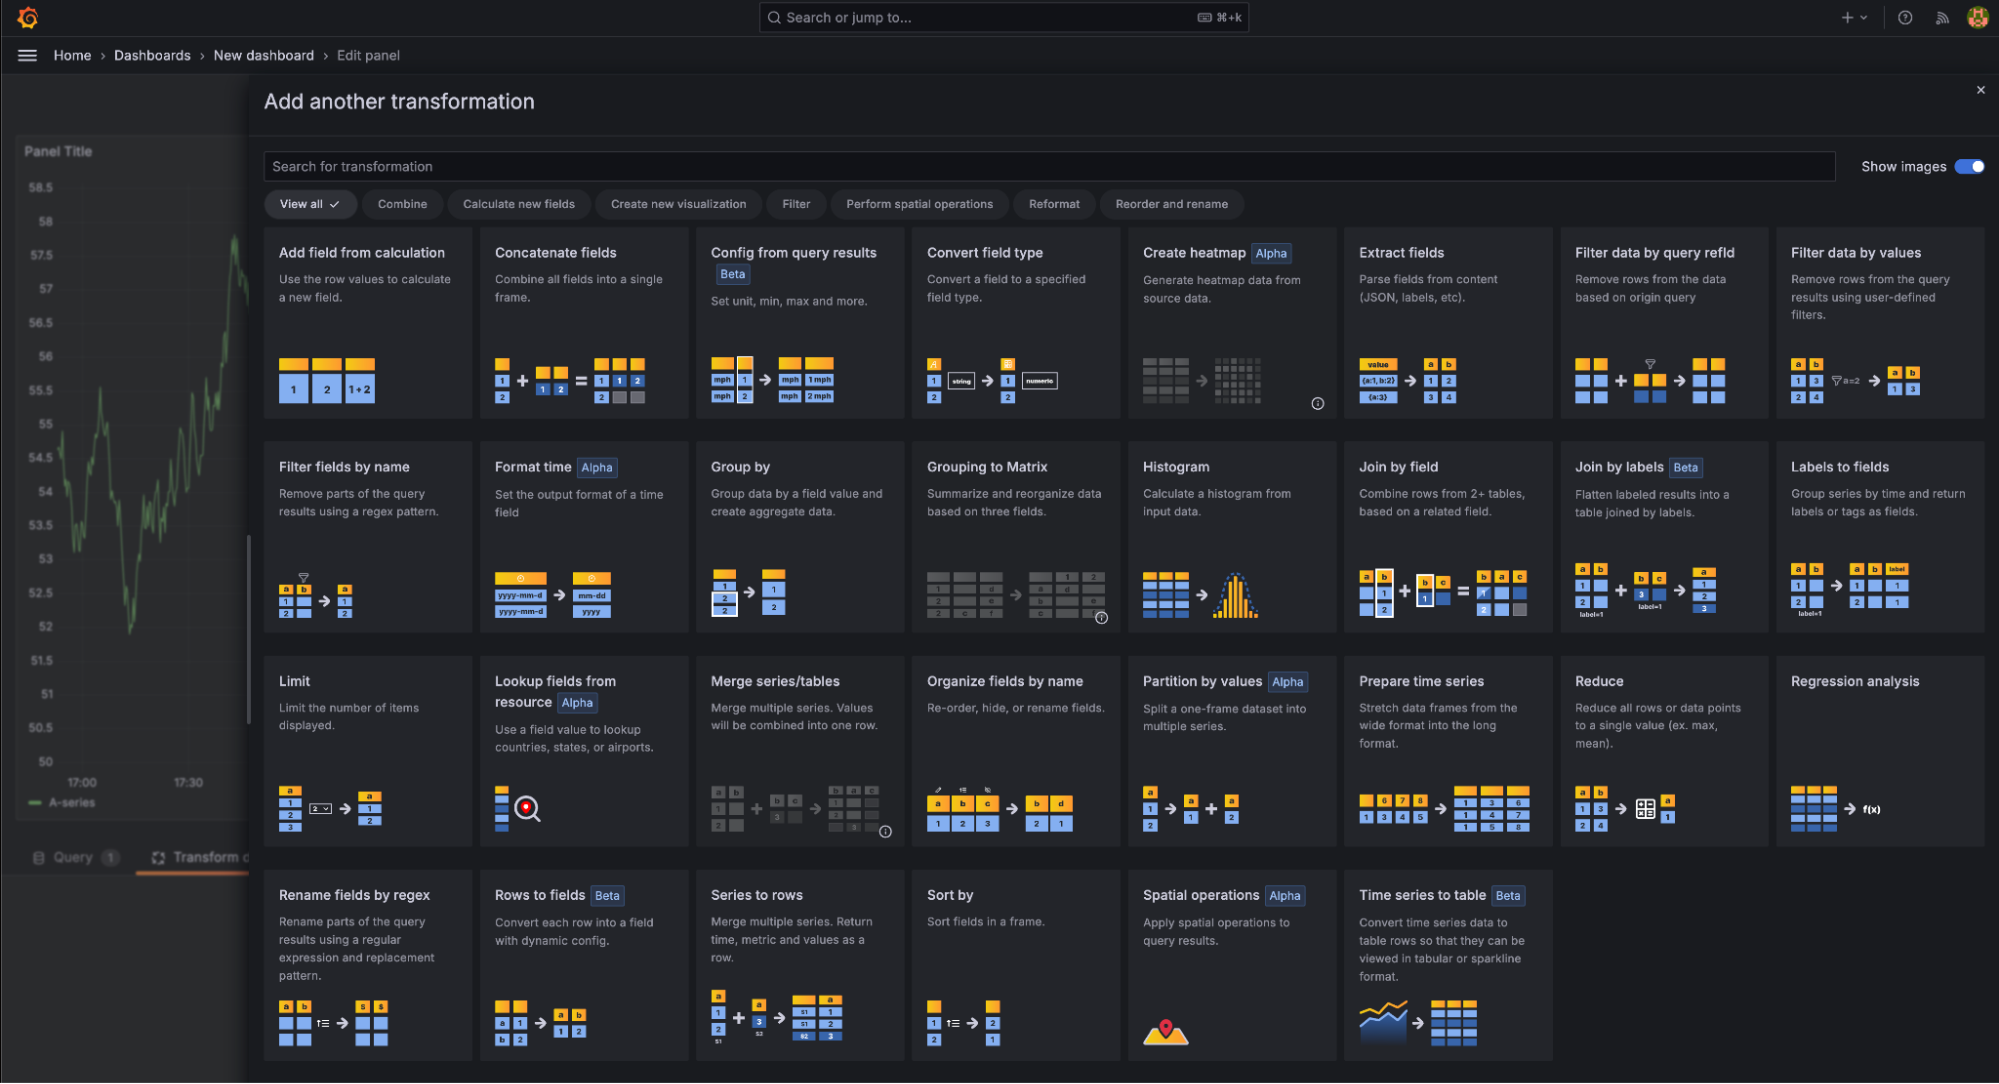
Grafana supports many types of transformations that enable you to filter, combine, reformat, reorder and rename, calculate new fields, perform spatial operations, and even create new visualizations. All the possibilities can be intimidating to start.

This is when the transformation drawer comes into play. With the new UI you can:
- See more transformations at once, helping you understand the possibilities. You can also change the width of the drawer.
- Search or filter transformations based on actions or outcomes you need.
- Understand what a transformation does thanks to improved descriptions and images visualizing the nature of a transformation.
- Clearly identify transformations that are in the alpha or beta stages of maturity.

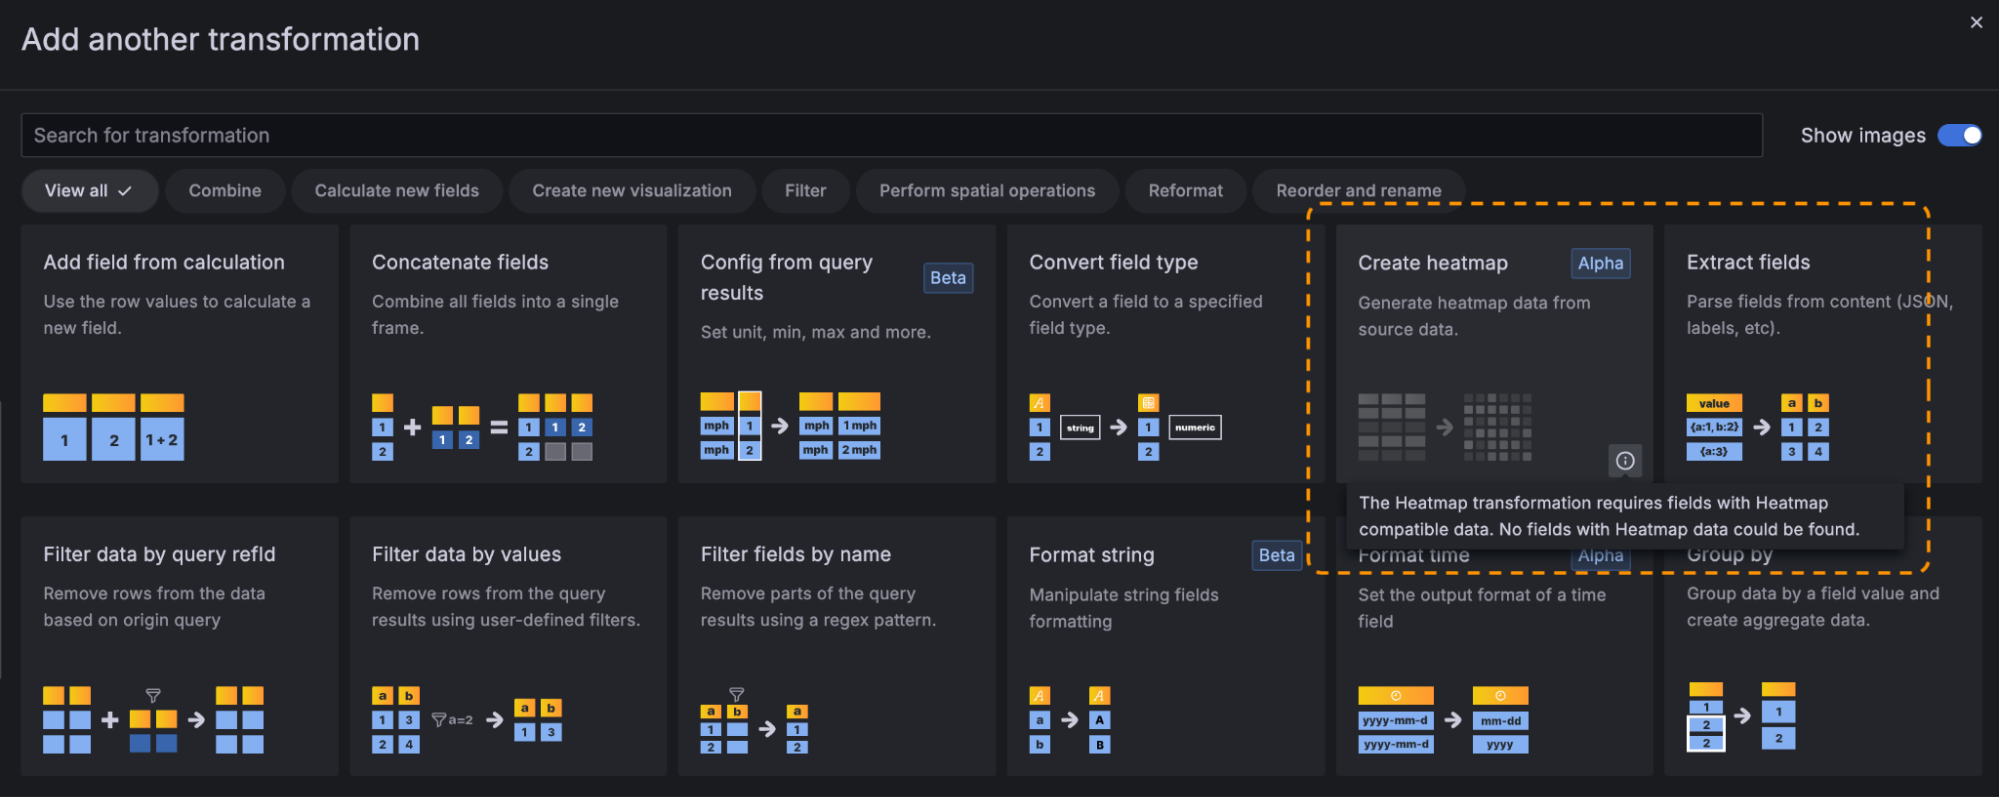
Additionally, Grafana will detect the current data coming from the queries and gray out (or mute) the transformation tiles that might not be appropriate for the particular data returned by the data source.

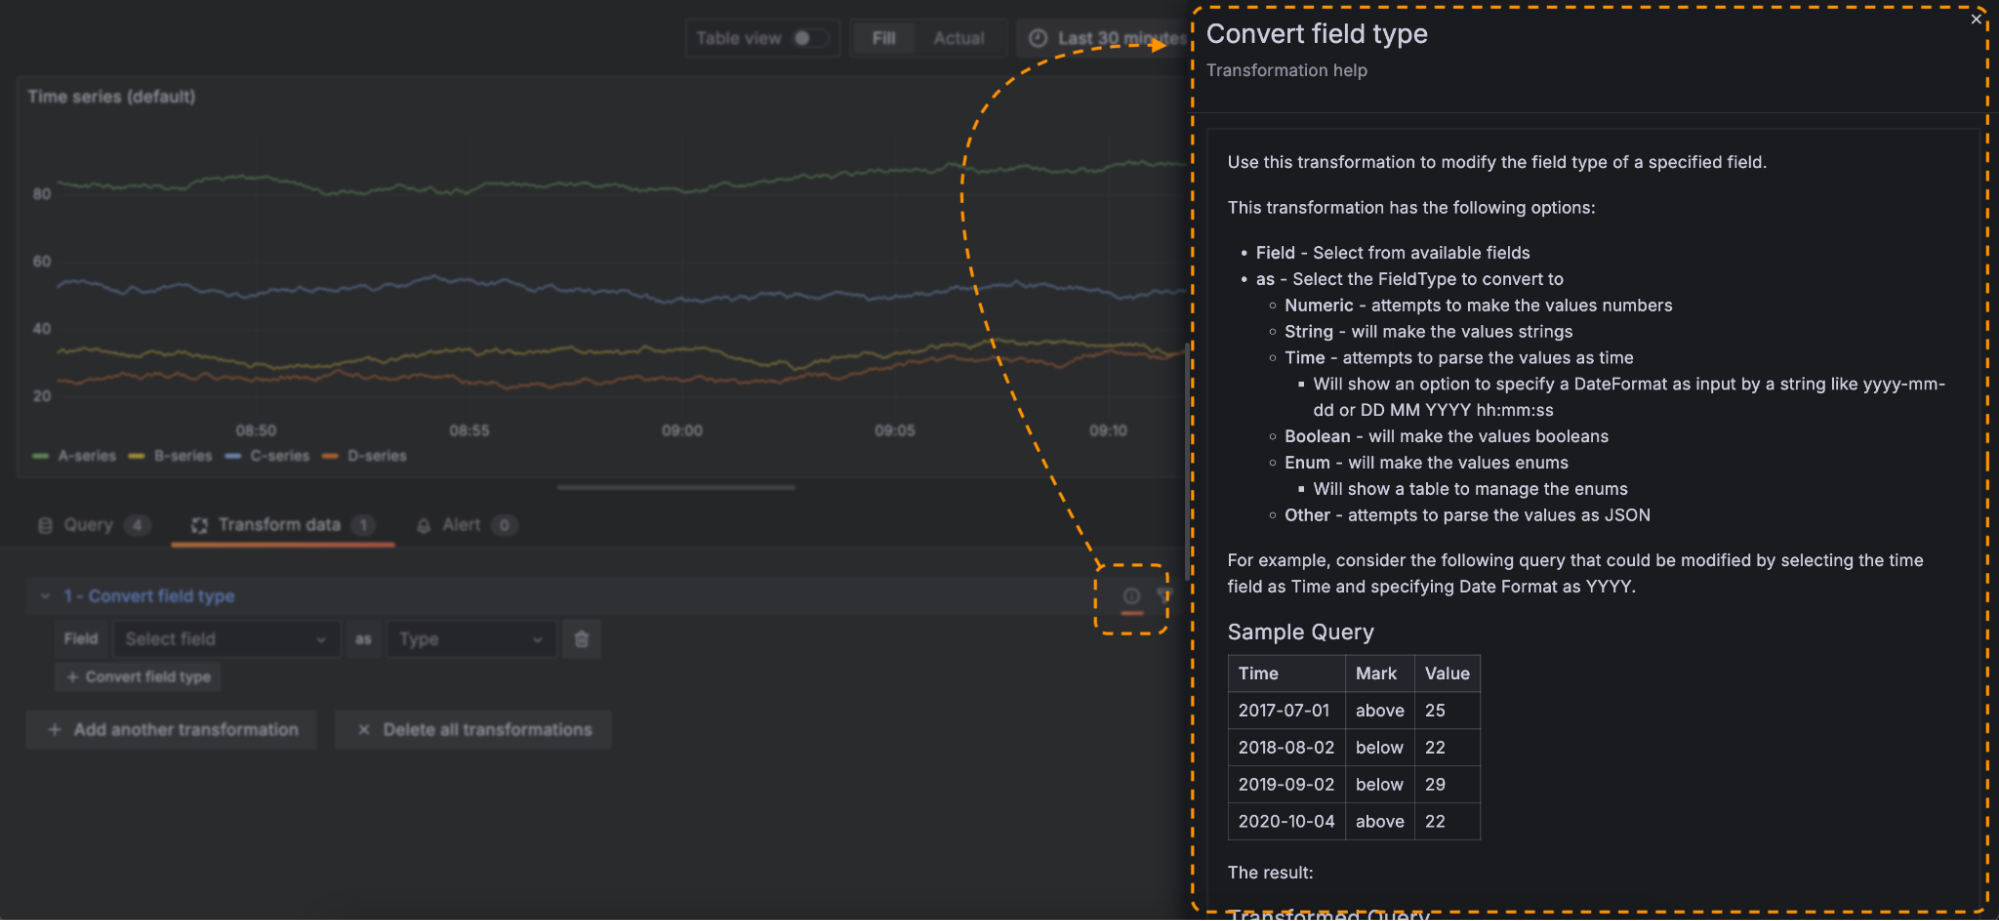
We also brought transformation documentation into the Grafana UI, making it easy to reference everything you need to make the most out of a transformation and troubleshoot as you go.
2. Date and time formatting
When working with date and time data, different time formats can be useful. With the new Format time transformation, you can convert any time format to any other one supported by Moment.js. When used with the Group by transformation, this can also be used to bucket days, weeks, and other time windows together.
We’ve also added support for setting time zones manually when formatting times as strings using the Format time and Convert field type transformations. This allows times to be formatted relative to any time zone across the globe.
Learn more in our Format time documentation.
3. Additional data hierarchy for table visualizations
The Nested table transformation is particularly useful when dealing with hierarchical or grouped data. It allows users to visualize relationships and hierarchies within the data. It also helps organize complex data into a more digestible and hierarchical format, making it easier to analyze and interpret.
Imagine you have data from a monitoring system with fields for region, server_type, and error_count. Using groupToNestedTable, you can group by region and server_type to quickly see how error counts are distributed across different servers in various regions.
The new groupToNestedTable functionality is available behind a feature flag.
4. Set threshold colors
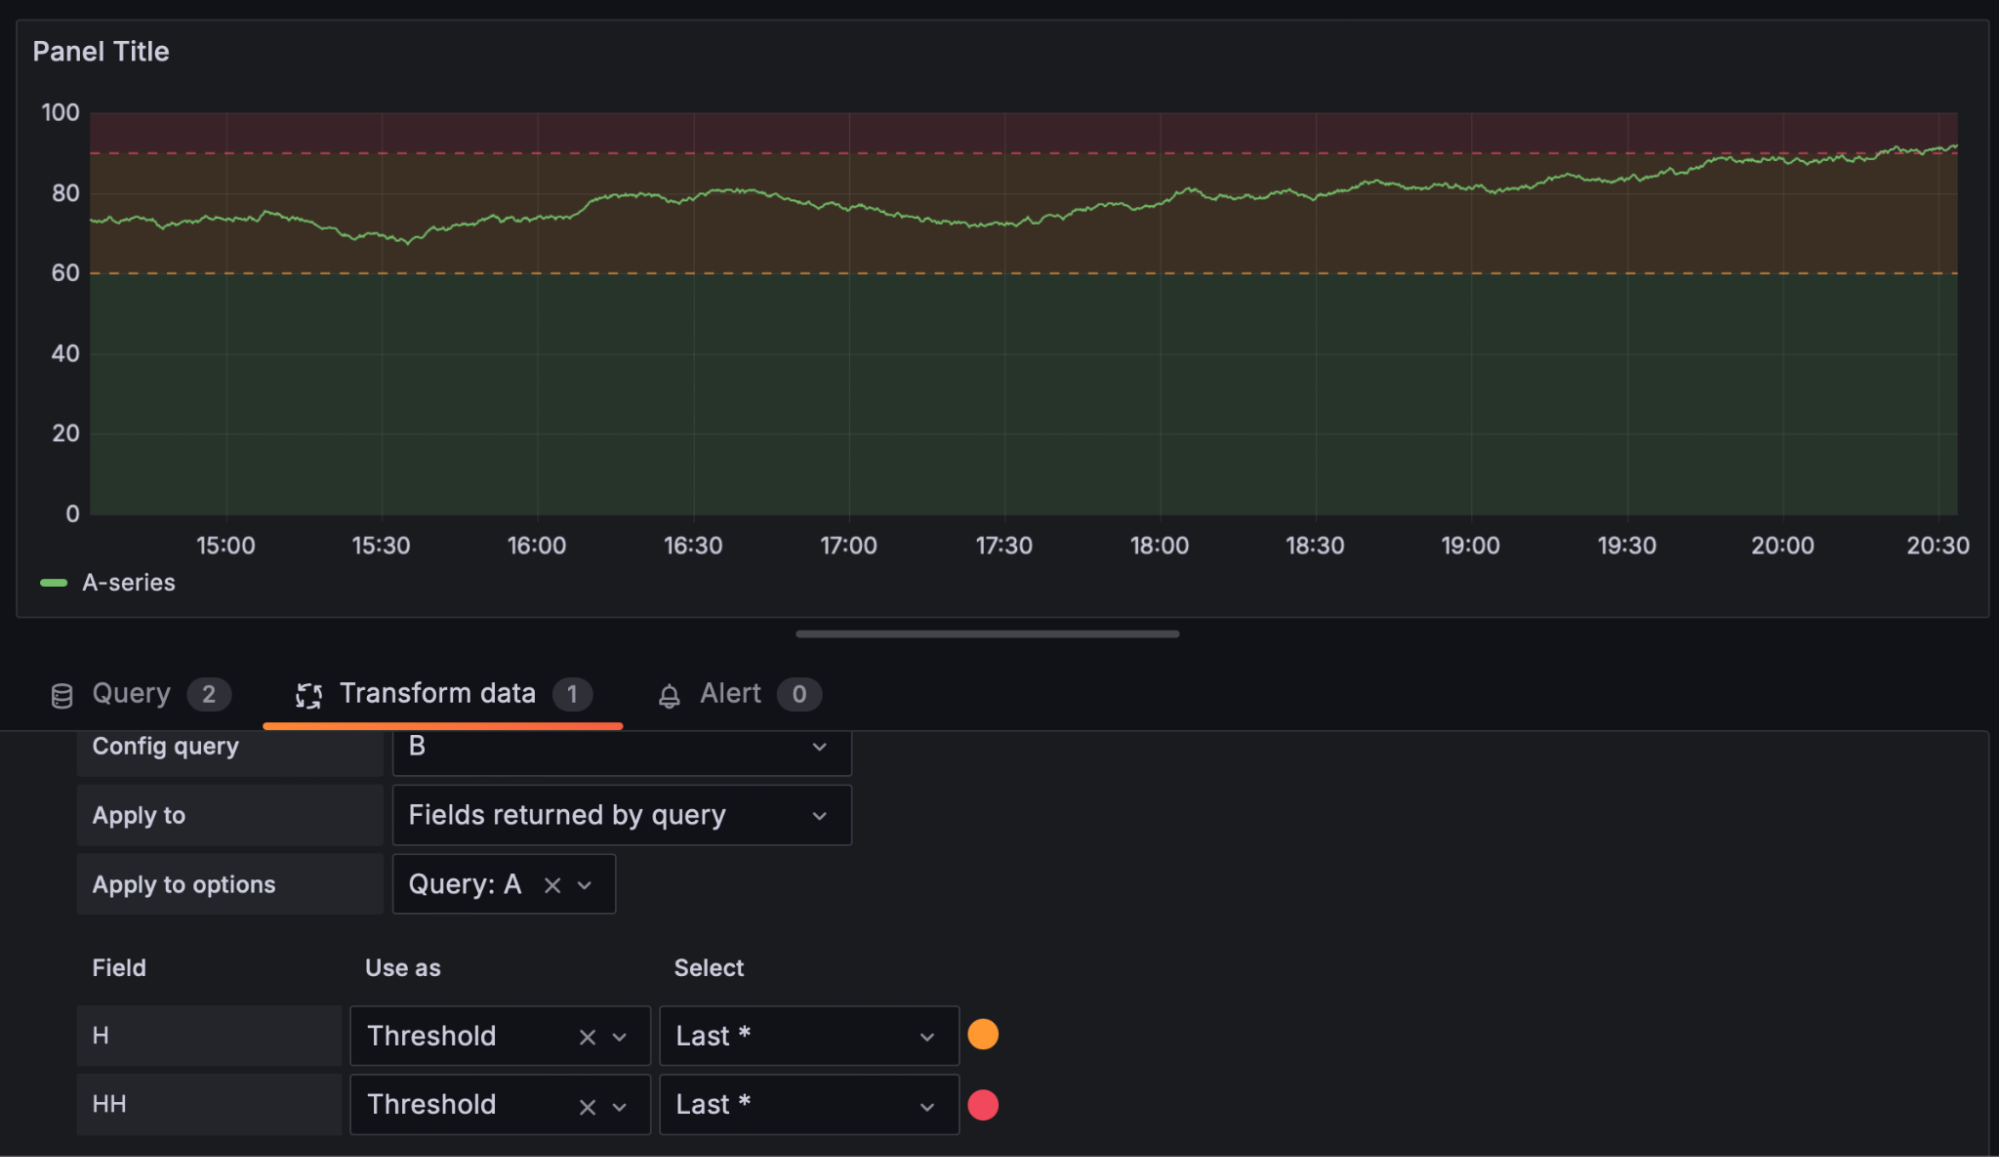
The ability to customize specific colors for individual thresholds when using the Config from query results transformation gives you greater control over your visualizations and a clearer understanding of your data.
To learn more, read our Config from query results documentation.

5. Substring matcher added to Filter data by values
The Filter data by values transformation simplifies data filtering by enabling partial string matching on field values thanks to two new matches: Contains substring and Does not contain substring.
With the substring matcher built into the Filter data by values transformation, you can efficiently filter large datasets for keywords, product names, or user IDs, displaying relevant information quickly and precisely.
6. Plot enum values in your time series and state timeline visualizations
You can now plot enum values in your time series and state timeline visualizations. This feature is useful when you want to visualize the state of a system, such as the status of a service or the health of a device. For example, you can use this feature to visualize the status of a service as ON, STANDBY, or OFF. To display enum values, you can use the Convert field type transformation.
7. Dashboard variables in transformations
We’ve extended the support for dashboard variables beyond the Add field from calculation transformation to include the following transformations:
- Filter by value
- Create heatmap
- Histogram
- Sort by, Limit
- Filter by name
- Join by field
8. Unary operations for the Add field from calculation transformation
A unary operation is a new mode for the Add field from calculation transformation that lets you apply mathematical operations to a field that support the following:
- Absolute value (
abs) – returns the absolute value of a given expression. It represents its distance from zero as a positive number. - Natural exponential (
exp) – returns e raised to the power of a given expression. - Natural logarithm (
ln) – returns the natural logarithm of a given expression. - Floor (
floor) – returns the largest integer less than or equal to a given expression. - Ceiling (
ceil) – returns the smallest integer greater than or equal to a given expression.
Learn more about the Add field from calculation transformation.
9. Format string fields
With the new Format string transformation, you can manipulate string fields to improve how they’re displayed:
Change caseenables string transformations to upper, lower, sentence, title, pascal, camel, or snake case.Trimremoves white space characters at the start and end of your string.Substringselects a part of your string field.
The formatStringTransformer is available behind a feature flag. To learn more, read the Format string documentation.
10. Apply data transformations to annotations
Data transformations are available for annotation data, making it possible to configure, for example, how exemplars will be displayed in tooltips.
Learn more about Grafana 11
Grafana 11 is generally available and includes a host of new features that makes Grafana easier to use, operate, and extend. Learn more about what’s new, including:
- How to explore metrics without writing any PromQ
- The latest tools in Grafana Alerting for faster incident response
- New features to help build custom visualizations in Canvas panel
To see all the latest features in action, watch our “Grafana 11 Deep Dive” session from GrafanaCON 2024, available on demand now.
For an in-depth list of all the new features in Grafana 11, check out our Grafana documentation, the Grafana changelog, or our What’s New documentation.
Upgrade to Grafana 11
Download Grafana 11 today or experience all the new features by signing up for Grafana Cloud, which offers an actually useful Cloud Free tier and plans for every use case. Sign up for a free Grafana Cloud account today.
Our Grafana upgrade guide also provides step-by-step instructions for those looking to upgrade from an earlier version to ensure a smooth transition.
Join the Grafana Labs community
We welcome any feedback you have on Canvas and look forward to partnering with the community on future development. Interested in learning about the origins of Canvas? Check out our original Canvas panel blog post.
We also invite you to engage with the Grafana Labs community forums. Share your experiences with the new features, discuss best practices, and explore creative ways to integrate these updates into your workflows.
A special thanks to our community
We extend our heartfelt gratitude to the Grafana community!
Your contributions, ranging from pull requests to valuable feedback, are crucial in continually enhancing Grafana. And your enthusiasm and dedication inspire us at Grafana Labs to persistently innovate and elevate the Grafana platform.
Grafana Cloud is the easiest way to get started with metrics, logs, traces, dashboards, and more. We have a generous forever-free tier and plans for every use case. Sign up for free now!


