Grafana Alerting: new tools to resolve incidents faster and avoid alert fatigue
The maturity of your alerting strategy has a direct impact on the reliability of your infrastructure and your applications. It can also have a big impact on engineering productivity. So whether you’re talking about resolving incidents faster or avoiding alerting fatigue, alerting should always be front and center.
With Grafana Alerting, you can alert on logs and metrics no matter where your data is stored, which makes it a powerful tool for consolidating and automating how you observe your system. In recent months we’ve worked hard to make it easier to create, manage, and triage alerts. We’ve also looked to address the needs of enterprise users that want scalability around as-code deployments and support for multiple teams working in the same environment.
In this blog post, we’ll recap some of the exciting updates we’ve made on the road to Grafana 11, which is now generally available. These upgrades can help you identify and resolve issues faster, and improve the quality of life for the engineers who get notified when something goes wrong at 3 a.m.
For a deep dive into the latest features in Grafana Alerting, you can also check out the “Evolution of Grafana Alerting” session from GrafanaCON 2024, which is available to watch on demand.
Dynamic alert routing simplified
Availability: Grafana Cloud, Grafana Enterprise, Grafana OSS
You can already add labels to notification policies in Grafana Alerting to route alerts to different receivers (email, Slack, Grafana OnCall, etc.) in order to modify where that alert is delivered. This dynamic functionality is incredibly powerful, but it is often confusing for users who are unfamiliar with this unique approach, as well as those that don’t need to set up dynamic routing trees. While some users love this feature, others found themselves either creating more issues than they were solving or they just bypassed it altogether.
With simplified routing, we’ve taken that same functionality and abstracted it, which resolves the complexity issues that prevented many users from leveraging these capabilities. Now, you simply select a contact point you want the alert to go to, and we’ll automatically generate that policy in the background. You can then modify your policies, mute timings, change groupings, and more.
A new dashboard view designed to expedite triage
Availability: Grafana Cloud, Grafana Enterprise, Grafana OSS
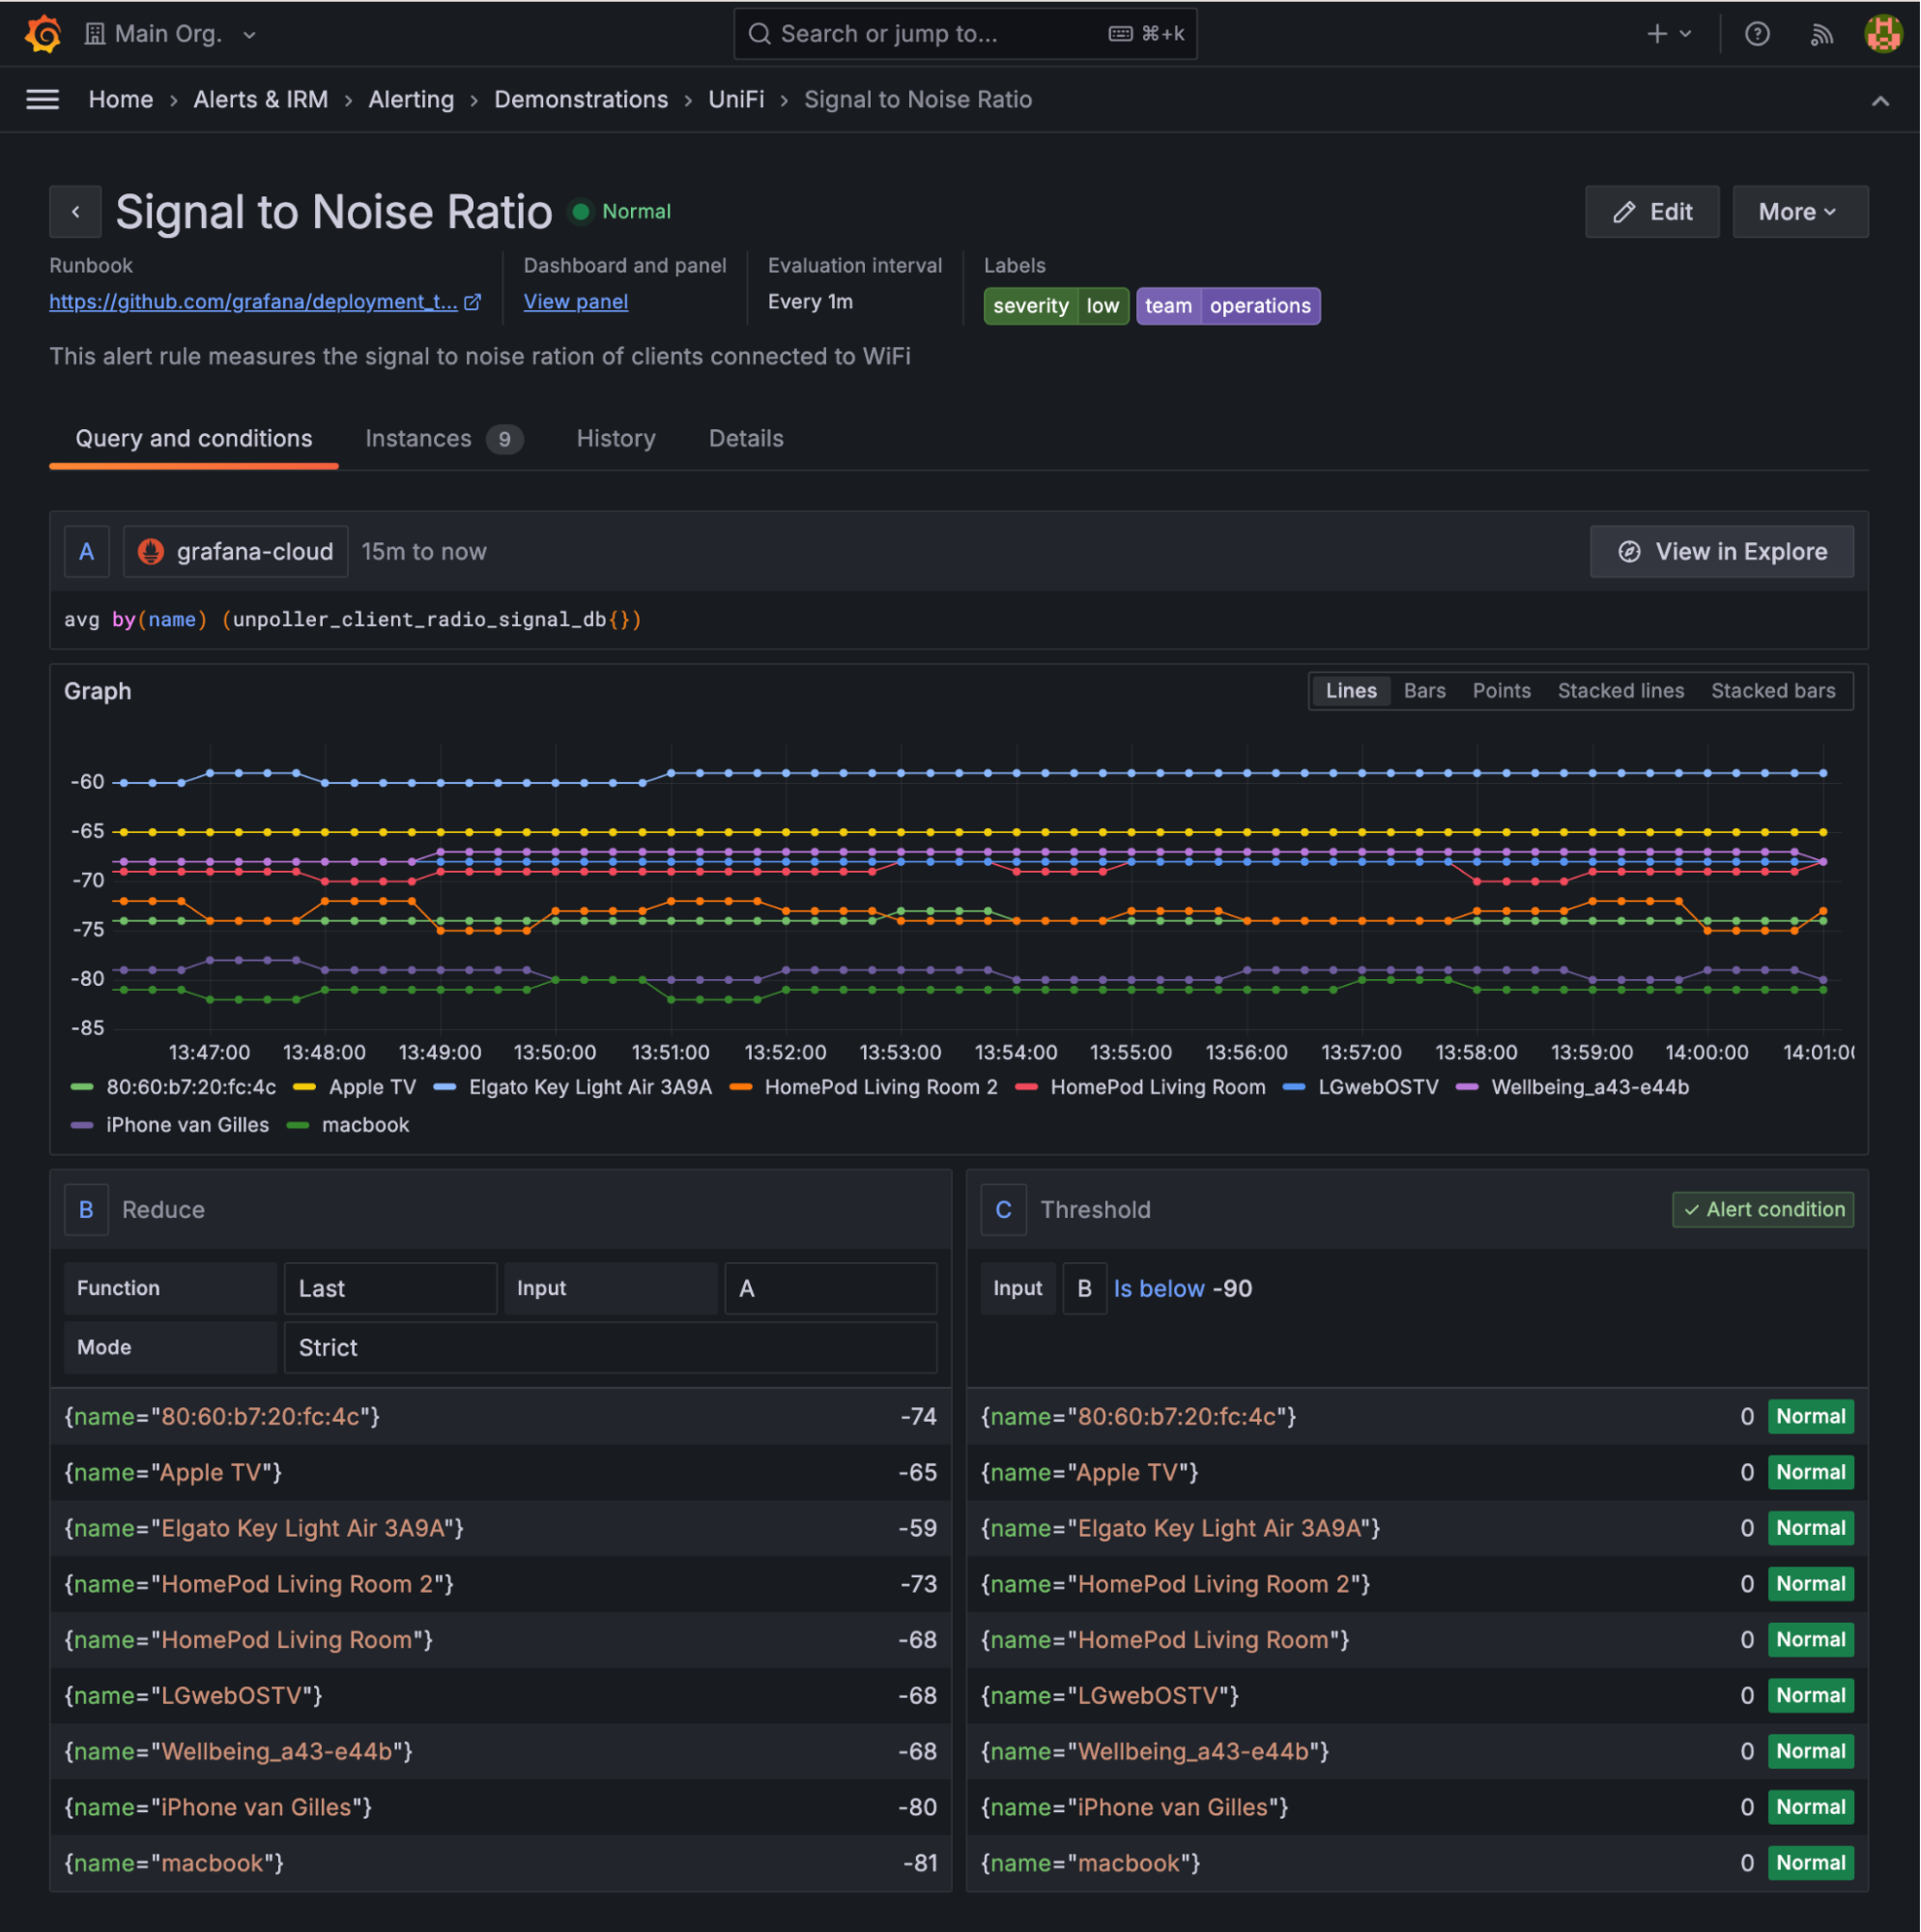
We’ve redesigned the alert details view to better facilitate alert triage. This pulls together important information — such as the query for a specific alert — that was otherwise buried in the UI and makes it easily scannable when you first open the page. You’ll now find the namespace and group in the breadcrumb navigation, which you can use to easily filter your rules.
We’ve also added a History tab that makes it easier to understand what’s happened, provided a more feature-rich view of your instances, and revamped the layout to make the entire experience flow better.

TCO reduction through updated rule evaluations
Availability: Grafana Cloud, Grafana Enterprise, Grafana OSS
We just made an update to our rule evaluation that should provide significant improvements for virtually all Grafana Alerting users by eliminating the need to store certain historical data and resolving an existing memory leak issue.
Previously, the state manager stored the results of multiple prior evaluations, which meant users were able to write rules that eventually consumed all available memory. But since Grafana Alerting only reads the most recent evaluation, we’ve updated the system to only hang on to the most recent data we need.
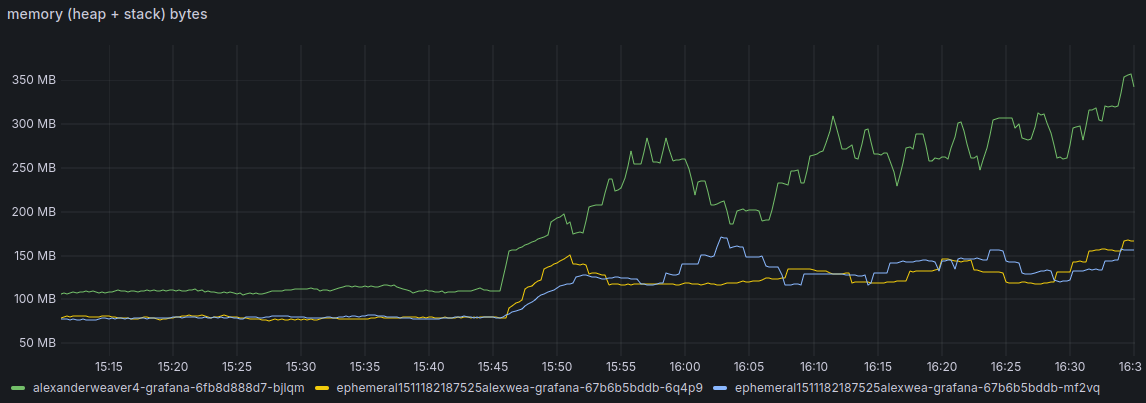
We expect heavy Grafana Alerting users will be able to save gigabytes of data storage with this fix. Even on a basic instance with five simple rules, this fix can reduce your entire Grafana memory usage by as much as 30%! To illustrate the savings, check out the graph below, where all three time series track the same alerting rules. The top line is the memory usage without the fix, and bottom lines are memory usage with the fix.

‘Keep last state’ to reduce noise
Availability: Grafana Cloud, Grafana Enterprise, Grafana OSS
We’re excited to share that “keep last state,” a noise-reducing setting that was popular in our deprecated legacy Alerting, is now available in the current version of Grafana Alerting.
Have you ever encountered intermittent NoData or Error alerts and felt unsure about whether to sound the alarm or maintain status quo? This setting provides a nuanced solution to this dilemma, embodying the notion that these responses from your data source don’t necessarily equate to a change in system state.
Rather than jumping to conclusions, this setting maintains the last known state of each instance. So, if a region was functioning normally before experiencing NoData or Error, it stays in the Normal state, while currently problematic regions will continue Firing. This ensures that the alerts adapt more dynamically to changing conditions, without prematurely alarming or dismissing potential issues.
However, it’s essential to note that this isn’t foolproof. Prolonged NoData or Error responses may eventually undermine the reliability of assuming the last known state. For cases where strict monitoring is critical, relying solely on this setting may not be appropriate. In those cases, use a different setting or add separate alert rules to ensure prolonged data source issues are effectively surfaced.
Enhanced security for as-code deployments
Availability: Grafana Cloud, Grafana Enterprise, Grafana OSS
We’ve added RBAC for role provisioning, which allows regular users to access Grafana Alerting’s provisioning API more securely. Previously, you needed a service administrator account, so teams were sharing access across different groups of users. This could create security concerns since it gives those users server-wide settings and resources.
But with RBAC, those same users can access the API to create or silence alerts, and admins can be confident that access will tie back to their Grafana permissions. This is particularly helpful for teams running alerting as code because you do not need to provide admin level access to all your users.
Tighter integration with Grafana OnCall
Availability: Grafana Cloud, Grafana Enterprise, Grafana OSS
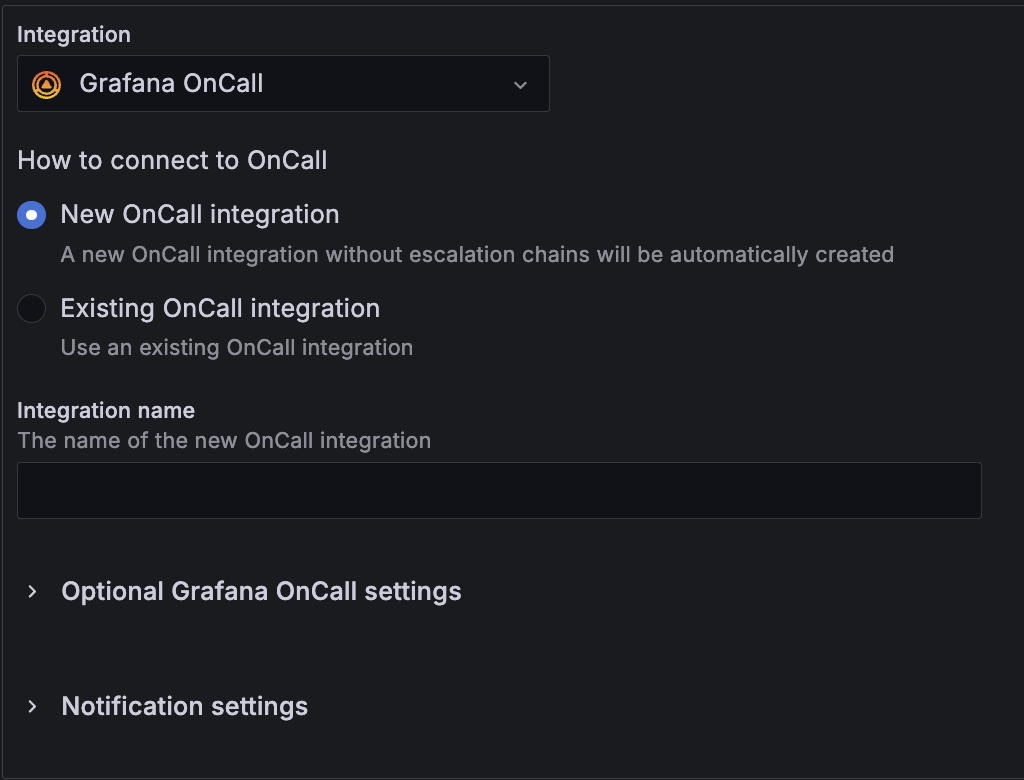
Grafana OnCall is now a first-class citizen in Grafana Alerting. Grafana OnCall is now its own contact point type, which makes it super simple to spin up your on-call setup from one UI or connect to an existing OnCall integration via a drop-down selection. You get a bunch of functionality, and you no longer need a custom webhook, making it easy to identify specific OnCall integrations within your alerting workflow.

Distributed evaluation intervals for more consistent performance
Availability: Grafana Cloud, Grafana Enterprise, Grafana OSS
When you make rules in Grafana Alerting and add them to different evaluation groups, those groups might have different evaluation windows. Those windows then define how often that alert hits the data source so you can see if the alert is firing. This adds some nice flexibility, but it can also lead to a problem.
Previously, all the rules were evaluated at the start of those intervals, which would create a flood of requests. This led to a sudden spike in resource utilization on queried data sources, which would slow performance or even crash busy databases. With recent updates to Grafana Alerting, we’ve spread the evaluation over the whole time frame, so you’re consuming fewer resources and don’t have to worry about those sudden spikes.

Think of it like running a box office. If you schedule all your customers to come to purchase tickets at the same time, you get a massive flood of requests, a long line, and you have to work extra hard to facilitate all your requests. But if you space your customers out, then you don’t need as many booths open and you can facilitate all requests with less resources.
Reduce noise with recovery threshold for alerts
Availability: Grafana Cloud, Grafana Enterprise, Grafana OSS
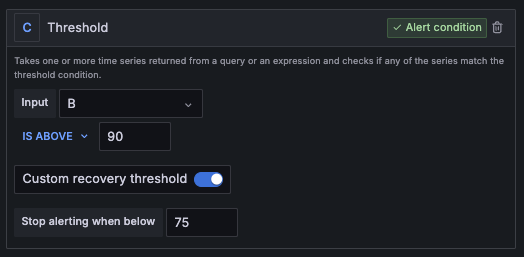
Alert thresholds are a foundational part of a proactive observability strategy. For example, maybe you set an alert to fire when a server hits 90% utilization so you can make the necessary adjustments before it runs any hotter and performance starts to degrade. This is great, but it doesn’t allow for a lot of nuance. What’s more, it can also lead to constant alert flapping.
This happens when that same alert is triggered and it’s resolved, but the utilization still isn’t where it needs to be. Let’s say the utilization for that same server is 85%. The alert would get resolved, but chances are it’ll be set off again pretty soon and you’ll find yourself in a loop of alerts and resolutions.
Now, you can set a different threshold for when an alert is triggered and when it’s resolved. So for that same 90% triggering rule, you could set the resolving rule to 70% utilization. That way, as you triage an alert, you have a better sense for what it will take to get it down to a level you’re comfortable with.

More Grafana Alerting goodness
We’ve just walked through some of the biggest updates to Grafana Alerting, but we’ve made many more changes to improve and simplify how you use it, including:
- Export alerting resources to Terraform. You can now export alert rules, contact points, notification policies, and more as Terraform resources so you can start provision resources in the as-code tool.
- View alerts via dashboards. We’ve added an alert button to the top of your dashboards that will show you all the alerts tied to that dashboard.
- Assess routing performance easier. We’ve revamped the contact point list view so it’s easier to see if a contact point is being used, when it last ran, and how long it took to make the trip. This should simplify the process of debugging any performance issues with your data source integration.
- Use new characters in notification policies. We’ve added UTF-8 support so you can add emojis and other characters to your notifications.
- Get a holistic view of alert performance. We’ve added an insights page for Grafana Cloud users to see their entire setup in one place. You can see which alerts are firing the most, evaluate failures, view performance stats, and more.
We know how important alerting is to your observability strategy, so we’ll continue to add functionality and make it easier to use Grafana Alerting. In the meantime, if you’re still on our legacy alerting, check out this blog post, which gives you everything you need to know about how and why you should make the switch now.
Learn more about Grafana 11
Grafana 11 is generally available and includes a host of new features that makes Grafana easier to use, operate, and extend. Learn more about what’s new, including:
- How to explore metrics without writing any PromQL
- 10 ways to get more out of your data with transformations
- How to create custom visualizations with the latest tools in Canvas panel
To see all the latest features in action, watch our “Grafana 11 Deep Dive” session from GrafanaCON 2024, available on demand now.
For an in-depth list of all the new features in Grafana 11, check out our Grafana documentation, the Grafana changelog, or our What’s New documentation.
Upgrade to Grafana 11
Download Grafana 11 today or experience all the new features by signing up for Grafana Cloud, which offers an actually useful Cloud Free tier and plans for every use case. Sign up for a free Grafana Cloud account today.
Our Grafana upgrade guide also provides step-by-step instructions for those looking to upgrade from an earlier version to ensure a smooth transition.
Join the Grafana Labs community
We also invite you to engage with fellow Grafana users in the Grafana Labs community forums. Share your experiences with the new features, discuss best practices, and explore creative ways to integrate these updates into your workflows.
A special thanks to our community
We extend our heartfelt gratitude to the Grafana community!
Your contributions, ranging from pull requests to valuable feedback, are crucial in continually enhancing Grafana. And your enthusiasm and dedication inspire us at Grafana Labs to persistently innovate and elevate the Grafana platform.


