
Canvas panel in Grafana: create custom visualizations with all the latest features
The Canvas panel, which was generally available in Grafana 10, combines the power of Grafana with the flexibility of custom elements. Canvas visualizations are extensible, form-built panels you can use to explicitly place elements within static and dynamic layouts. This allows you to design custom visualizations and overlay data in ways that aren’t possible with standard Grafana panels. Best part? It can all be done within Grafana’s UI.
Let’s take a look at all of the exciting new features we’ve added as part of Grafana 11, which is now generally available.
Flowcharting
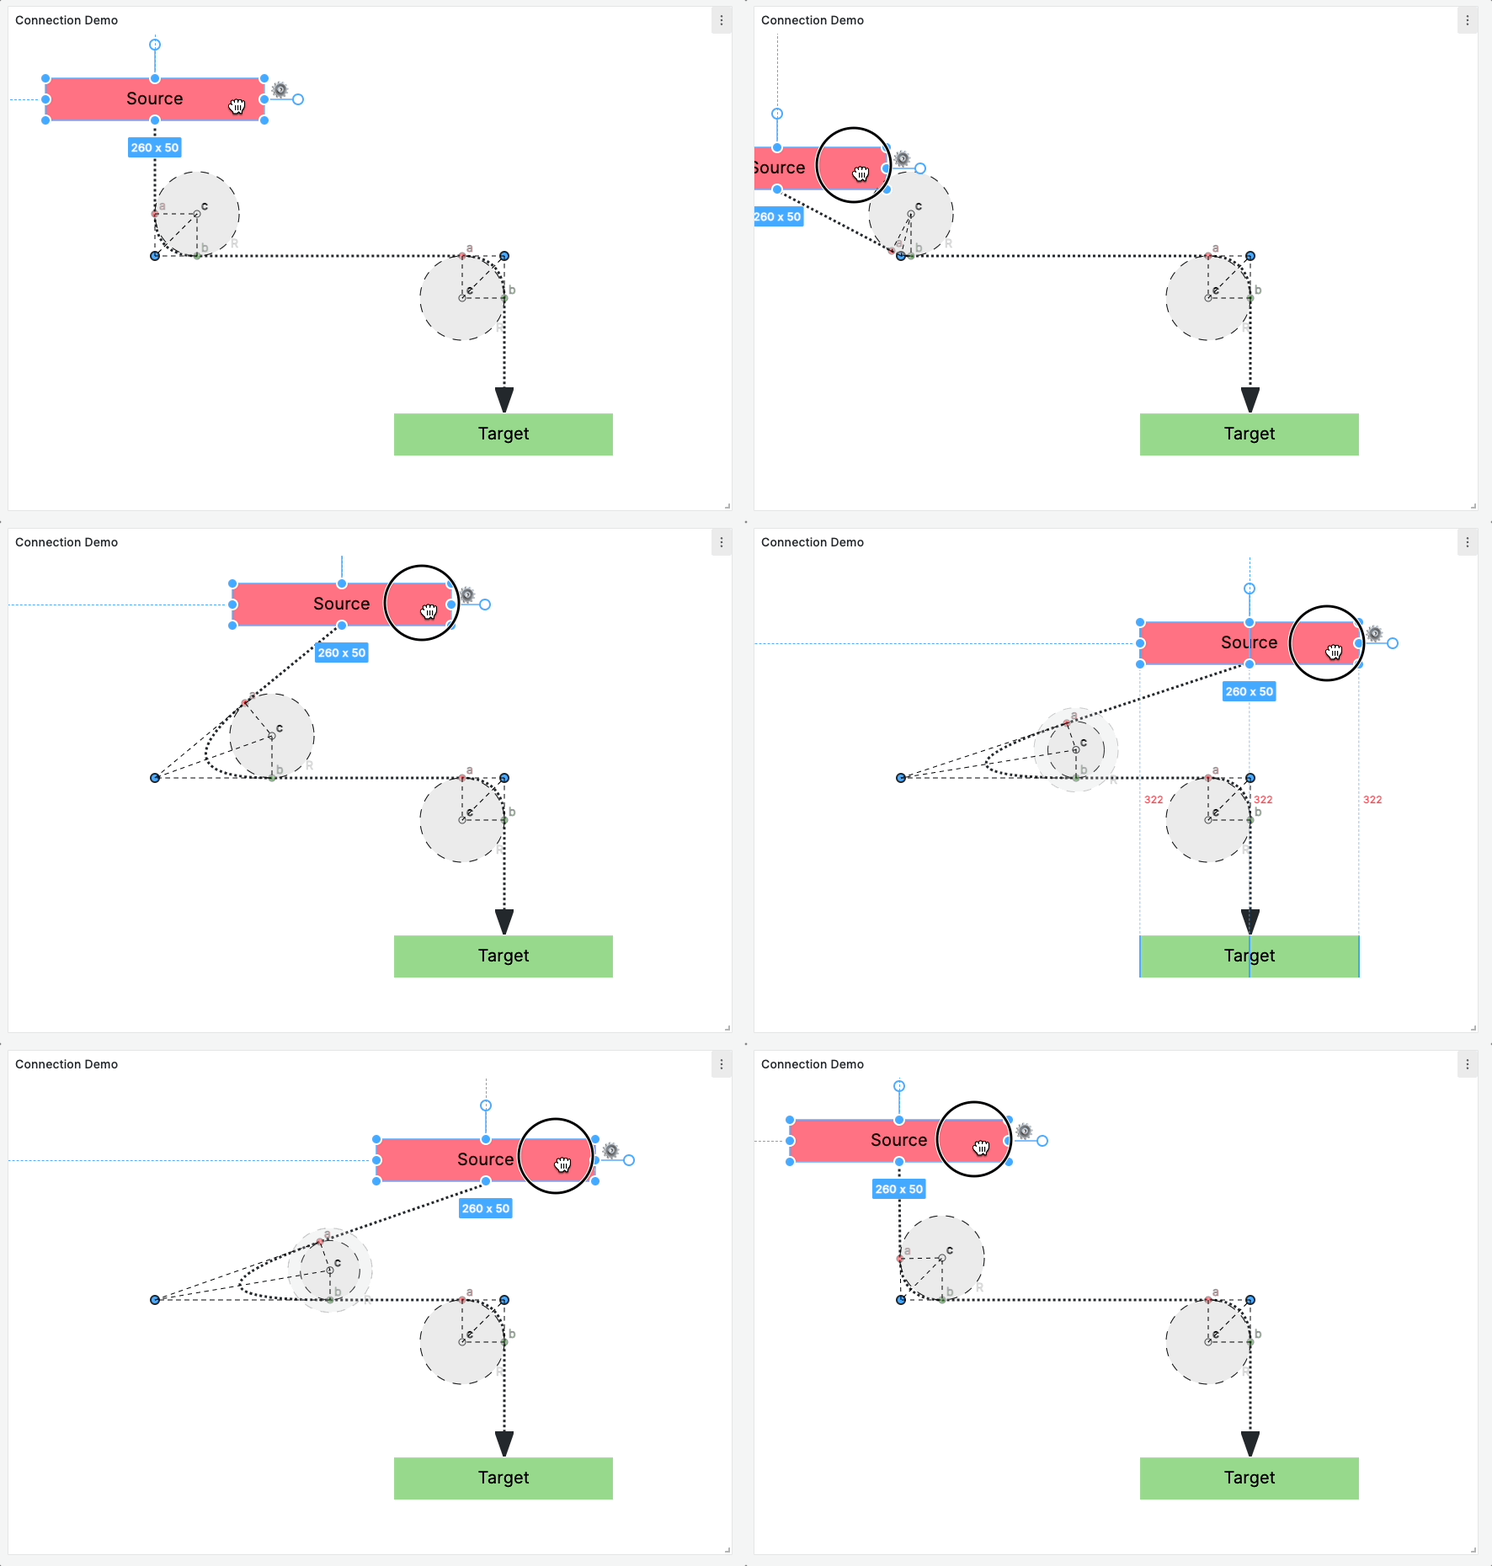
You can now build rich, dynamic flowcharts with your canvas panel. From process flow diagrams to complex network maps, you can create and customize connections to visualize the relationships between elements.
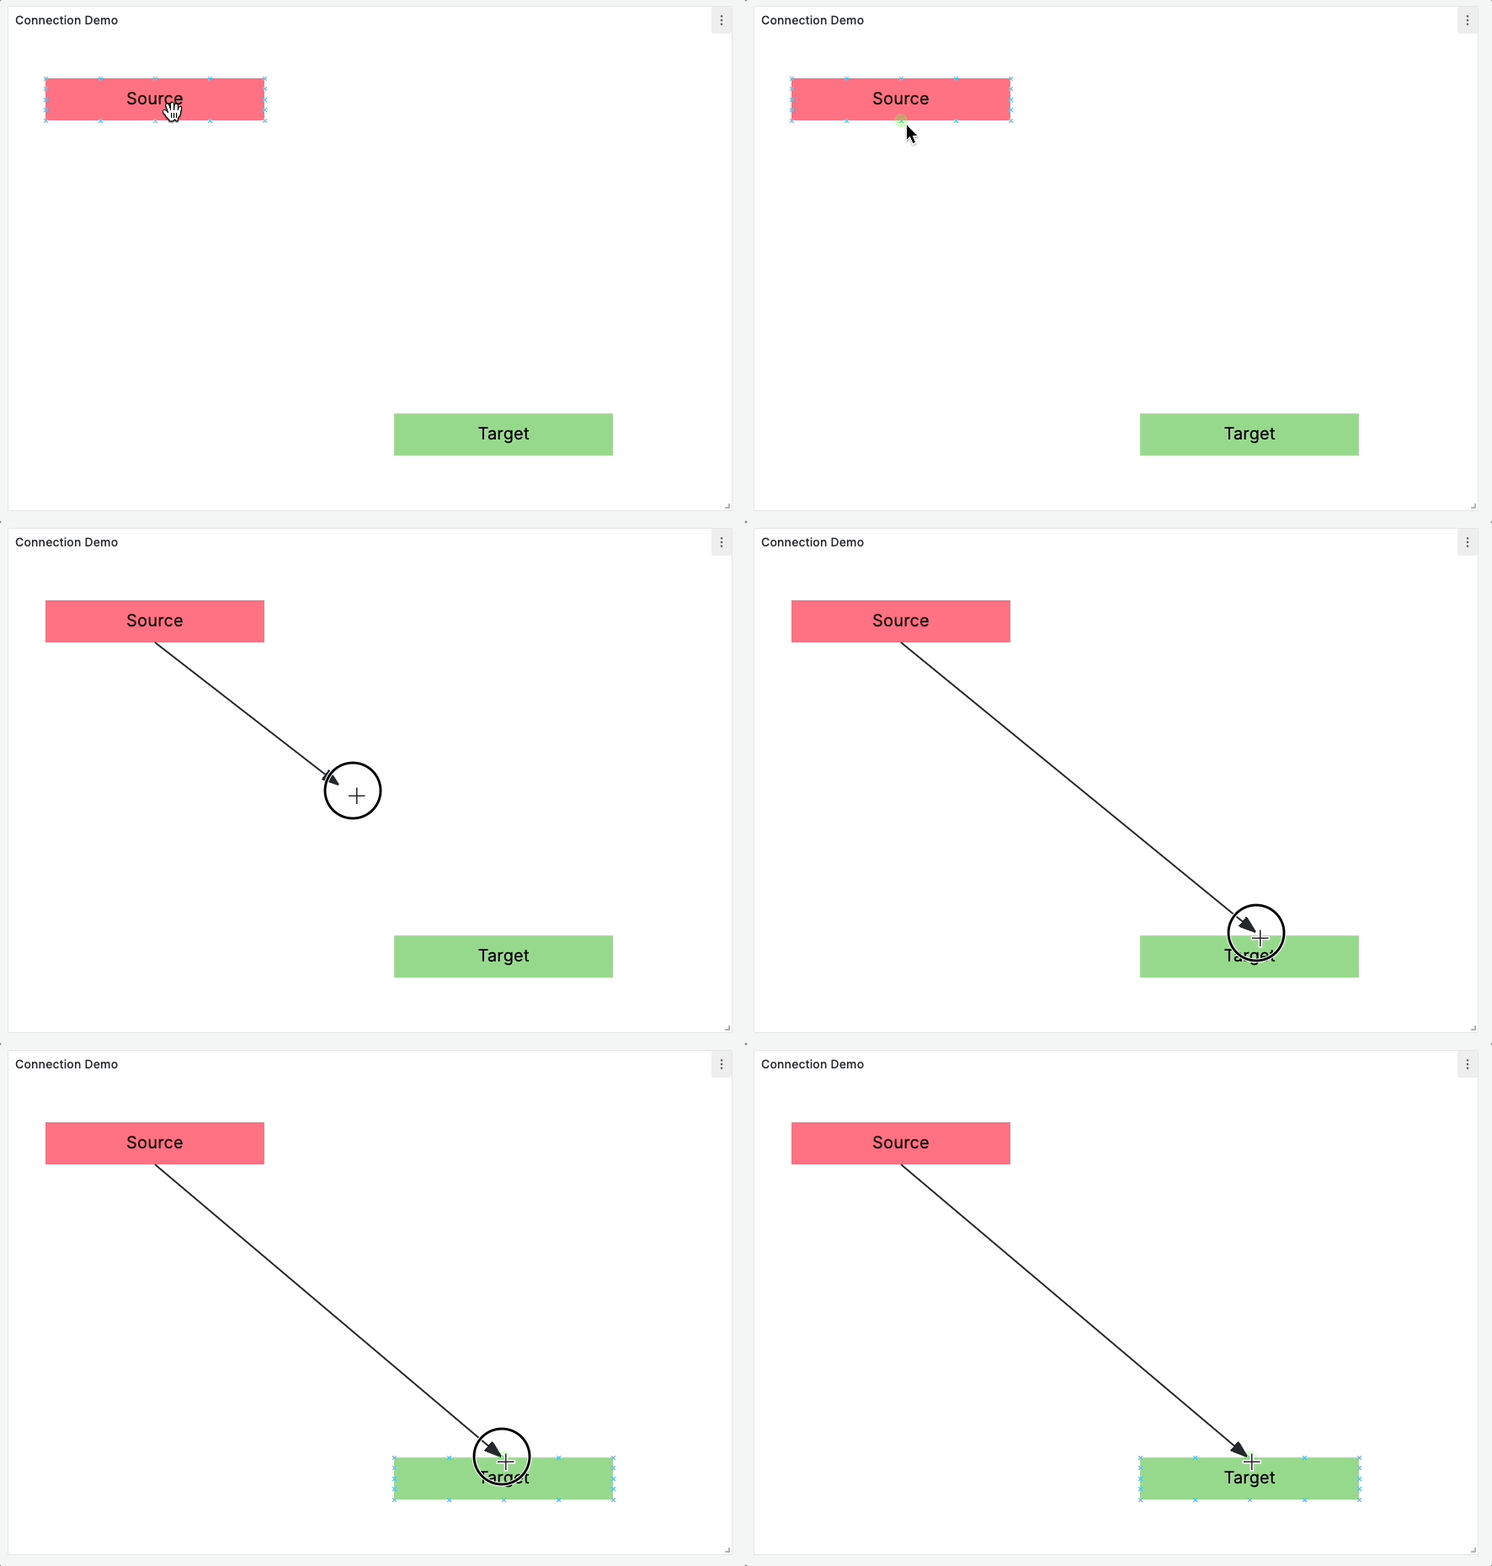
Every element has a series of anchor points where connections can be attached.

Simply click and drag from one anchor point to another to create a new connection.
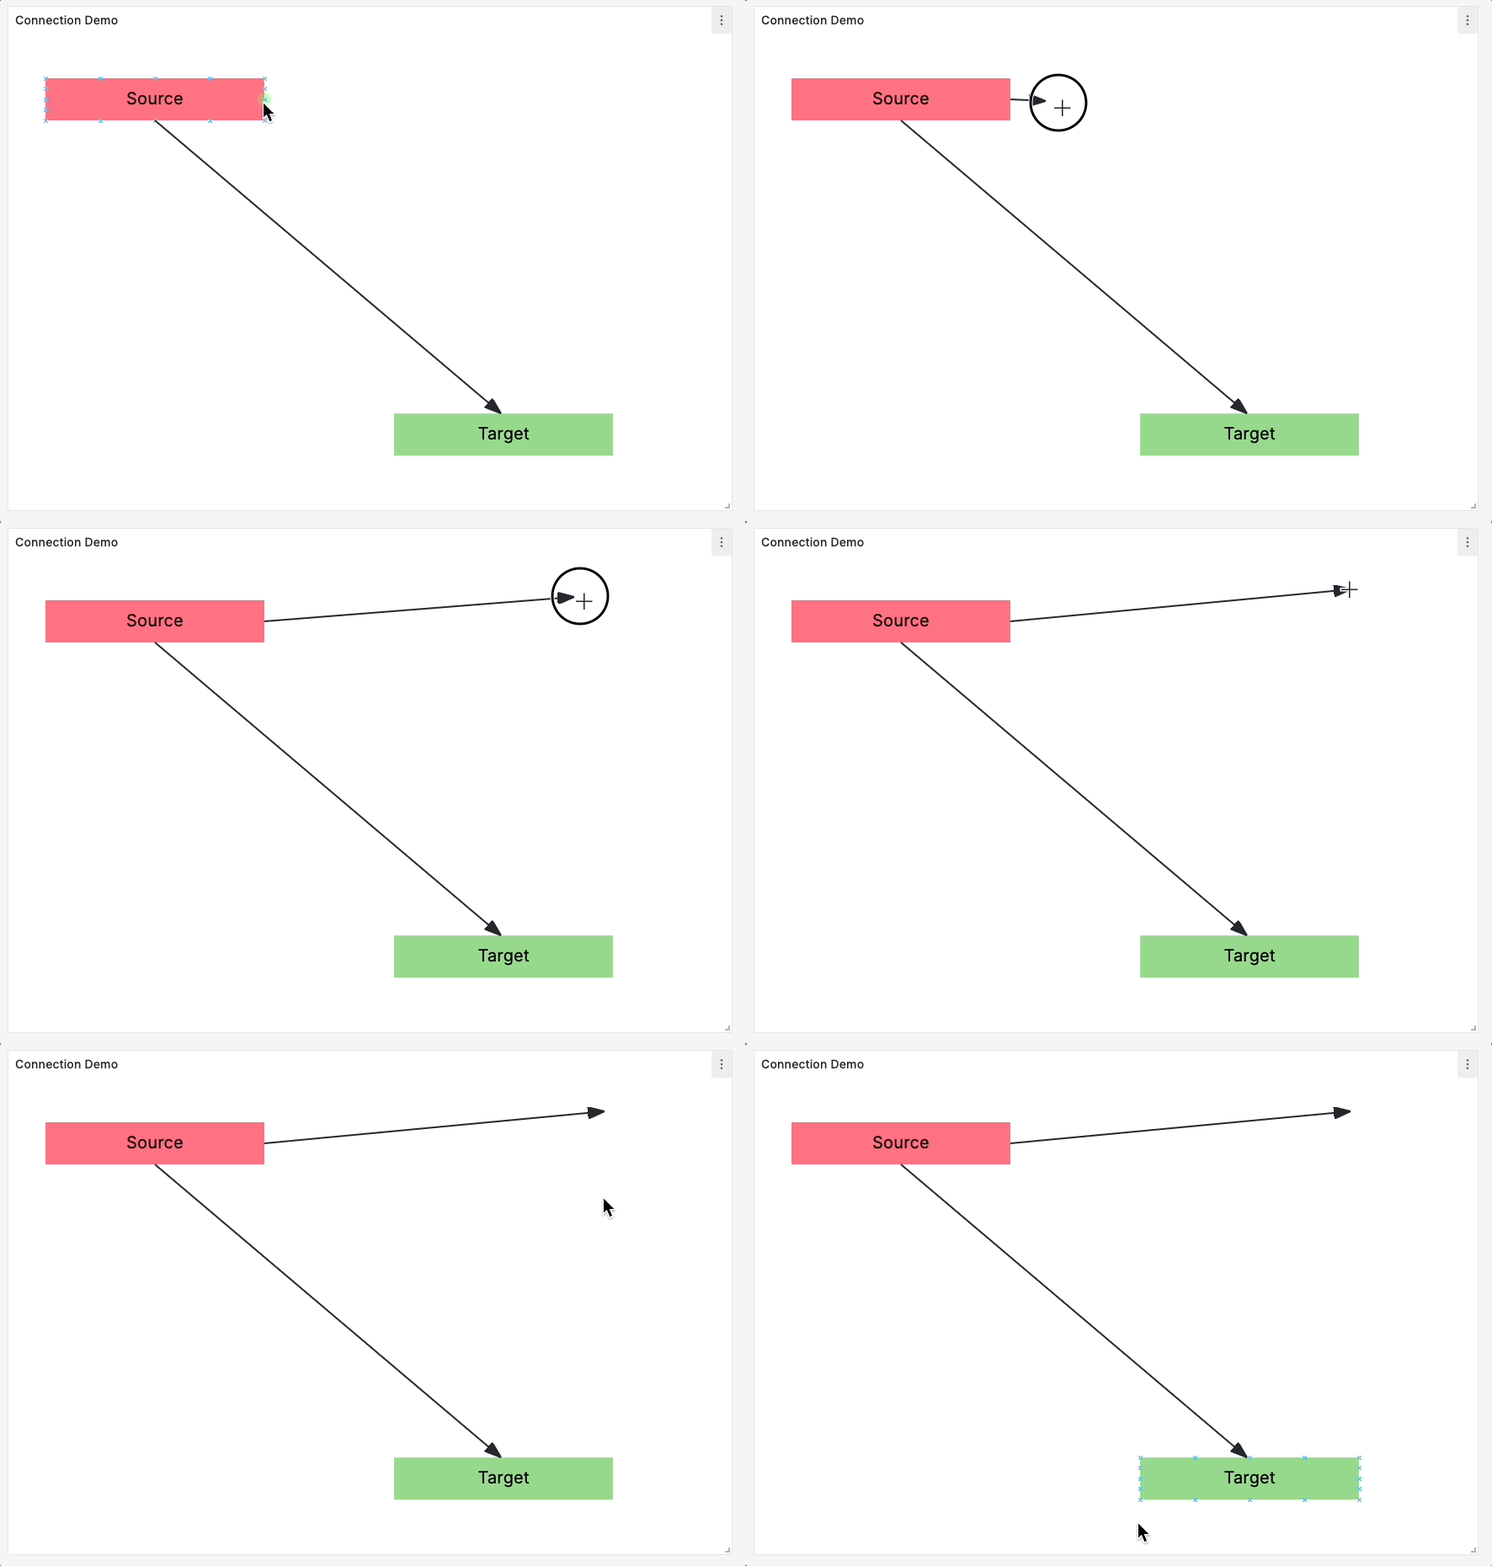
You can also create connections that don’t end at an anchor point if you’re feeling adventurous and just need to let go!
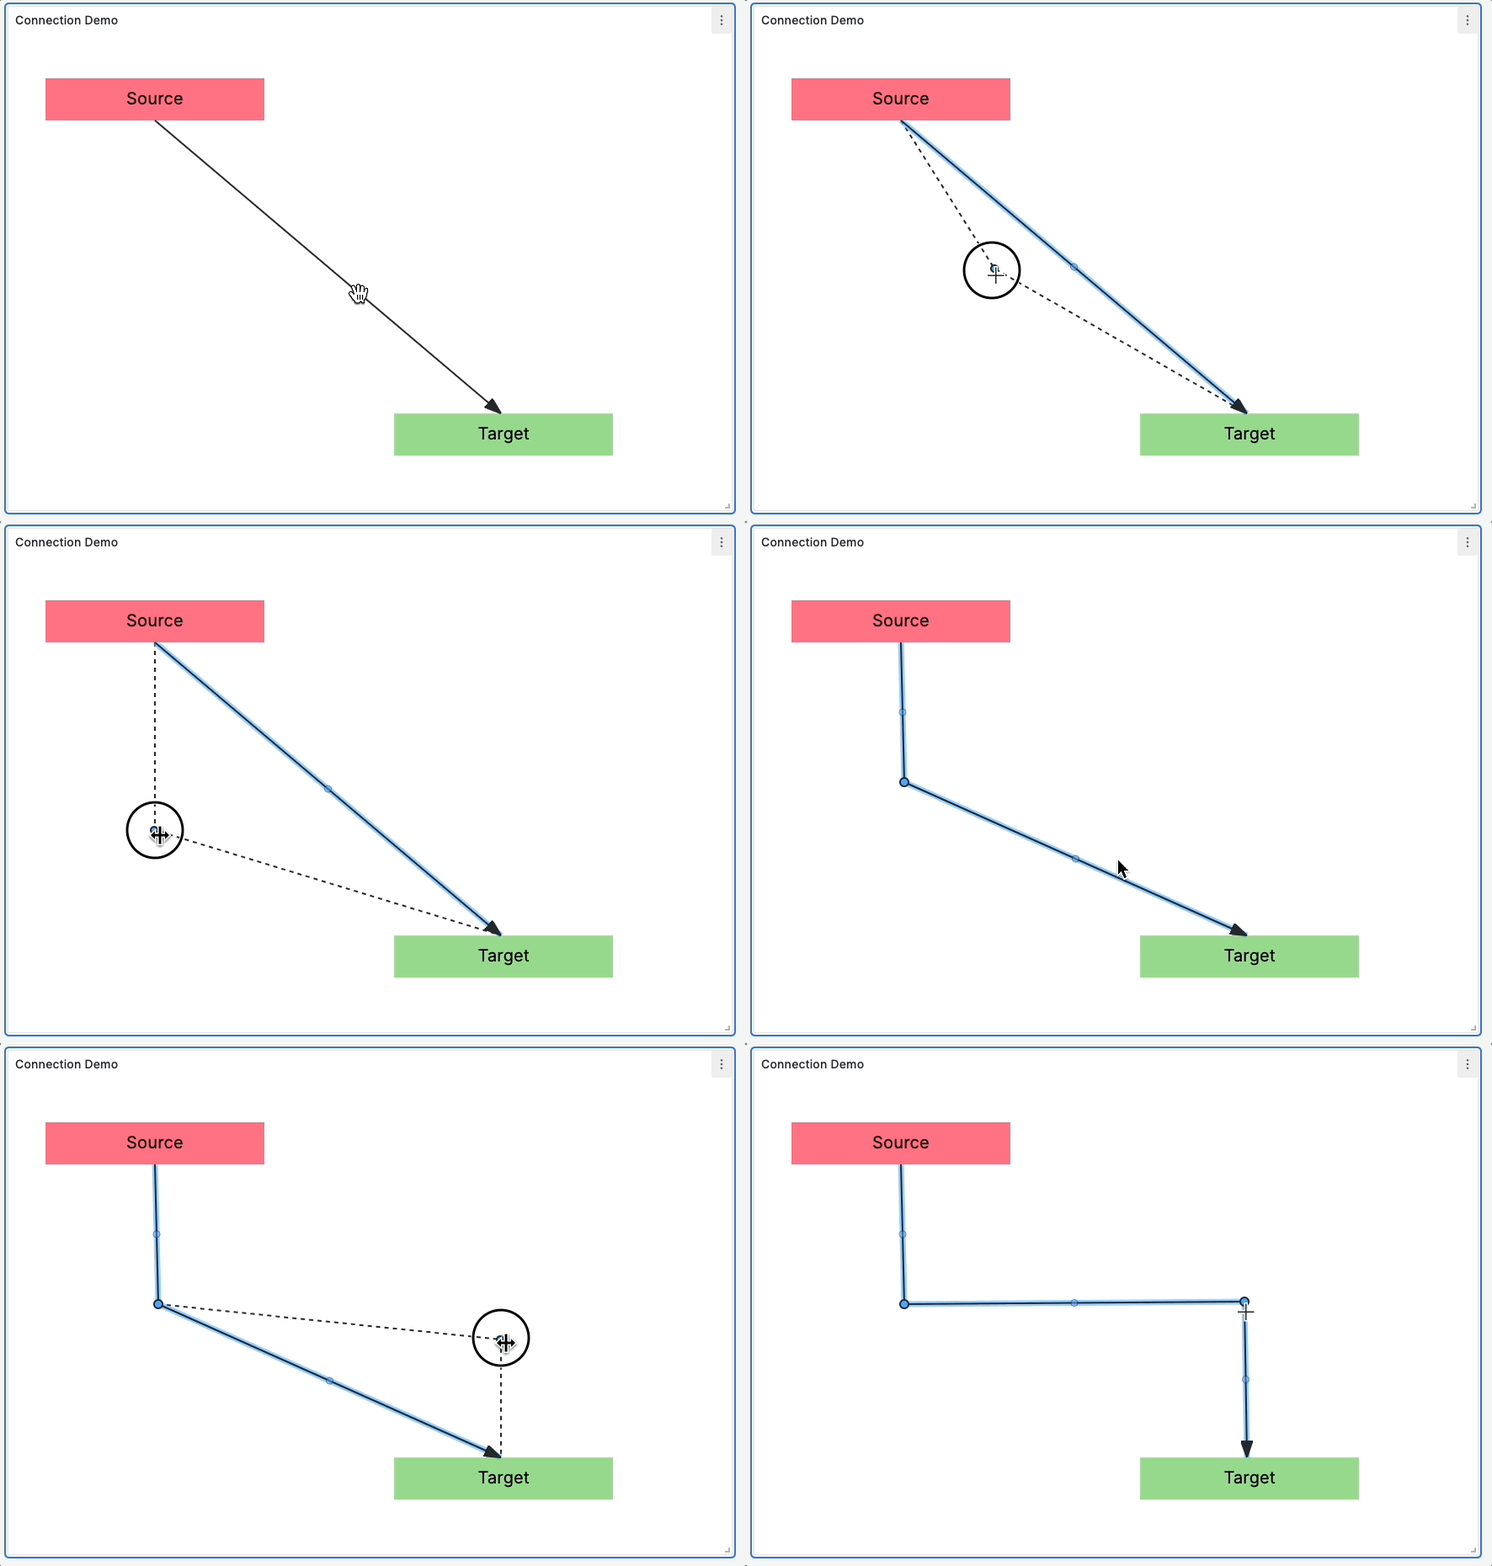
To change the shape of a connection, simply drag the midpoint control of any segment to create a new vertex. You will see your segment snap into place as you get close to vertical or horizontal.
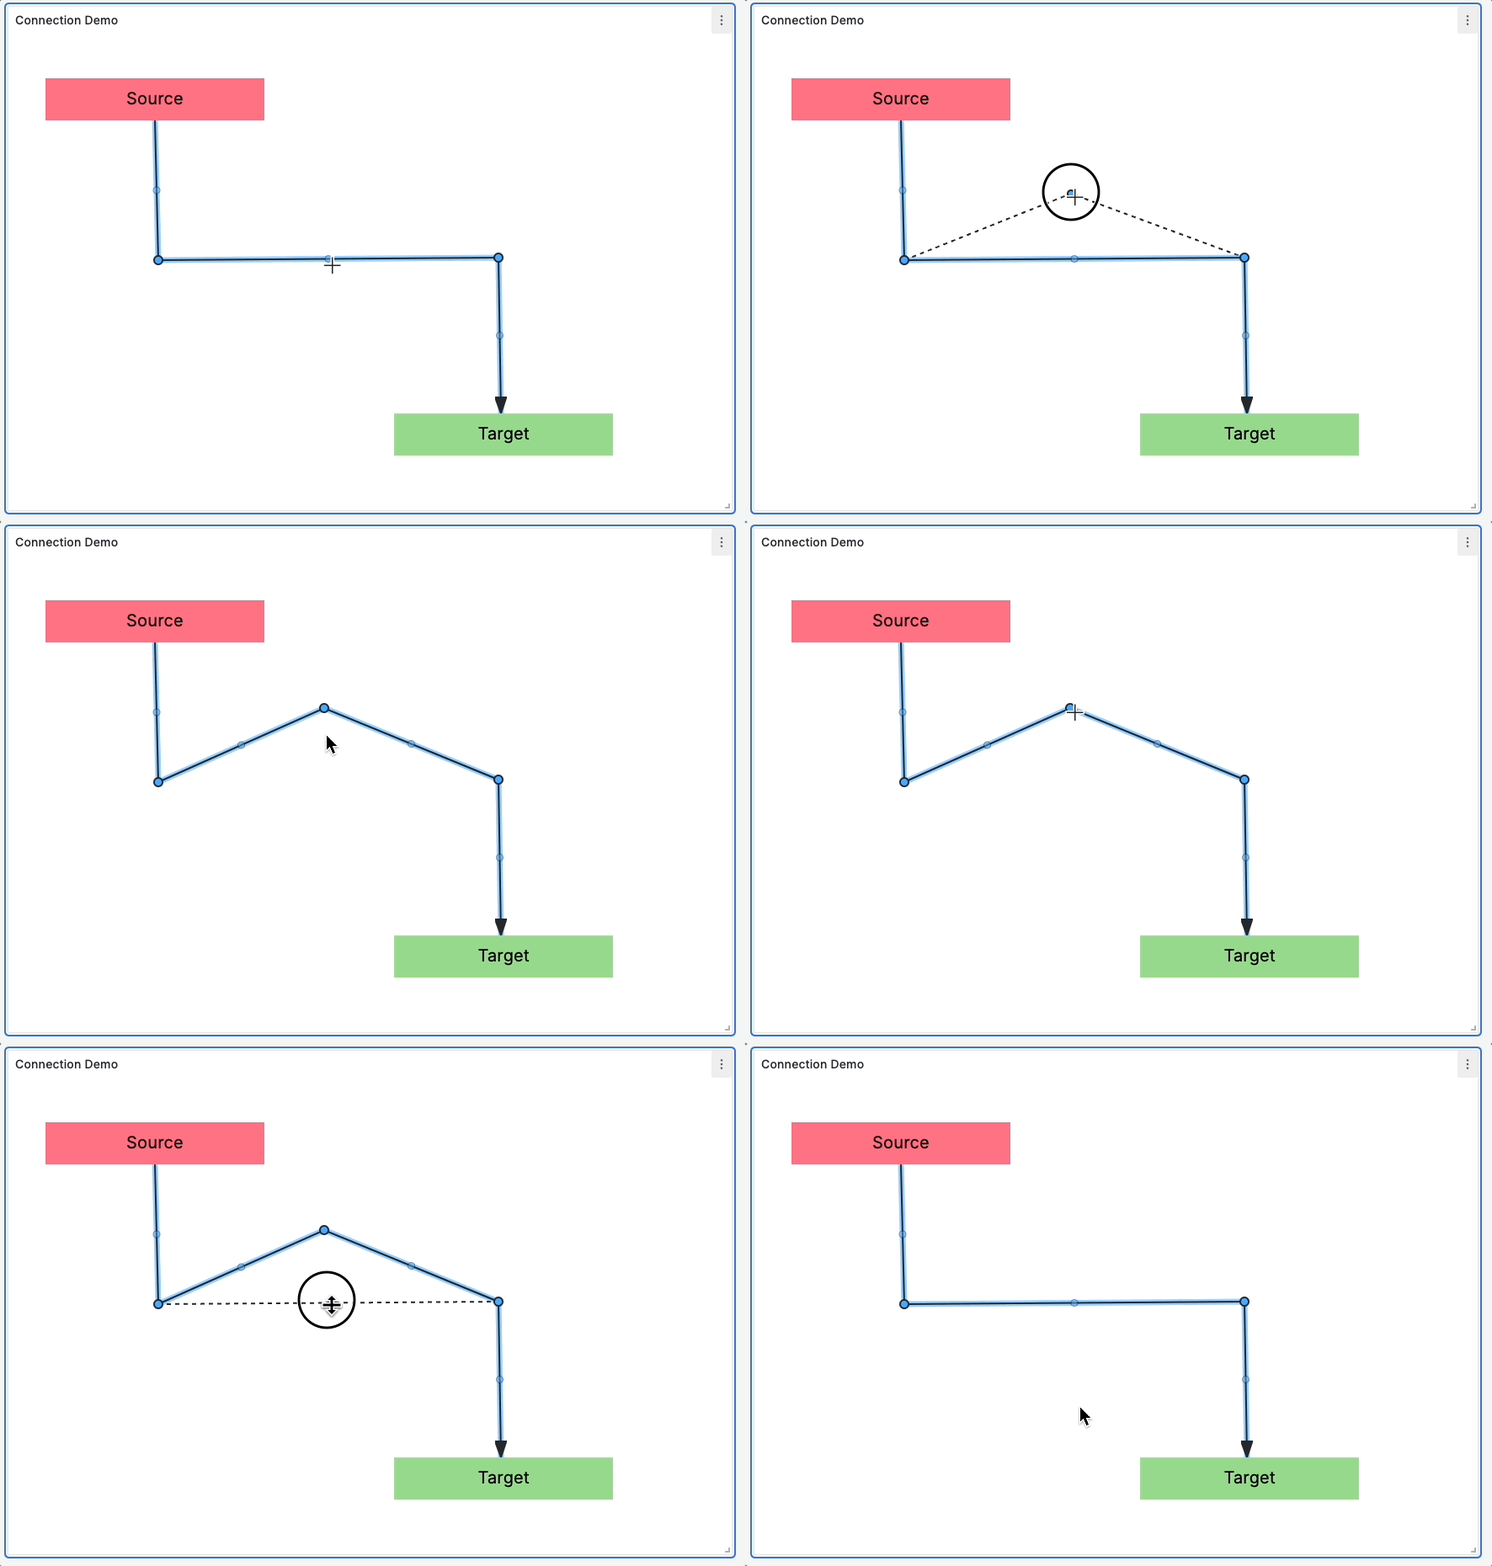
To remove a vertex, drag it until it snaps into a straight line once again.
Your customized connection shape is not directly impacted by the position of the anchor elements. Moving the source and target elements will only impact how the first and last segments are displayed, respectively. Note: The save model stores your custom connection shape in such a way that it does not care if elements are moved. TLDR: Your vertices will not move when elements do.
Deleting an element, however, will remove all connections anchored to it as a target.
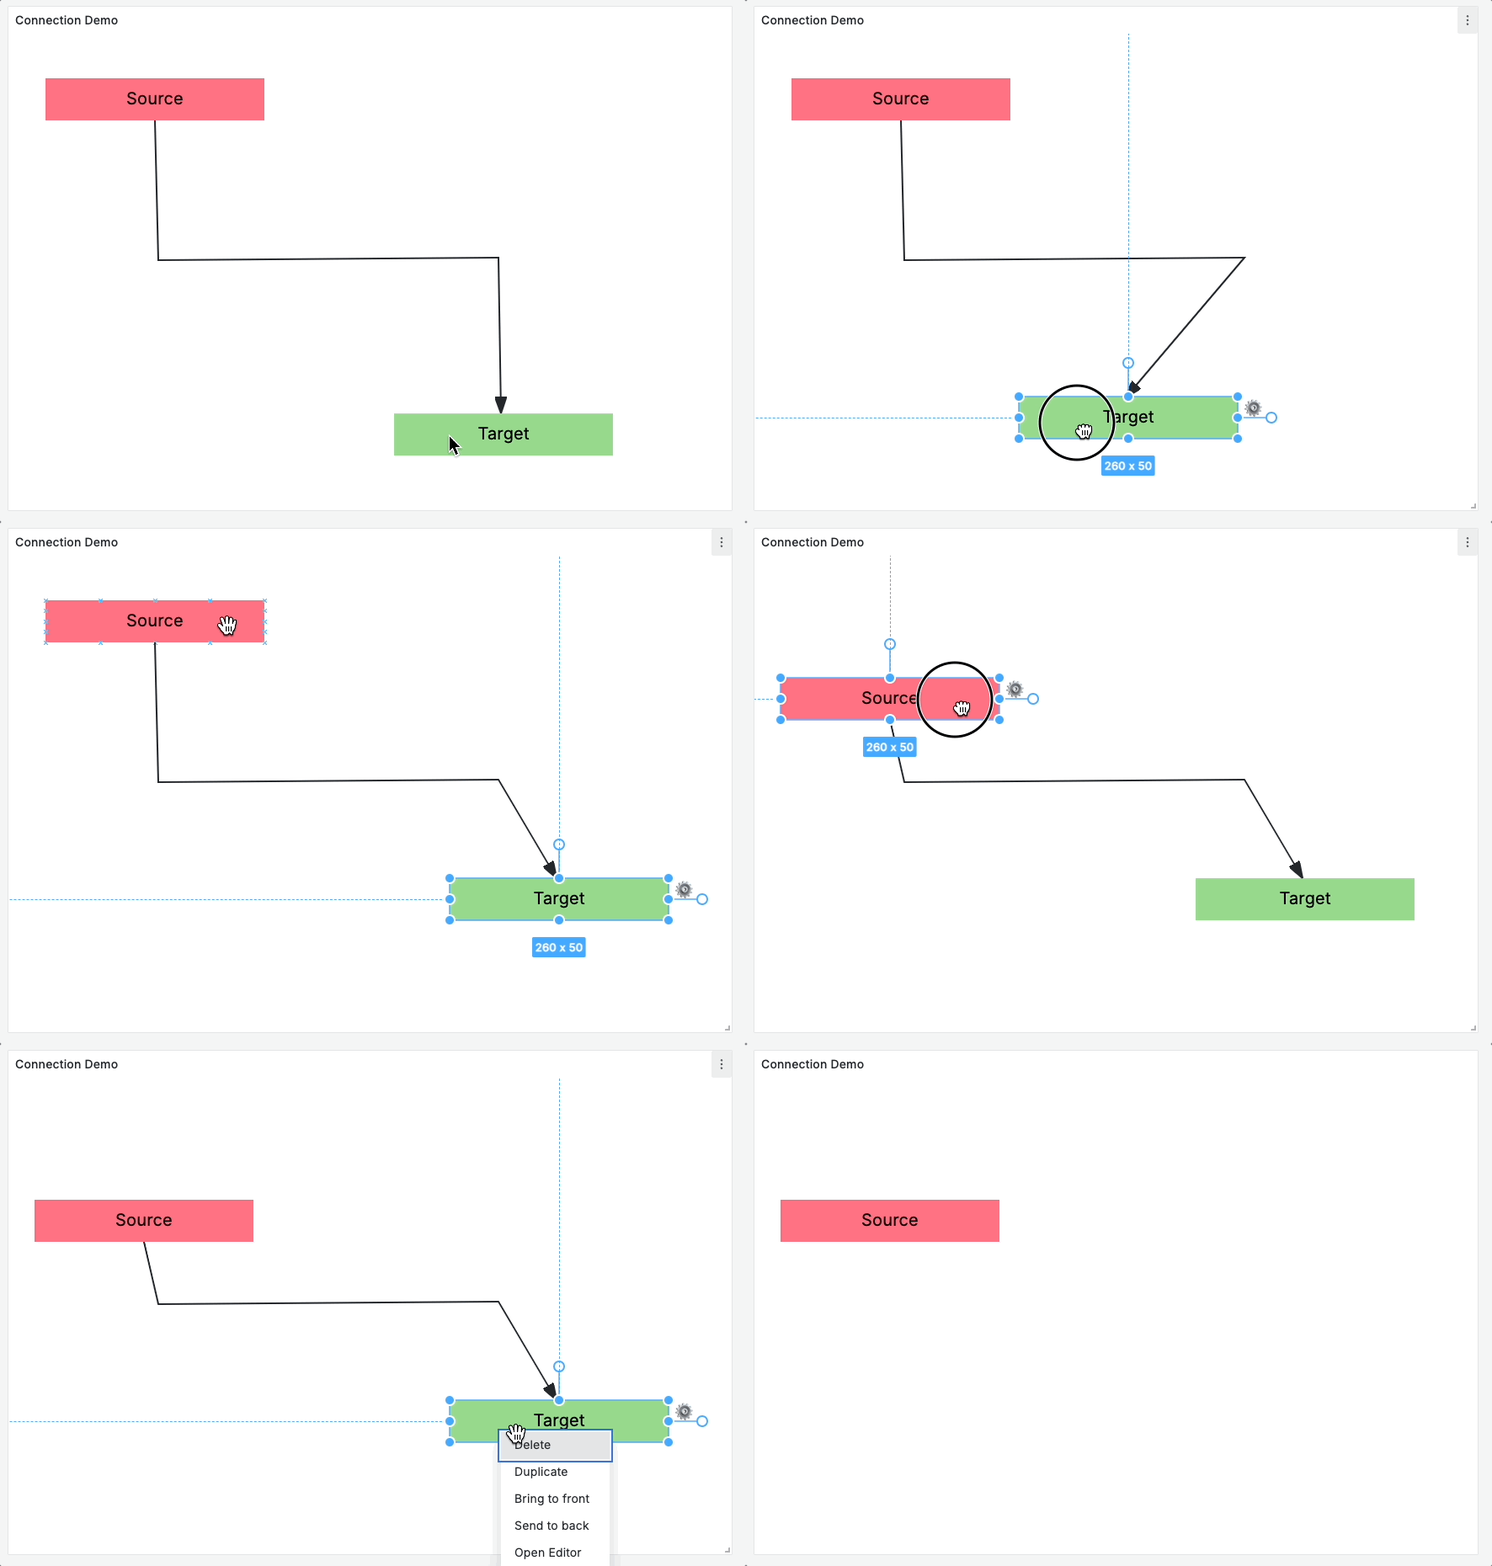
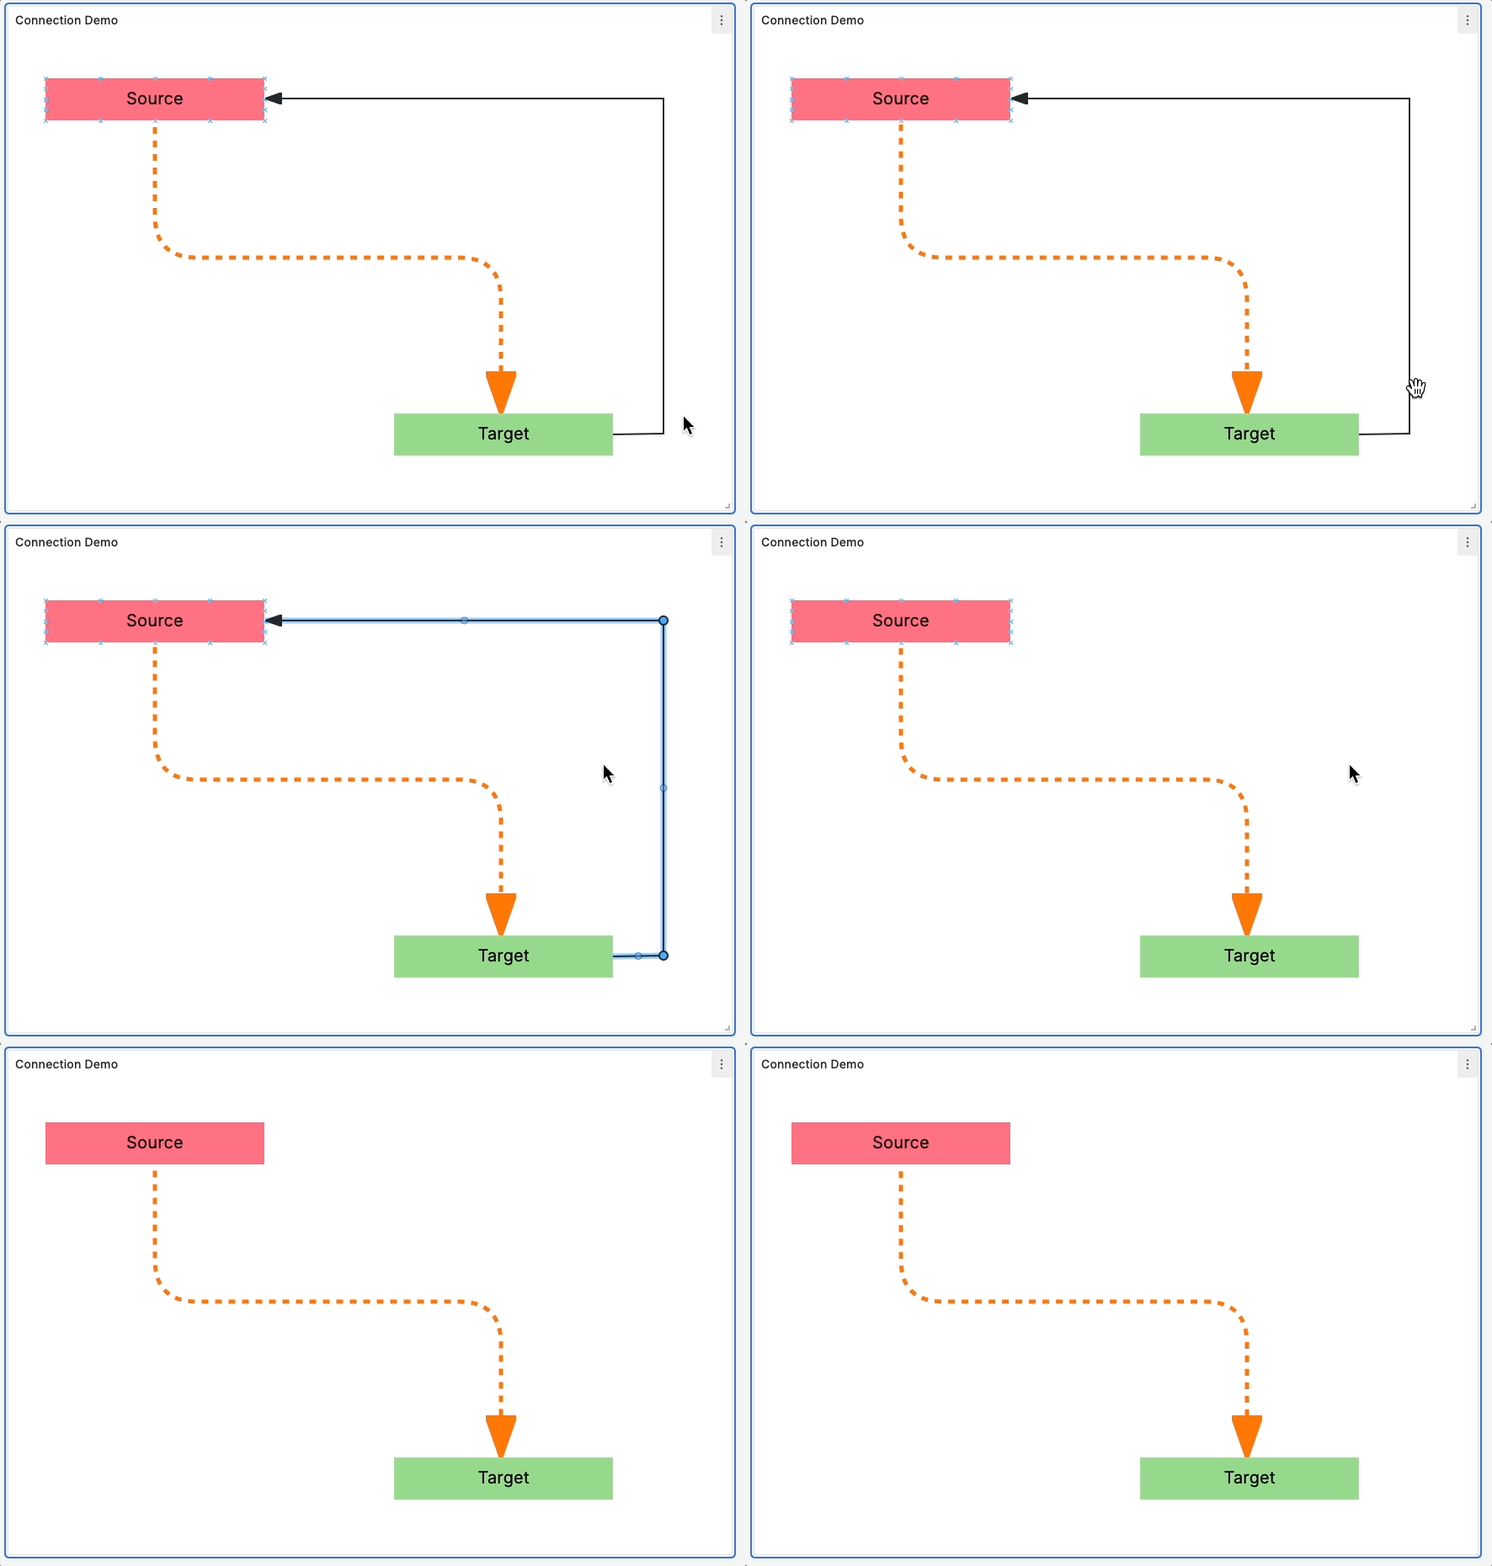
You can customize the color, size, and corner radius of your connections and even tie this styling to your data. This can be especially useful for calling out a problematic connection! You can also specify the arrow direction, line style (solid, dashed, dotted), and even animate your connections to help visualize flow.
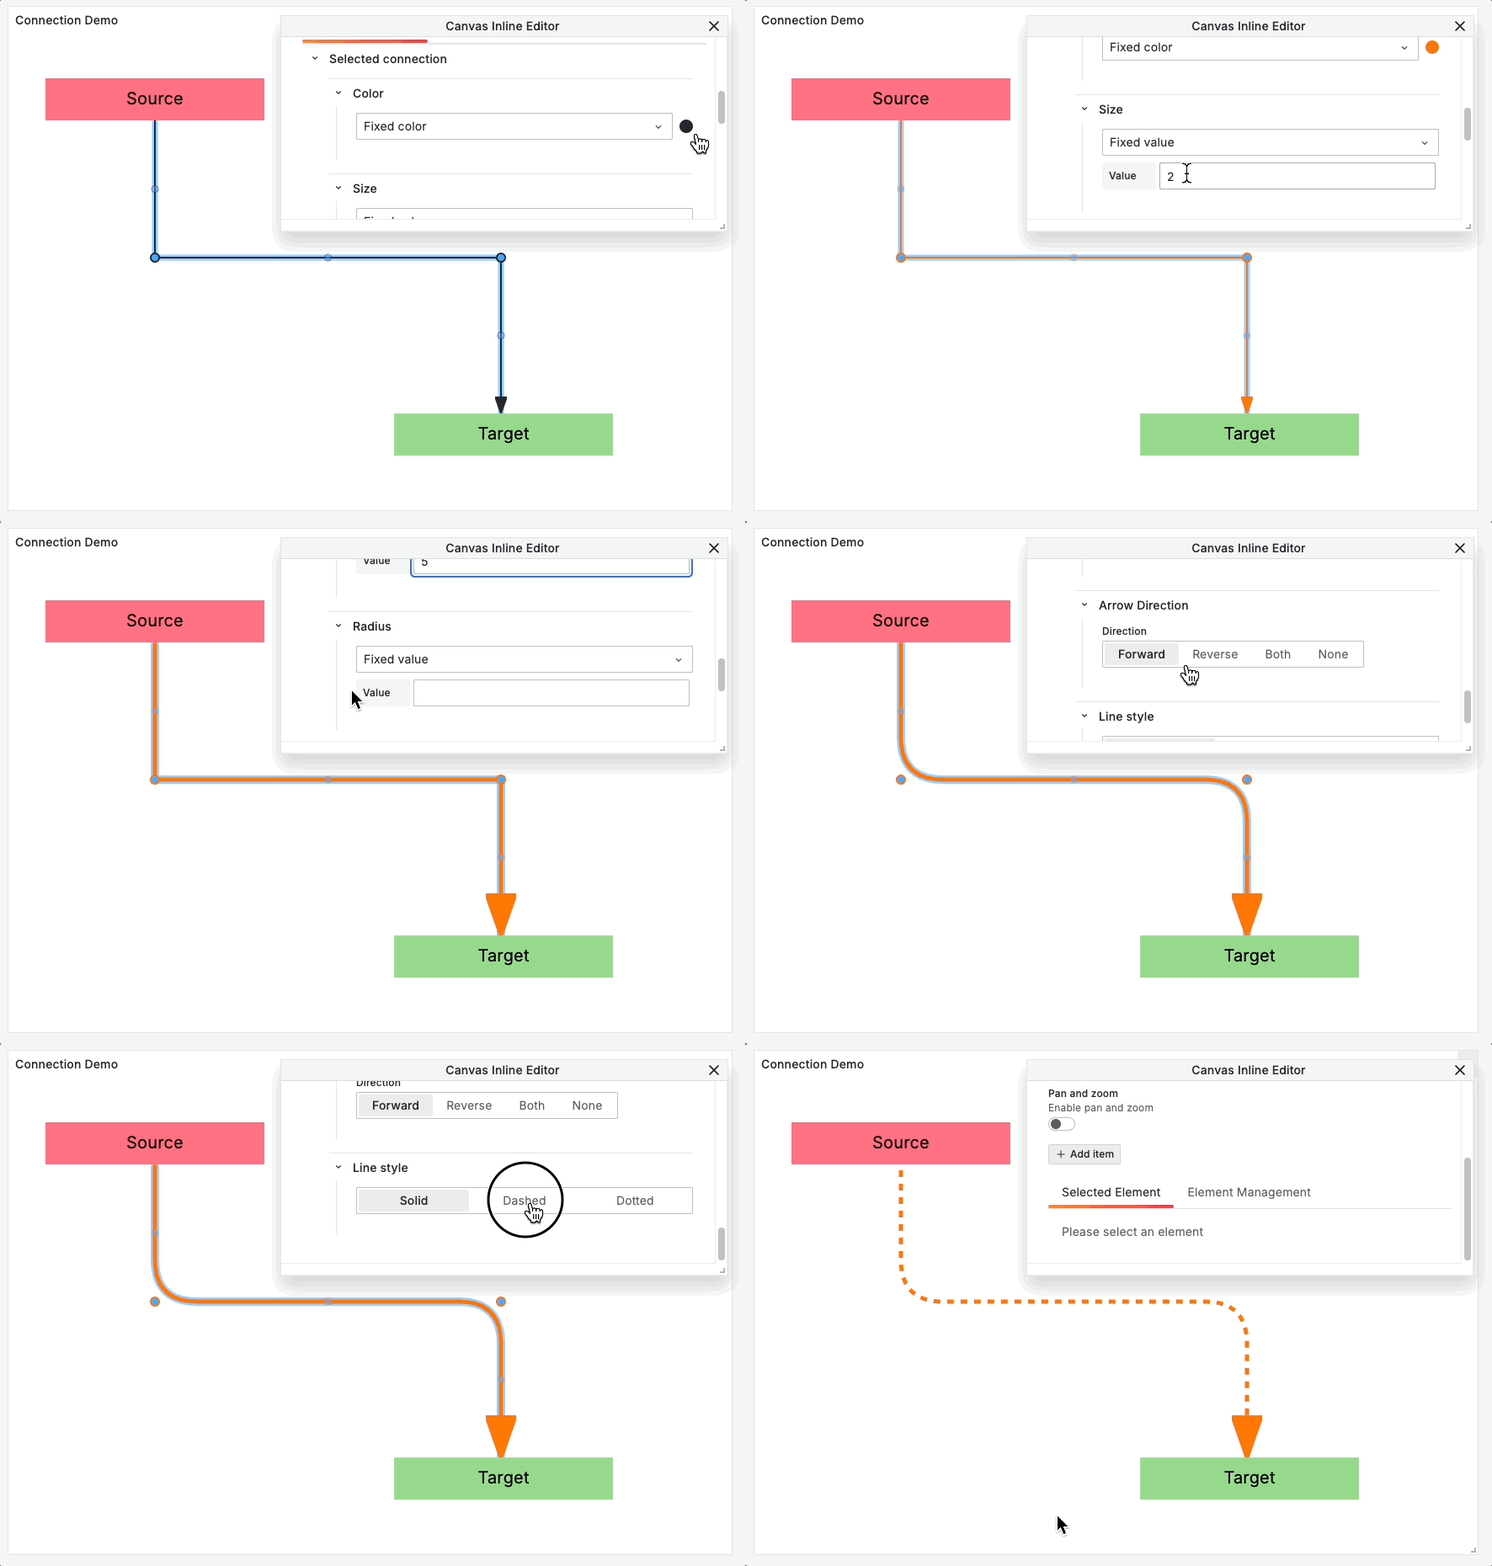
To remove a connection, simply click on the connection directly and then press the Delete or Backspace key.
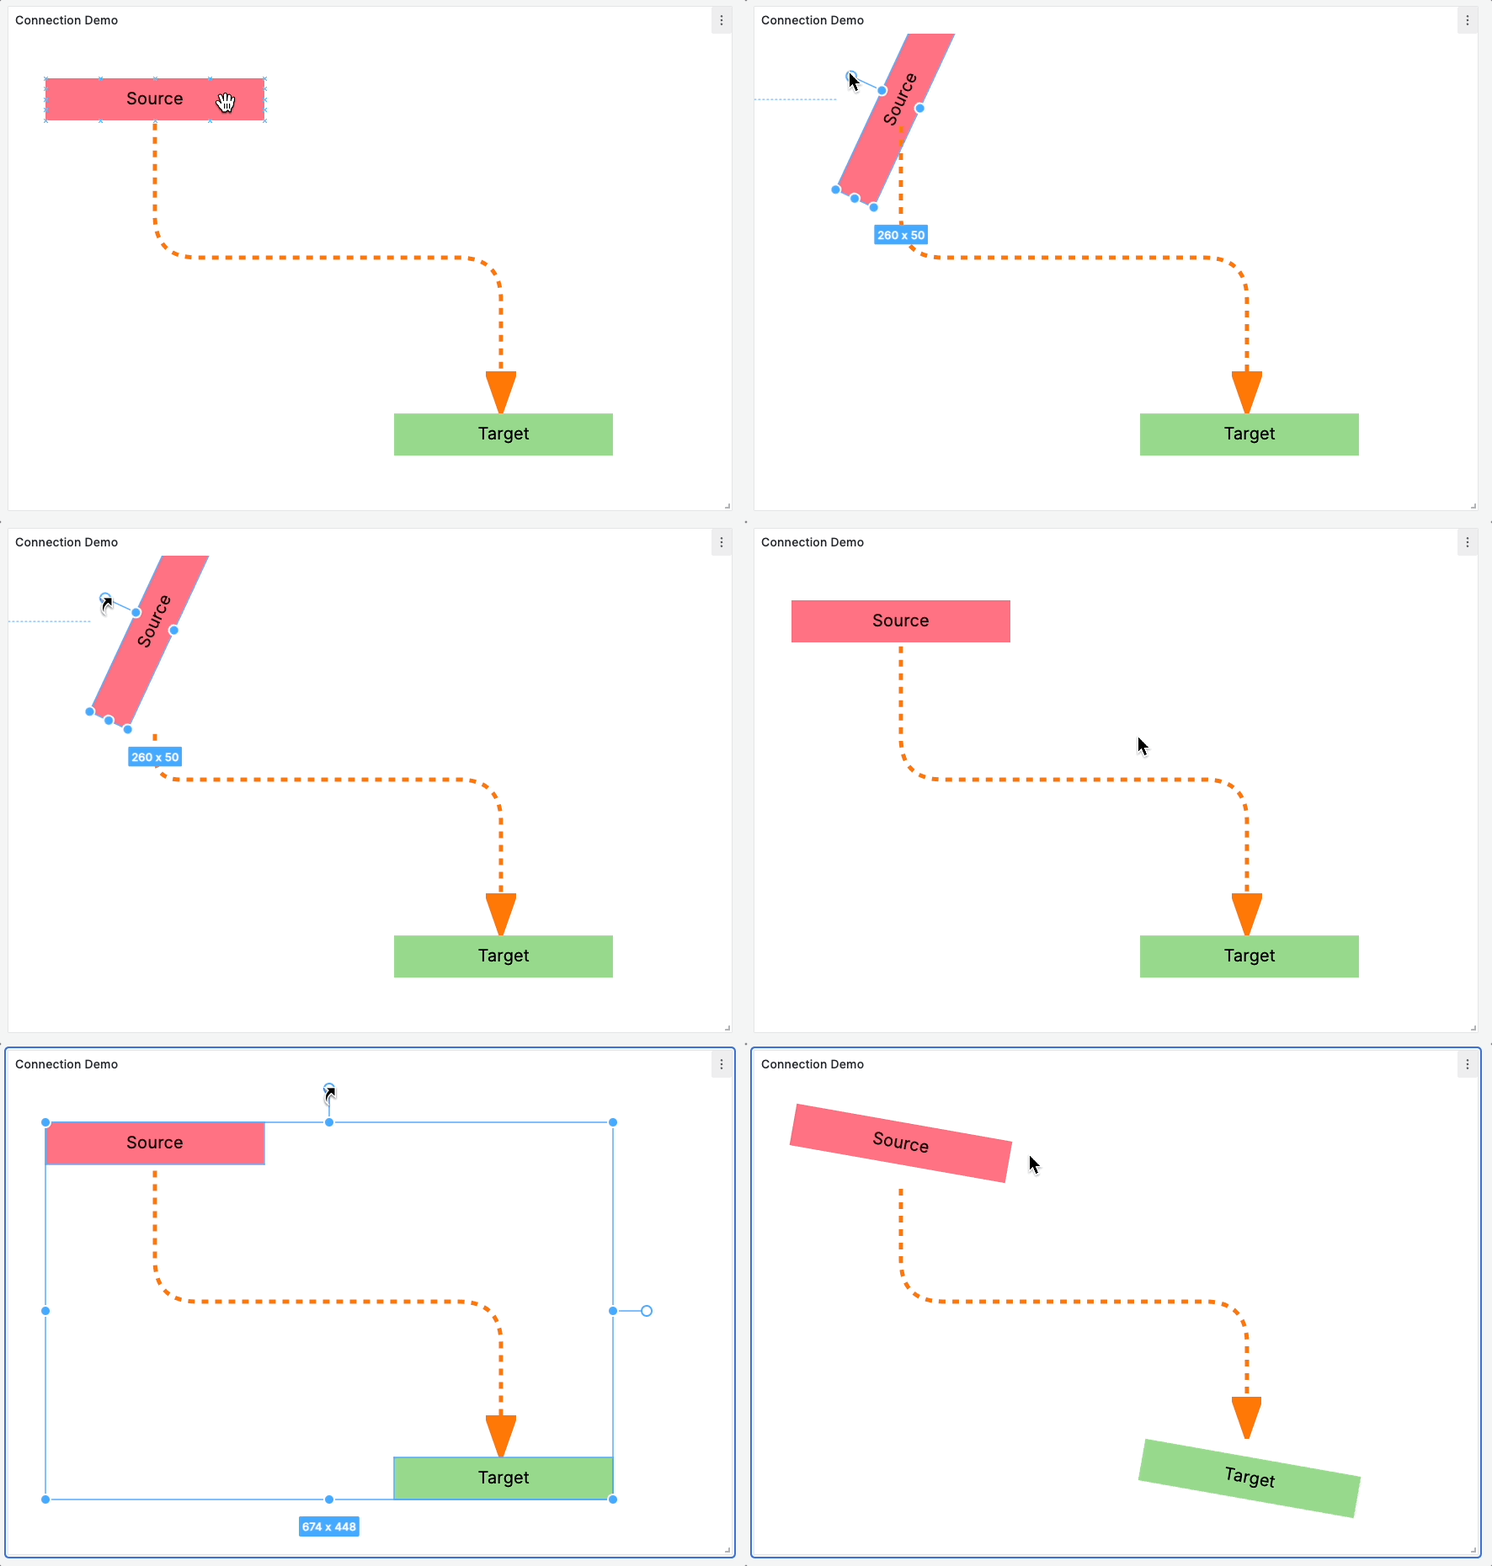
To rotate an element, first select it, then click and drag the rotation control. To rotate multiple elements simultaneously, hold Shift while selecting to reveal the group rotation controls.
Note: Although rotation will affect an element’s anchor points, it should not impact the overall shape of your connections. With this in mind, you may need to redraw your connection to capture the desired result.
Our goal with Canvas panel flowcharting is to empower you to visualize, understand, and have better control over your complex system. You should be able to lay it out rapidly and in a user-friendly fashion, without having to worry about the often fragile, nitty-gritty details. Leave those to us!
I invite you to dive into the source code behind Canvas connections if you’d like to learn more about the details behind the scenes.
Create interactive buttons
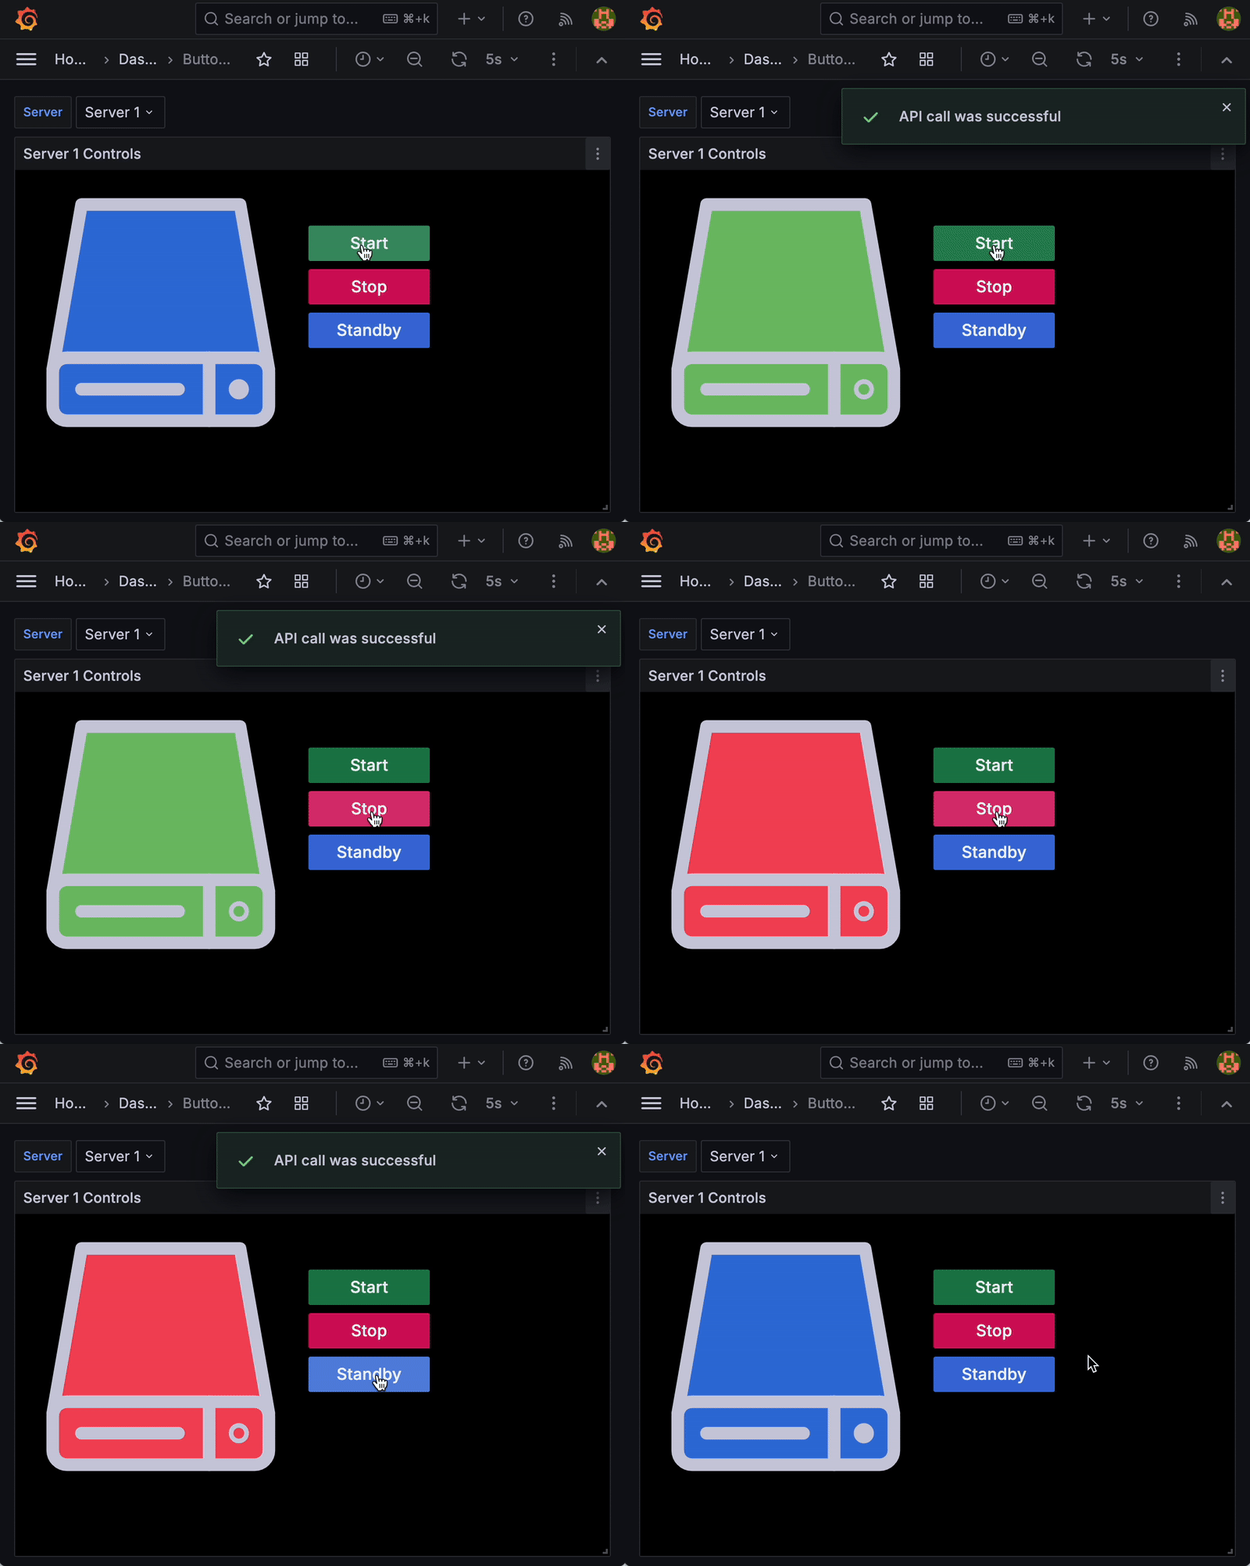
You can now add interactive buttons to your canvas panel. Buttons can be configured to call an API endpoint. This pushes Grafana’s capabilities to new heights, allowing you to create interactive dashboards that can be used to control external systems.
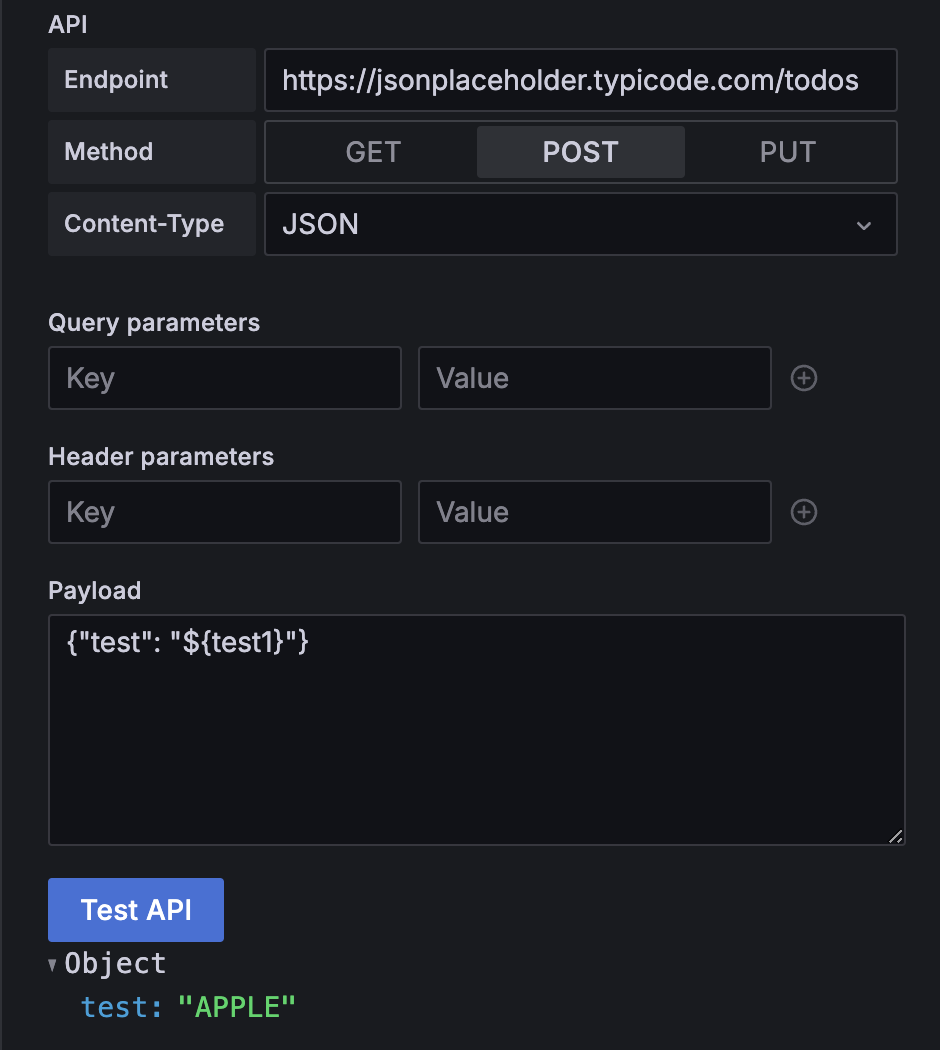
You can configure canvas buttons with basic, unauthenticated HTTP requests such as GET, POST, and PUT and support a variety of payload content types including JSON, text, JavaScript, and more. The API editor is also fully compatible with dashboard variables so you can provide greater context when configuring your API’s endpoint, query params, header params, and payload!
The canvas button transforms Grafana into a bidirectional monitoring solution, and we are excited to see how the community adopts it. So far we’ve seen users writing data to their InfluxDB and experimenting with managing their IT infrastructure without ever needing to leave Grafana.
Ease of use improvements
Pan + zoom
For particularly large canvases, you can enable the pan and zoom feature toggle to navigate your designs seamlessly.
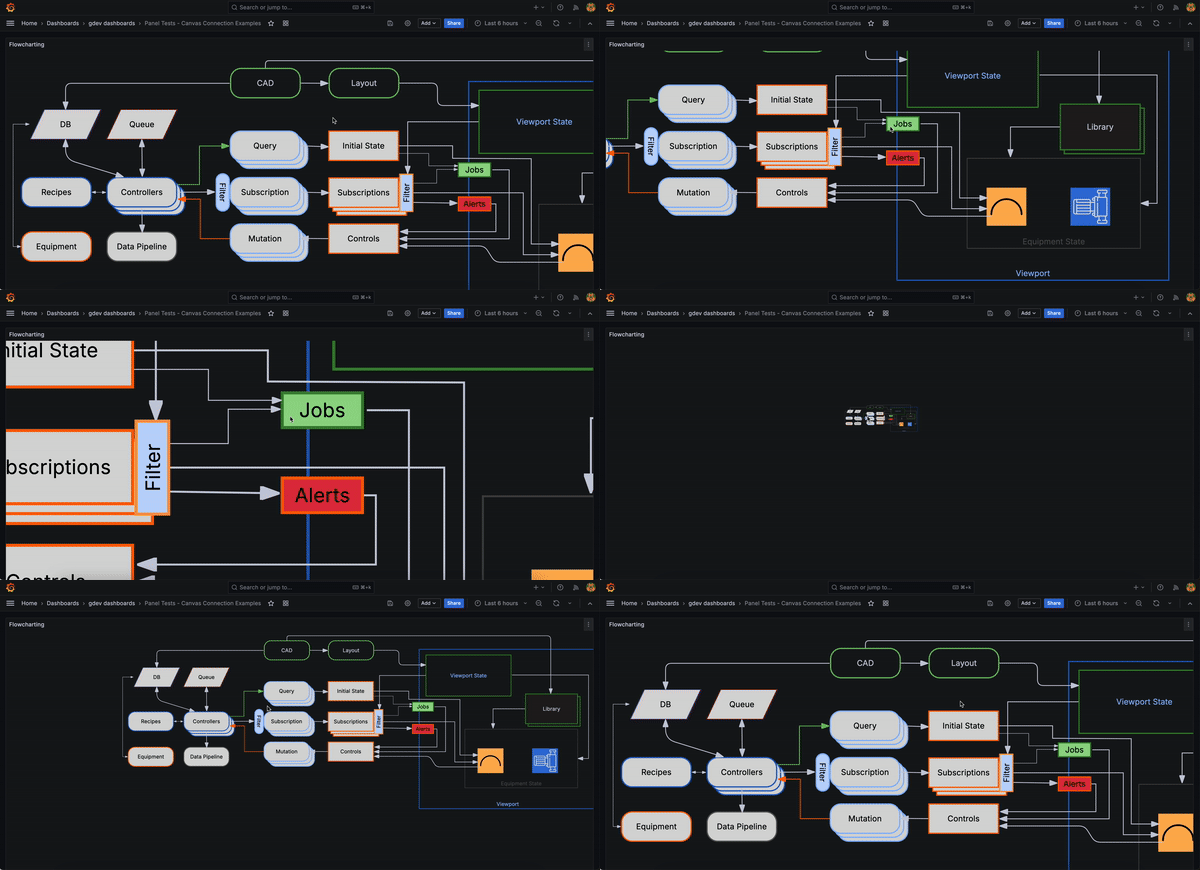
To enable this feature, you must first enable the canvasPanelPanZoom feature toggle. Once the feature toggle is enabled, you can toggle both the Pan and zoom and Infinite panning canvas editor options on to test them out. The feature is in public preview and we welcome any feedback.

Snapping and alignment
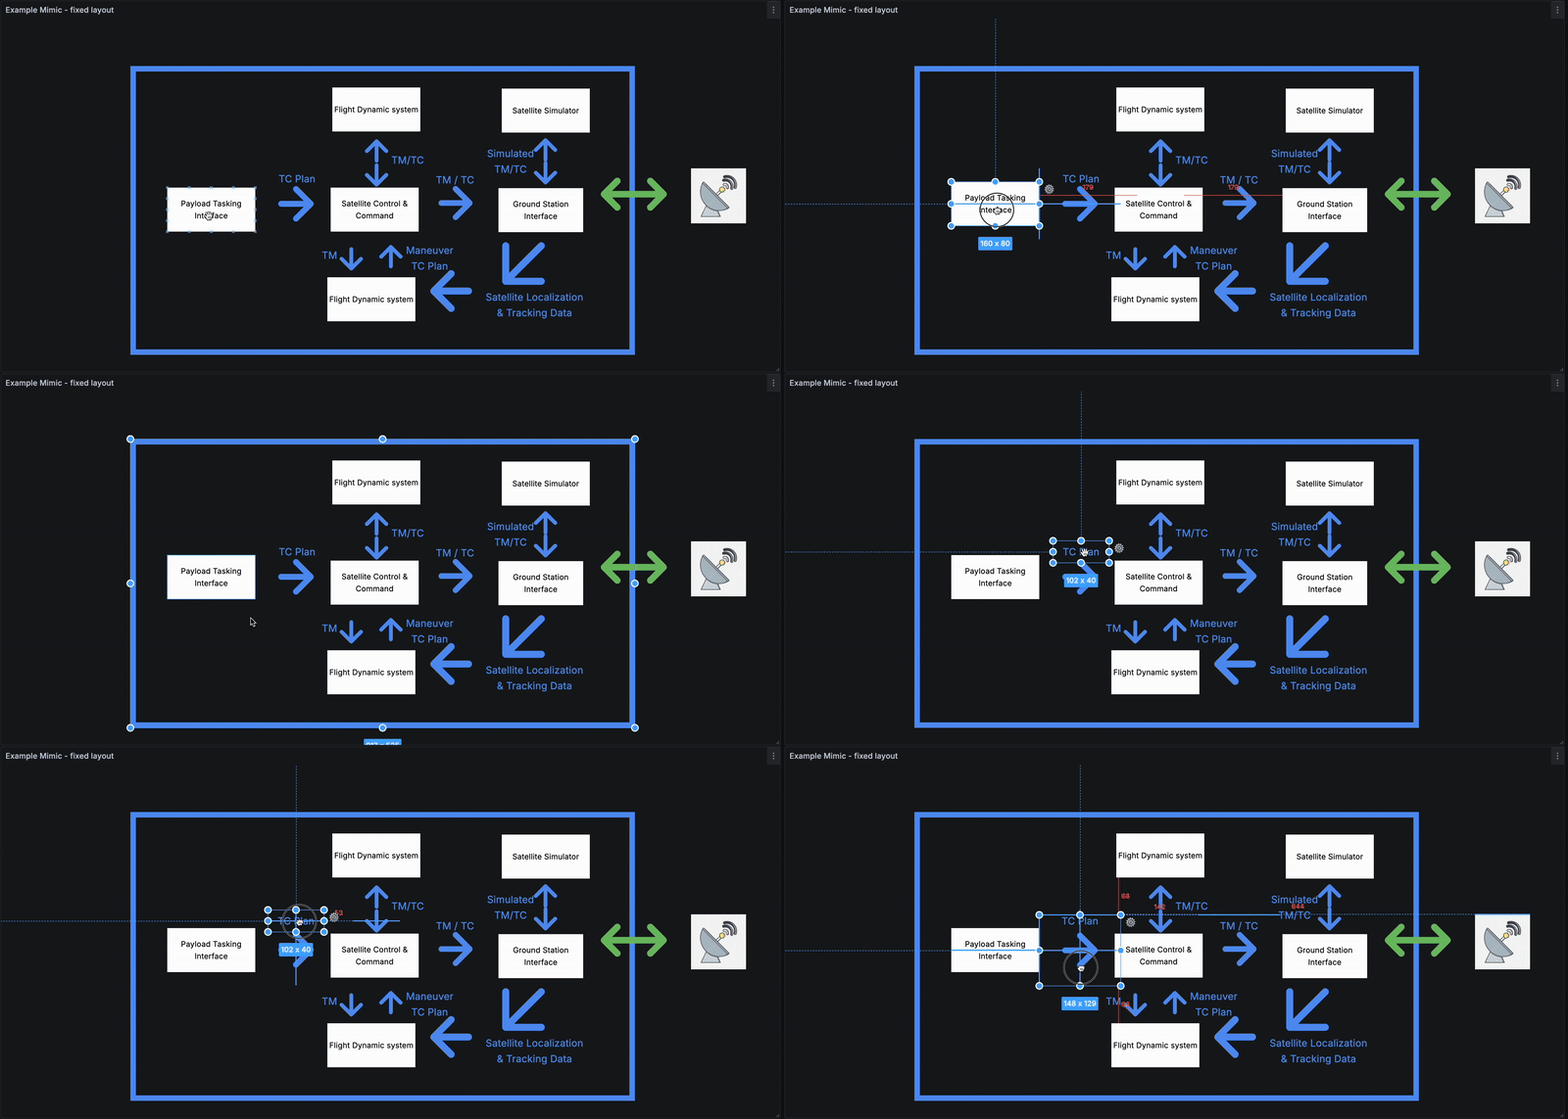
In the past, precisely placing an element or group of elements relative to the rest of the canvas was not very easy. Now you can effortlessly snap and align an element or group of elements on canvas.
Expanded data link support
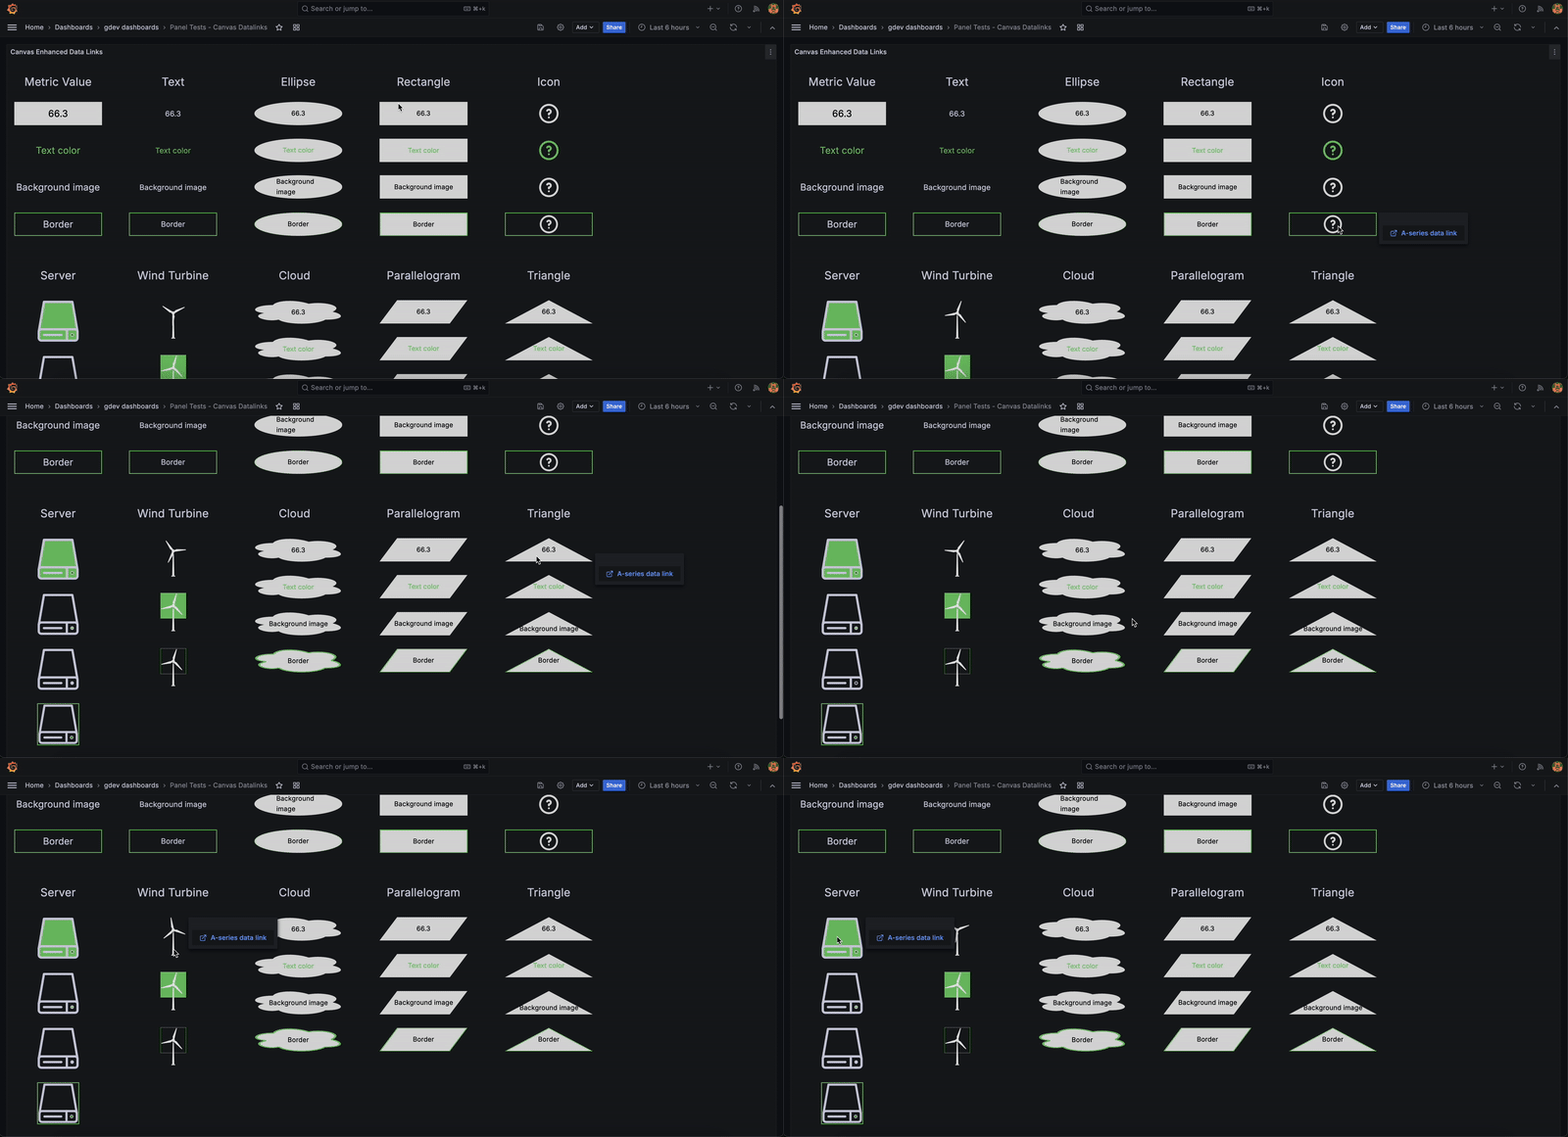
In the Canvas panel, more elements than ever before now support data links. Before support was limited to only the text and metric value elements. Now, virtually all elements support data links. Data links enable you to link other dashboards and external resources and include the current dashboard’s context in the form of template variables and data. To learn how to set up data links in your canvas, see our Canvas panel documentation.
Get started with the Canvas panel in Grafana
Want to check out the Canvas panel in Grafana today? You can explore everything outlined in this blog with this demo dashboard on play.grafana.org.
By bringing all of these exciting updates together, the Canvas panel is growing into a powerful, versatile visualization tool in Grafana that enables you to tie your data to a custom visualization for your exact use case.
Learn more about Grafana 11
Grafana 11 is generally available and includes a host of new features that makes Grafana easier to use, operate, and extend. Learn more about what’s new, including:
- How to explore metrics without writing any PromQL
- 10 ways to get more out of your data with transformations
- The latest tools in Grafana Alerting for faster incident response
To see all the latest features in action, watch our “Grafana 11 Deep Dive” session from GrafanaCON 2024, available on demand now.
For an in-depth list of all the new features in Grafana 11, check out our Grafana documentation, the Grafana changelog, or our What’s New documentation.
Upgrade to Grafana 11
Download Grafana 11 today or experience all the new features by signing up for Grafana Cloud, which offers an actually useful Cloud Free tier and plans for every use case. Sign up for a free Grafana Cloud account today.
Our Grafana upgrade guide also provides step-by-step instructions for those looking to upgrade from an earlier version to ensure a smooth transition.
Join the Grafana Labs community
We welcome any feedback you have on Canvas and look forward to partnering with the community on future development. Interested in learning about the origins of Canvas? Check out our original Canvas panel blog post.
We also invite you to engage with the Grafana Labs community forums. Share your experiences with the new features, discuss best practices, and explore creative ways to integrate these updates into your workflows.
A special thanks to our community
We extend our heartfelt gratitude to the Grafana community!
Your contributions, ranging from pull requests to valuable feedback, are crucial in continually enhancing Grafana. And your enthusiasm and dedication inspire us at Grafana Labs to persistently innovate and elevate the Grafana platform.
Grafana Cloud is the easiest way to get started with metrics, logs, traces, dashboards, and more. We have a generous forever-free tier and plans for every use case. Sign up for free now!


