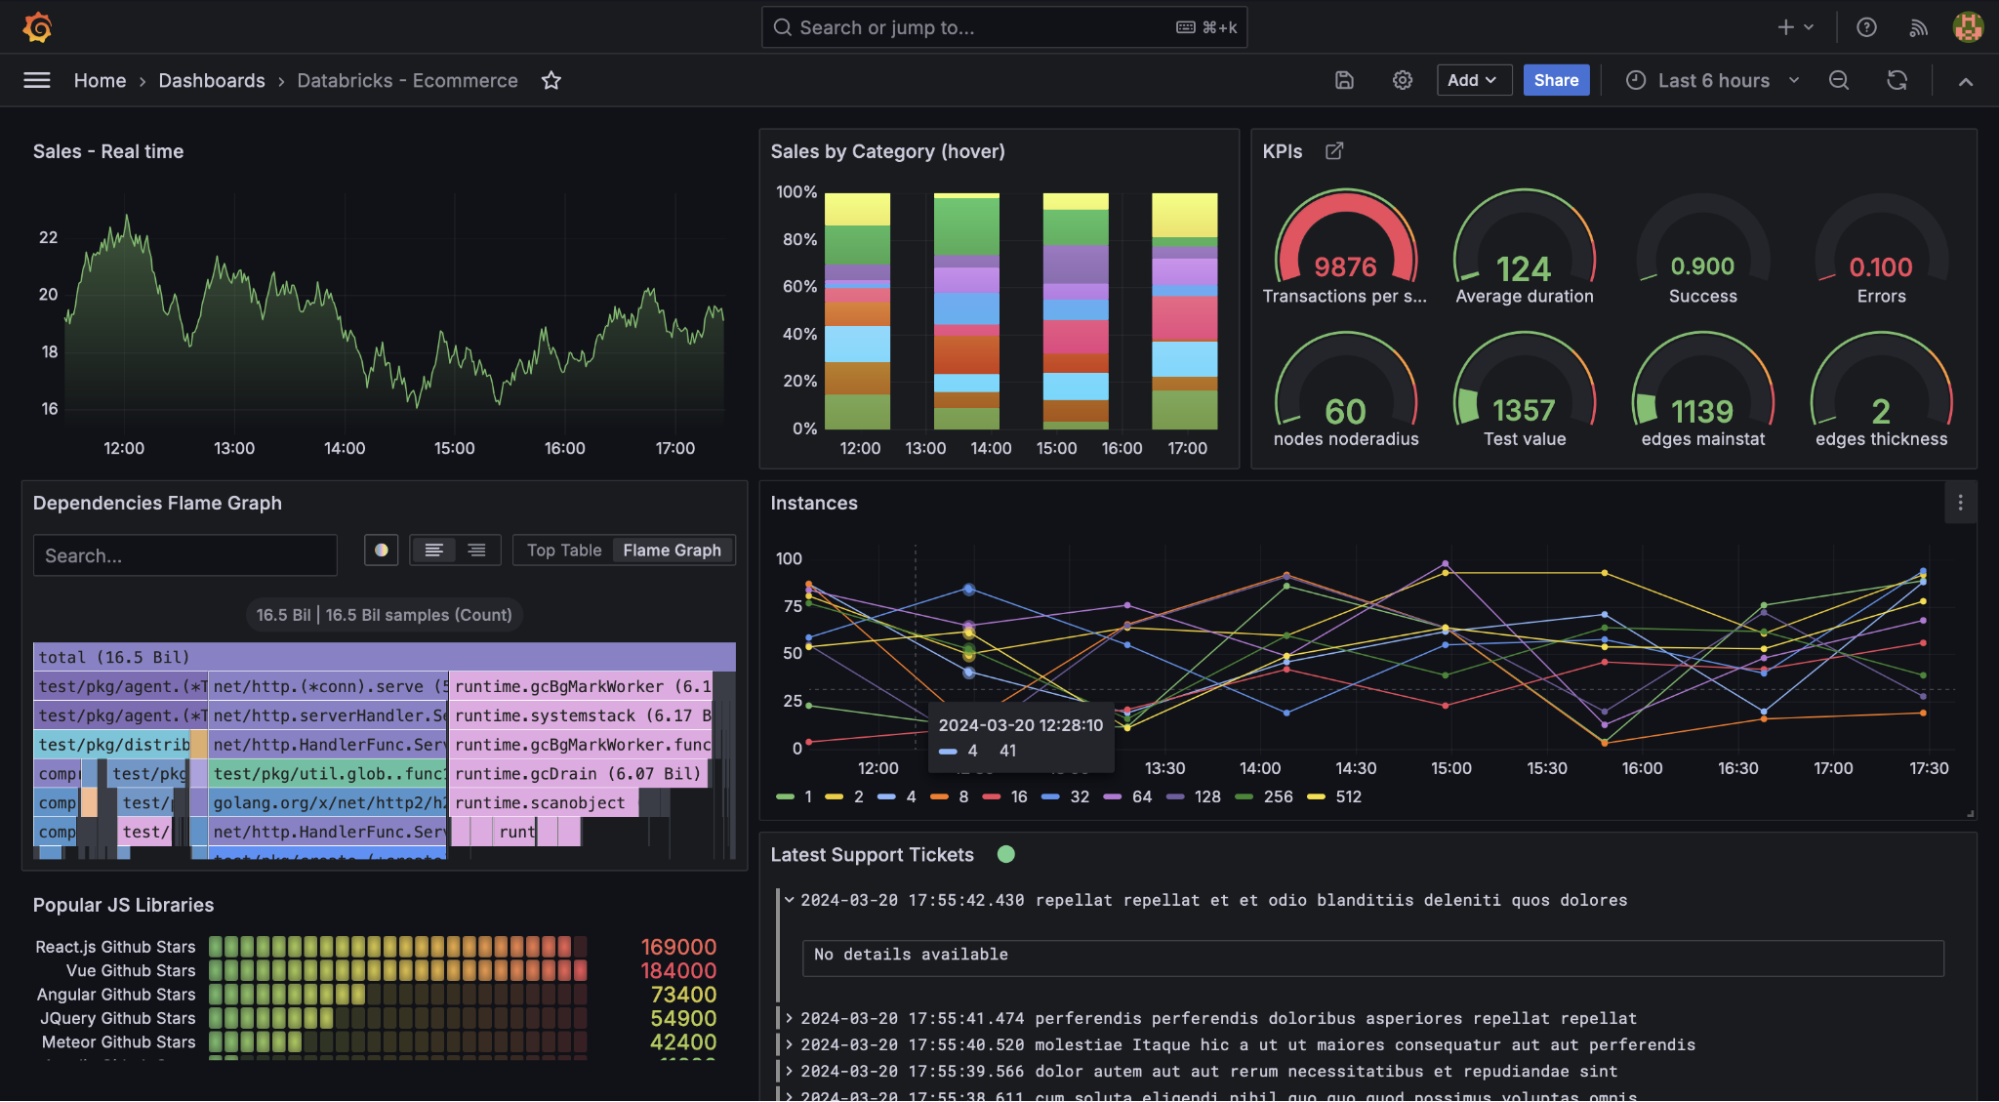
Grafana Enterprise data source plugins: A brief guide to what they are and how to get started
One of the most powerful features of Grafana is the ability to unify and derive value from your data, regardless of where that data lives. This is because we’re fully committed to making Grafana an open, composable, and extensible observability platform for our more than 20 million users worldwide.
But how exactly do we deliver on that promise of openness and extensibility? Grafana data source plugins play a big role.
Data source plugins allow you to connect to external systems from within Grafana, so you can visualize data from a wide range of sources using the Grafana dashboards you already know and love. Being able to view all your metrics, logs, and traces in a centralized location — without having to ingest or migrate the data to a common backend — means you can correlate your data, quickly identify root causes, and reduce MTTR.
We have a broad ecosystem of Grafana data source plugins — which is great news for our community, but can also prompt some questions around which types of plugins to use. In this blog post, we’re going to specifically explore Grafana Enterprise data source plugins, including what they are, how pricing works, and more, so you can start using them today.
What is a Grafana Enterprise data source plugin?
There are over 150 data sources in our catalog. Many are created by our community members, many by our partners, and over 60 are built and maintained by Grafana Labs. Most of these data sources are freely available for use in Grafana OSS.
Grafana Enterprise data sources are built and maintained by Grafana Labs and are only available in Grafana Enterprise and Grafana Cloud, including in our generous free-forever tier. These data sources typically connect to proprietary tools or platforms, such as Splunk, Dynatrace, or Databricks.

Enterprise data sources offer a best-in-class end-user experience — including point-and-click query building and data filtering — that allows you to get the exact data you’re looking for faster than ever. They enhance your overall observability strategy by letting you query, visualize, and alert on hundreds of disparate data sources through a single pane of glass. For example, you could correlate infrastructure health metrics from Datadog, logs from Splunk, application performance data from Dynatrace, and even incident tickets from ServiceNow to streamline your troubleshooting processes.
Plus, because all Grafana Enterprise data source plugins are maintained and supported by the Grafana Labs team, they eliminate the overhead of building and maintaining your own plugins in-house.
Which Enterprise data source plugins are currently available?
Grafana Labs currently offers more than 20 Enterprise data sources — and we’re constantly working to expand our line-up so you can connect to and visualize all your go-to data sources.
Our current list of Enterprise data source plugins includes:
- AppDynamics
- Databricks
- Datadog
- Dynatrace
- MongoDB
- New Relic
- Oracle
- SAP HANA
- ServiceNow
- Snowflake
- Splunk
- Wavefront
… plus many more. To see the full list of Grafana Enterprise data sources, check out our plugins page.
How much do Grafana Enterprise plugins cost?
As mentioned earlier, Grafana Enterprise plugins are available to users of both Grafana Enterprise and Grafana Cloud.
Grafana Enterprise users get access to all Enterprise plugins as part of their Grafana Enterprise license. To learn more about Grafana Enterprise pricing and licensing models, please reach out to our team.
For Grafana Cloud, Enterprise plugin access and pricing varies by tier:
- Cloud Free Forever tier: Access to Enterprise plugins is included, at no cost, for 3 active users.
- Cloud Pro Pay as you Go tier: Enterprise plugins are treated as a paid add-on in Cloud Pro. If you enable Enterprise plugins in Cloud Pro, you still get access to Enterprise plugins for up to 3 active users at no cost, and then, beyond that, it’s $55 per active user per month.
- Cloud Advanced tier: Access to Enterprise plugins is included for up to 5 active users. Then, it’s $55 per additional user.
Please refer to our pricing page for the latest plan and pricing details.
Again, all Enterprise data source plugins are built, maintained, and supported by the Grafana Labs team — which means the TCO is significantly lower compared to building and managing your own plugins in-house.
What should I expect in terms of installation and configuration?
It’s really easy to get up and running with Grafana Enterprise data sources.
In fact, on a Grafana Cloud instance, it’s a one-click install and you’re good to go. Once the plugin is installed, you configure it as a data source by going to Connections > Data sources > Add data source. Then, select the specific Enterprise plugin you want to connect to and follow the rest of the steps, including for authentication, on the plugin’s configuration page.
Once you’ve completed all required fields and steps, you can save and test your new data source. A message will appear to verify that you have connected successfully.
For more details, you can reference the documentation for the specific plugin you’re installing.
Where can I go to learn more?
We have several resources you can use to learn more about Grafana Enterprise data source plugins, including our technical docs and this webinar led by Christine Wang and Aengus Rooney from the Grafana Labs Solutions Engineering team.
The easiest way to get started with our Enterprise data source plugins is in Grafana Cloud. We have a generous forever-free tier that includes access to Enterprise data sources for 3 active users. If you haven’t already, sign up for free today!


