Use Grafana Alloy to collect Azure metrics with less hassle
Are you using the Azure metrics exporter to ship telemetry data to Grafana Cloud? Are you overwhelmed with the amount of configuration and complexity necessary to avoid being rate limited?
Well, did you know that with Grafana Alloy, our distribution of the OpenTelemetry Collector with built-in Prometheus pipelines and support for metrics, logs, traces, and profiles, you can now:
- Collect your Microsoft Azure metrics at the subscription level
- Configure all the dimensions you need in a single configuration
Let’s look at how these two features can reduce the complexity of your Alloy configuration.
Subscription-level metrics
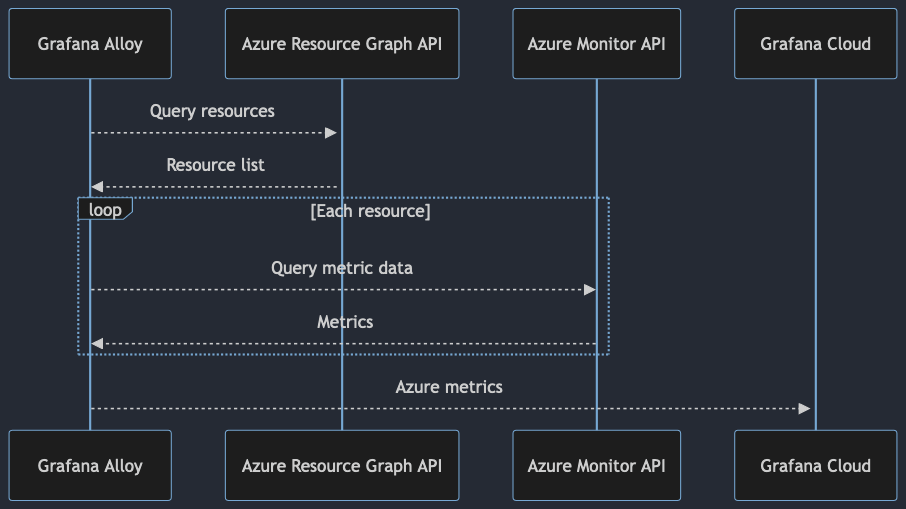
Azure makes various APIs available for gathering metrics. Before subscription-level metrics, Alloy collected metrics from Azure resource-by-resource, with this workflow:

This approach had a few downsides:
- The amount of resources in your Azure subscription dramatically increased the amount of time it took to collect the metric data.
- The rate limit on Azure’s Monitor API is not very high, which made it very easy to encounter errors that block you from collecting all your metric data.
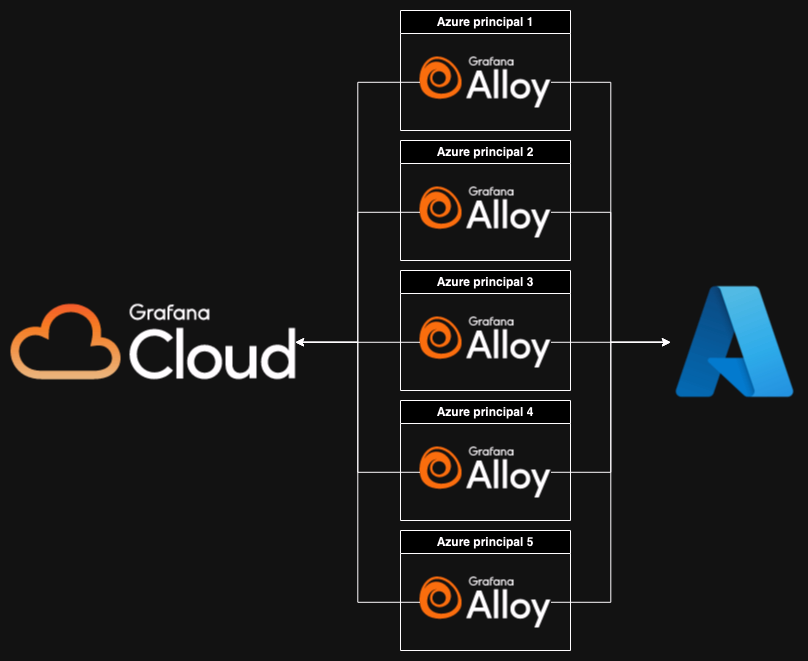
There were workarounds to these problems that involved running multiple Alloy deployments that used different service principals, each of which got its own resource limit. It would end up looking something like this:

As a result, you had to manage many independent Alloy deployments that cannot take advantage of Alloy clustering.
Clustering enables a fleet of Alloy deployments to work together to ensure high availability. This creates a horizontally scalable system with minimal resource and operational overhead, ensuring your mission critical Azure metrics will always be available for you.
Using the subscription-level metrics feature, you can collect data from all relevant resources in a region with a single API call. This lets you run a single or clustered Alloy deployment and potentially reduce the amount of API calls from thousands down to less than 100.

Enabling this feature is as simple as changing your metric configuration:
- Remove
resource_graph_query_filterfrom your configurations if it exists. - Add a
regionskey containing all the regions you would like to pull for the configuration.
And that’s it!
Note: The exporter supports all metrics that can be collected by Azure Monitor, but the subscription-level metrics feature does not work with all Azure resource types. If a resource type is not supported, you can still use the default Azure Resource Graph to visualize your data. Please refer to the docs for more information.
All your dimensions in a single configuration
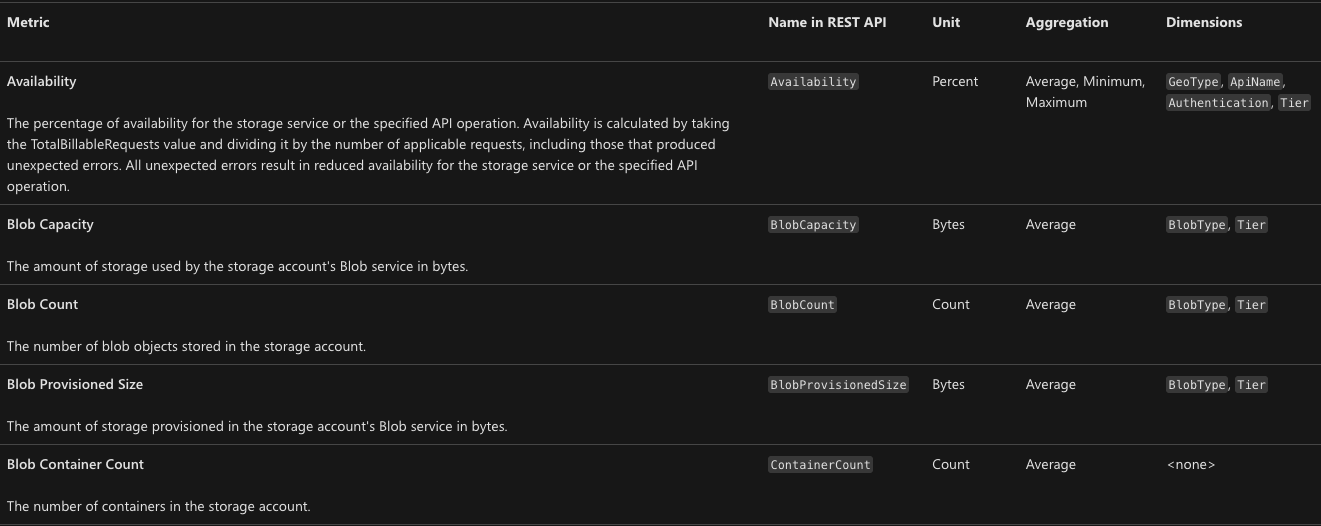
Azure services expose their metrics with a set of dimensions. The set of dimensions might be different for each metric. If we look at an example for Azure Blob Storage metrics, we can see the metrics do not have an overlapping dimension set.

If you wanted to collect all of these metrics, including dimensions, it would require three separate configurations, each with different dimensions. This is incredibly complicated to manage and each extra configuration you add results in even more API calls, which increases the likelihood of being rate limited. But now you can do it all in a single configuration. Doing so will take you from this:
prometheus.exporter.azure "integrations_azure_exporter_1" {
    subscriptions = ["asdf1234"]
    resource_type = "Microsoft.Storage/storageAccounts/blobServices"
    resource_graph_query_filter = "where location == \"westeurope\""
    metrics = [
        "Availability",
    ]
    included_dimensions = [
"ApiName",
"Authentication",
"GeoType",
"Tier",
    ]
    timespan = "PT1H"
}

prometheus.exporter.azure "integrations_azure_exporter_2" {
    subscriptions = ["asdf1234"]
    resource_type = "Microsoft.Storage/storageAccounts/blobServices"
    resource_graph_query_filter = "where location == \"westeurope\""
    metrics = [
        "BlobCapacity",
        "BlobCount",
        "BlobProvisionedSize",
    ]
    included_dimensions = [
        "BlobType",
        "Tier",
    ]
    timespan = "PT1H"
}

prometheus.exporter.azure "integrations_azure_exporter_3" {
    subscriptions = ["asdf1234"]
    resource_type = "Microsoft.Storage/storageAccounts/blobServices"
    resource_graph_query_filter = "where location == \"westeurope\""
    metrics = [
        "ContainerCount",
    ]
    timespan = "PT1H"
}
To this:
prometheus.exporter.azure "integrations_azure_exporter" {
    subscriptions = ["asdf1234"]
    resource_type = "Microsoft.Storage/storageAccounts/blobServices"
    regions = [
        "westeurope"
    ]
    metrics = [
        "Availability",
        "BlobCapacity",
        "BlobCount",
        "BlobProvisionedSize",
        "ContainerCount",
    ]
    included_dimensions = [
        "ApiName",
        "Authentication",
        "BlobType",
        "GeoType",
        "Tier",
    ]
    timespan = "PT1H"
}
Here to help, now and into the future
Regardless of what phase of the observability journey you are on, Grafana Labs is here to help you. These new features available in Alloy should enable a significant reduction in complexity related to observing your workloads running on Azure.
Don’t hesitate to put in a support ticket or contact your Grafana Labs representative if you have any questions or feature requests. We would love to hear from you as this is just one part of our plan to help solve your Azure observability needs, so stay tuned for what’s to come later this year!
Grafana Cloud is the easiest way to get started with metrics, logs, traces, dashboards, and more. We have a generous forever-free tier and plans for every use case. Sign up for free now!


