Find your logs data with Explore Logs: No LogQL required!
We are thrilled to announce the preview of Explore Logs, a new way to browse your logs without writing LogQL. In this post, we’ll cover why we built Explore Logs and we’ll dive deeper into some of its features, including at-a-glance breakdowns by label, detected fields, and our new pattern detection. At the end, we’ll tell you how you can try Explore Logs for yourself today.
But let’s start from the beginning — with good old LogQL.
We love LogQL
Grafana Loki, Grafana Labs’ open source log aggregation project, provides a powerful query language called LogQL. Site reliability engineers (SREs) and other Loki experts love to use it to filter logs for specific keywords, reduce noise by selecting specific labels, and perform other operations to get answers to understand their systems.
Metrics can be created from logs, which are put into dashboards to visualize key insights. Alerts can be set up and wired into Grafana Incident Response & Management (IRM), which includes Grafana OnCall and Grafana Incident, so you can make sure you get early warnings when things go wrong.
Those same queries can be used to power Grafana dashboard visualizations so you can make sense of your logs. LogQL is really powerful! There’s just one catch …
‘But I don’t know LogQL!’
If you aren’t digging into your logs every day, you might not have had a reason to learn LogQL. Perhaps you dive in now and again, or maybe only during an incident. And even in those moments, having to remember the details of a query language can slow down response times.
The point is, you come to your logs platform not because you love logs, but because you need logs to do your job. Whether you need them to see a deployment go smoothly, to investigate a latency issue, or to deal with a 4 a.m. page, the last thing you want to do is wrestle with yet another query language.
If only you could take advantage of all the great benefits Loki + Grafana provides, without needing to learn LogQL. Well, you guessed it: Now you can!
Introducing Explore Logs, a new OSS application
Explore Logs is our new OSS application that lets you browse your logs as if they were already neatly organized for you in advance. You can find the source code on GitHub, but before you head there to try it, allow us to give you a quick tour.

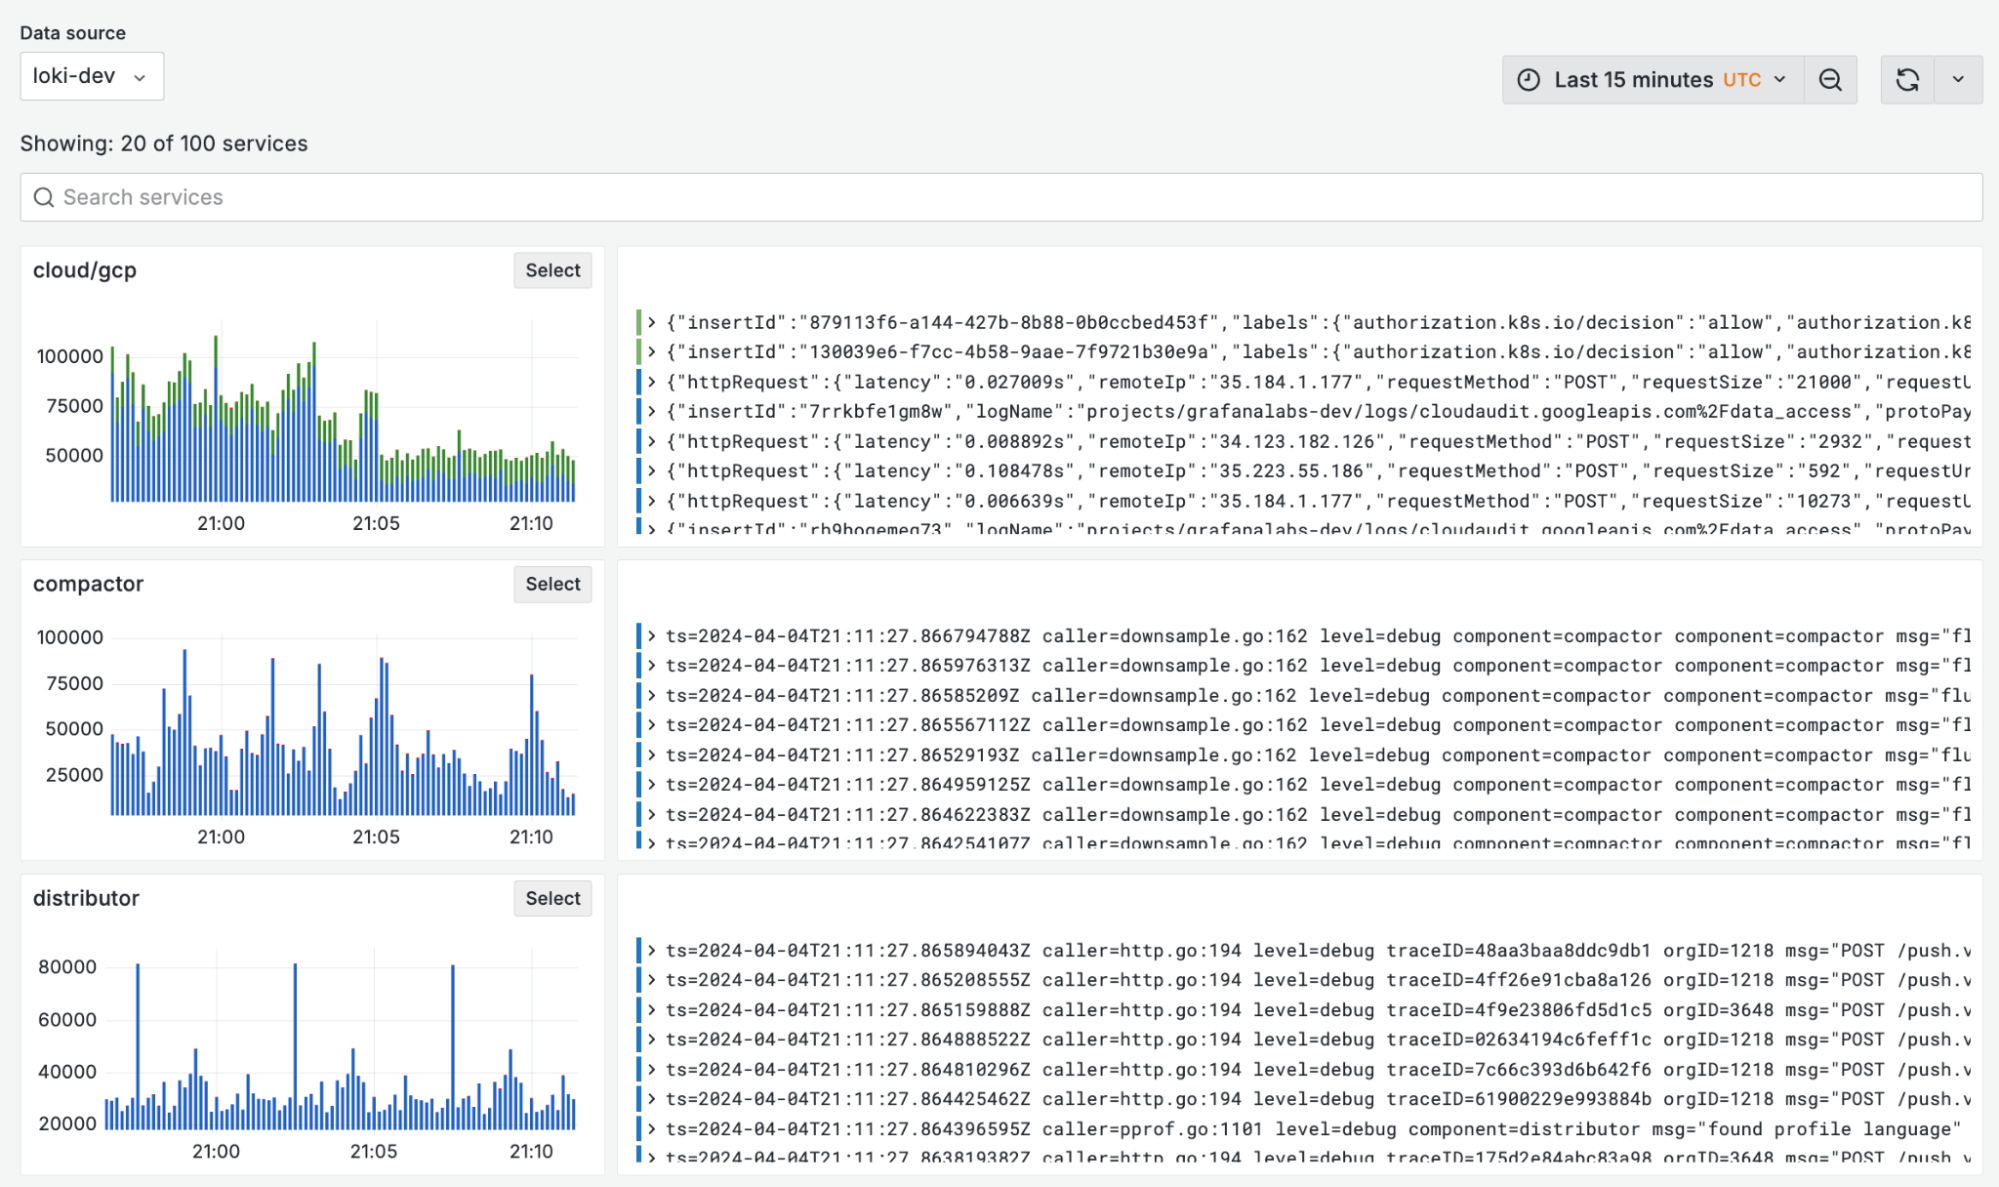
When you come into Explore Logs (in the navigation, head over to Explore > Logs), you are presented with a list of detected services or apps. Engineers no longer have to fight with teams across the organization to standardize on one convention. Instead, we embrace the chaos.
Services are presented along with their log volumes and a preview of recent log lines, so you can see, at a glance, which services are the most chatty and what kinds of logs they are emitting.

Don’t see the service you are looking for? Simply search for it with the search bar (plain text search, not LogQL).
As if automatic service detection wasn’t enough, things start to get really interesting when you select a service.
How to breakdown logs in a service
Explore Logs provides tools to further visualize and breakdown a service’s logs by labels, detected fields, and patterns, all while making sure the log lines themselves are always just a click away.
- Labels are key-value pairs that can be attached to log lines, for example:
level=error,environment=prod,app=nginx,team=loki - Detected fields contain structured key-value pairs extracted automatically from a log line at query time.
- Patterns are templates automatically derived from the log stream, used to match lines of the same type. New innovations here have led to some powerful capabilities described below.
Let’s explore (get it?) each of these in turn, and see how Explore Logs makes it easier than ever to make use of these features.
Labels
In Loki, labels are key-value pairs that are used to organize and identify log streams. Labels are attached to log streams to help users query, filter, and aggregate logs efficiently. They are similar to tags or metadata in other logging systems.
Explore Logs creates a log volume chart for each label, allowing you to easily see which are the most active.

Selecting a label shows you a breakdown of the logs per value. For example, log level is broken down into debug, info, warning, error, and critical.

Selecting a value applies the filter (by writing LogQL for you in the background) and immediately jumps to a curated view showing the relevant log lines.

Detected fields
Detected fields in Loki refer to fields that are automatically extracted from log messages when they’re ingested. Loki doesn’t index the content of log lines, but it can parse and extract fields from logs at query time. This feature allows users to query logs more efficiently by using these fields without the need to label every possible attribute as labels, which could be costly and inefficient.
Explore Logs offers a seamless experience when dealing with detected metadata. A selection of the fields is automatically broken out into a grid view, and you can filter the logs down from there.
To the end user, the mechanics work nearly identically when working with labels and detected fields, reducing the cognitive overhead of having to remember which is which (and the query syntax associated with each one).

Pattern matching
Loki extracts log patterns, which helps you understand the different types of log lines produced by your services. Pattern extraction occurs after filtering. For best results, we recommend that you first filter by known values (such as labels, detected fields, and time range) to narrow down the search space and make patterns more useful.
You can use pattern matching to:
- Understand the kinds of log lines produced by your systems
- Hide noisy or irrelevant lines to quickly narrow down on what’s important
- Focus on specific trends or anomalies by filtering for log lines matching one or more of the patterns
Explore Logs lets you easily add multiple patterns to your filters, which will include log lines matching any of the selected patterns. You can also exclude a pattern to hide that kind of log line.
Example use case for pattern matching
Say you’re looking for errors among a lot of HTTP traffic logs. It can be tough to spot the individual lines you’re looking for. With patterns, you can simply mute the offending lines by excluding lines of that type at the click of a button.
Consider the example log lines below. You can clearly see two distinct patterns:
code=200 method=get path=/page1 trace_id=123
code=500 method=post path=/page2 trace_id=124
err: code=500 msg=”db connection error” trace_id=124
code=201 method=post path=/page2 trace_id=125
code=200 method=get path=/page1 trace_id=126
code=500 method=post path=/page2 trace_id=127
err: code=500 msg=”db connection error” trace_id=127
code=200 method=get path=/page2 trace_id=128
code=200 method=get path=/page2 trace_id=129
code=500 method=post path=/page2 trace_id=130
err: code=500 msg=”db connection error” trace_id=130
The first pattern describes the HTTP requests:
code=<_> method=<_> path=/<_> trace_id=<_>And the second pattern describes the error lines:
err: code=<_> msg=”<_>” trace_id=<_>The values are stripped away, leaving only string constants and LogQL placeholders that make up the template, or pattern.
Did you know? In Loki 3.0, you can use pattern filters in place of RegExp for a faster query time.
What else can you do with Explore Logs?
In addition to everything we’ve already covered, there are a few other notable Explore Logs features to call out:
Search
Maybe LogQL is hard, but text search is not. Plain text, case-sensitive search of your rendered log lines can come in handy when you’ve narrowed your search far enough.
Copy URL
Easily share your current Explore Logs context with a teammate, to help troubleshoot in a team environment.
Open in Explore
Is there a feature in Explore that you really like that doesn’t exist in Explore Logs yet? Would LogQL be really helpful for you at this point? Easily jump into Explore — our UI for data exploration of hundreds of data sources, including Loki — while preserving your current context.
How Explore Logs works
We can probably agree this looks really cool, and it’s a pretty different experience from Explore. But, how can it actually help developers?
Well, how does solving observability problems faster sound? Faster to close that P1, faster to know what hotfix to push to prod, faster back to bed. Let’s show you how.
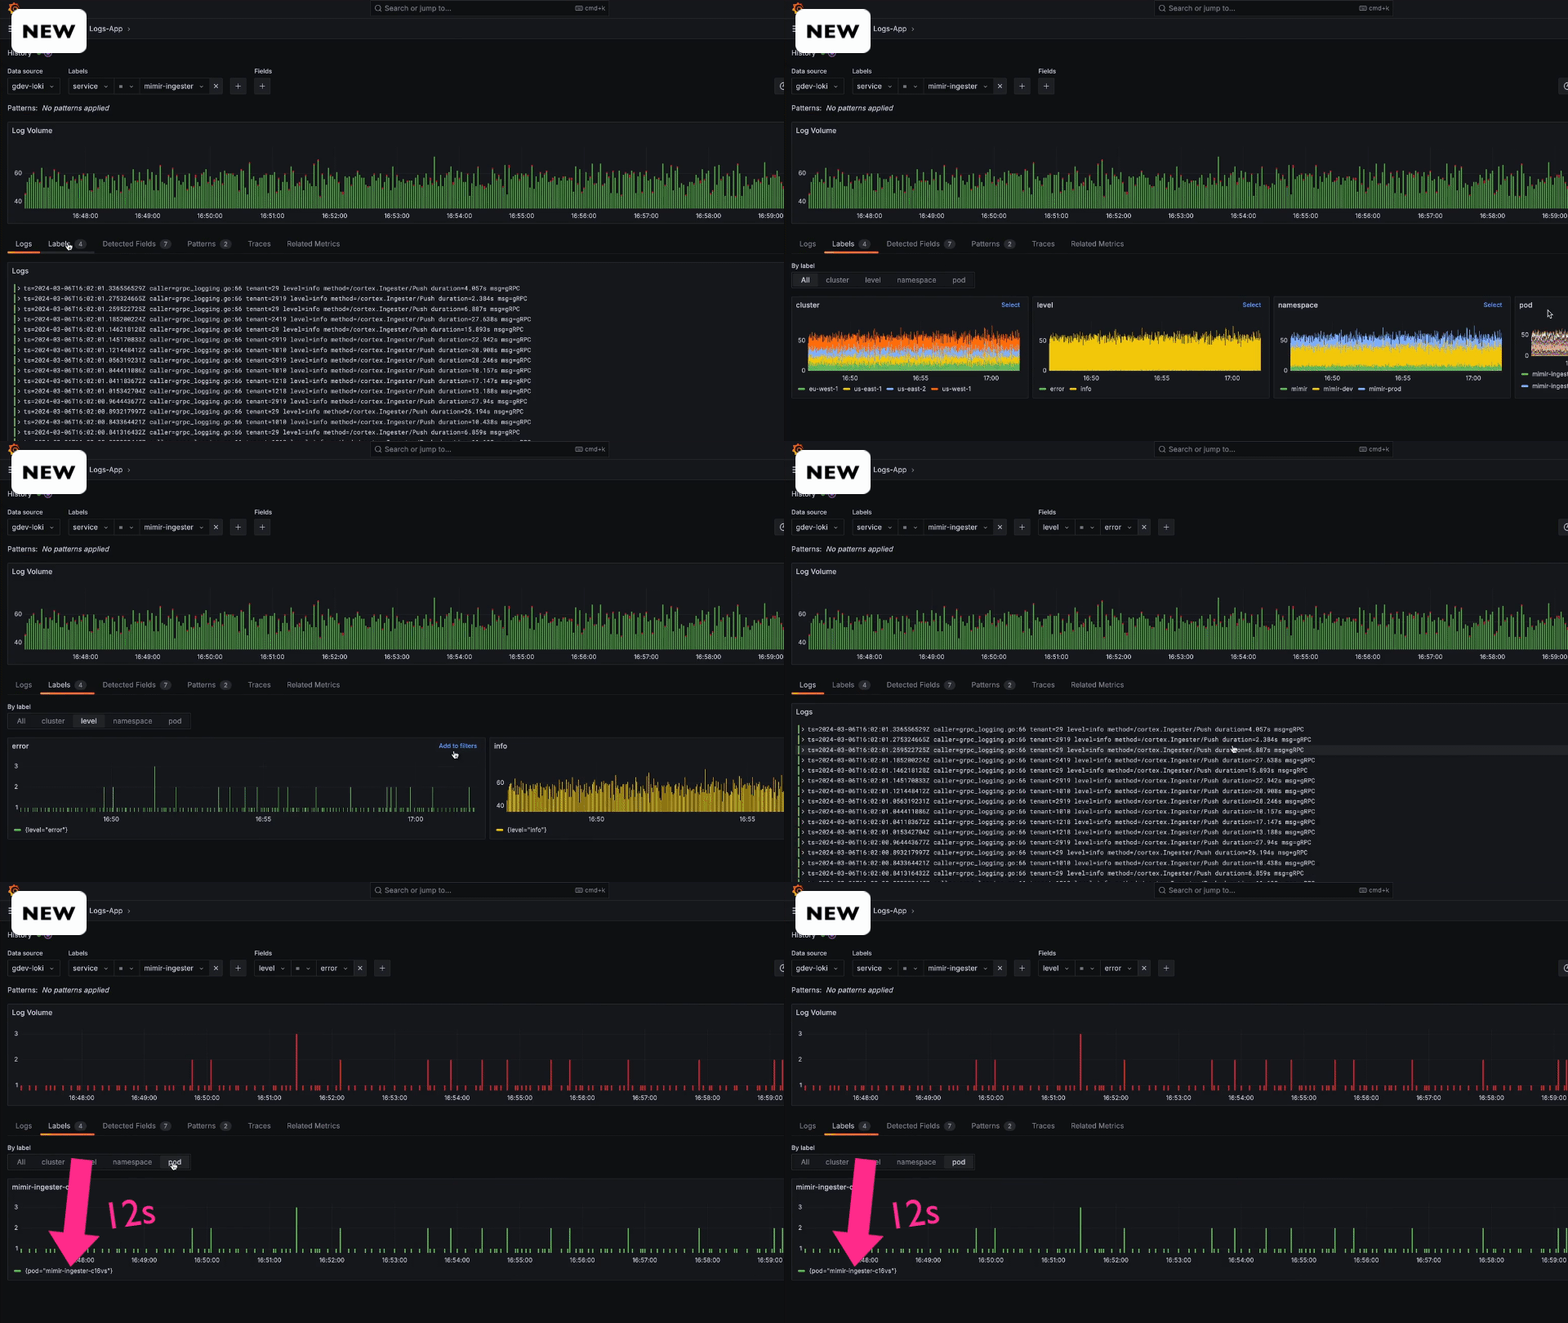
Suppose you need to identify a misbehaving pod in one of your services. You can certainly get that information using LogQL and Explore — construct a LogQL metrics query that counts errors by service, and see which one pops up. But is it the easiest way?
Not anymore! Now you can:
- Start by selecting your service
- Select the
levellabel selector, then addlevel=errorto your filter criteria - Select the
podlabel selector, then see all impacted pods and their error rates - With just one more click, see the log lines associated with these pods
Just a handful of clicks, with visual cues at each step of the way and — once more with feeling — without writing LogQL.
Special thanks
Explore Logs was the result of shared empathy, creativity, and hard work. We’d like to recognize all the contributors to Explore Logs so far:
- cyriltovena
- gtk-grafana
- ivanahuckova
- L2D2grafana
- matryer
- matyax
- sandeepsukhani
- shantanualsi
- svennergr
- trevorwhitney
- zizzpudding
Try it for yourself!
Explore Logs is available to preview today. You can learn more in the Explore Logs GitHub repository. You can also try it out by installing from the repo and using Explore Logs with Grafana 11 and Loki 3.0, both of which were announced at GrafanaCON 2024.
Or you can also take Explore Logs for a spin in the Grafana Play environment.
Please let us know what you would like to see improved or added with the Give Feedback button in Explore Logs, or you can engage more deeply in the repo itself!
We are excited to partner with our community and to build the easiest Loki + Grafana experience together!
Learn all about the latest features in Loki 3.0, our open source log aggregation tool.


