
Grafana Cloud updates: cool visualizations, log monitoring made easier, simplified alert routing
We are consistently releasing helpful updates and fun features in Grafana Cloud, our fully managed observability platform powered by the open source Grafana LGTM Stack (Loki for logs, Grafana for visualization, Tempo for traces, and Mimir for metrics).
In case you missed it, here’s a roundup of the latest and greatest upgrades for Grafana Cloud this month.
If you’re not a Grafana Cloud user, what are we waiting for? You can try any of these features for free with our generous free-forever plan. Sign up for an account today!
Updated Grafana visualizations
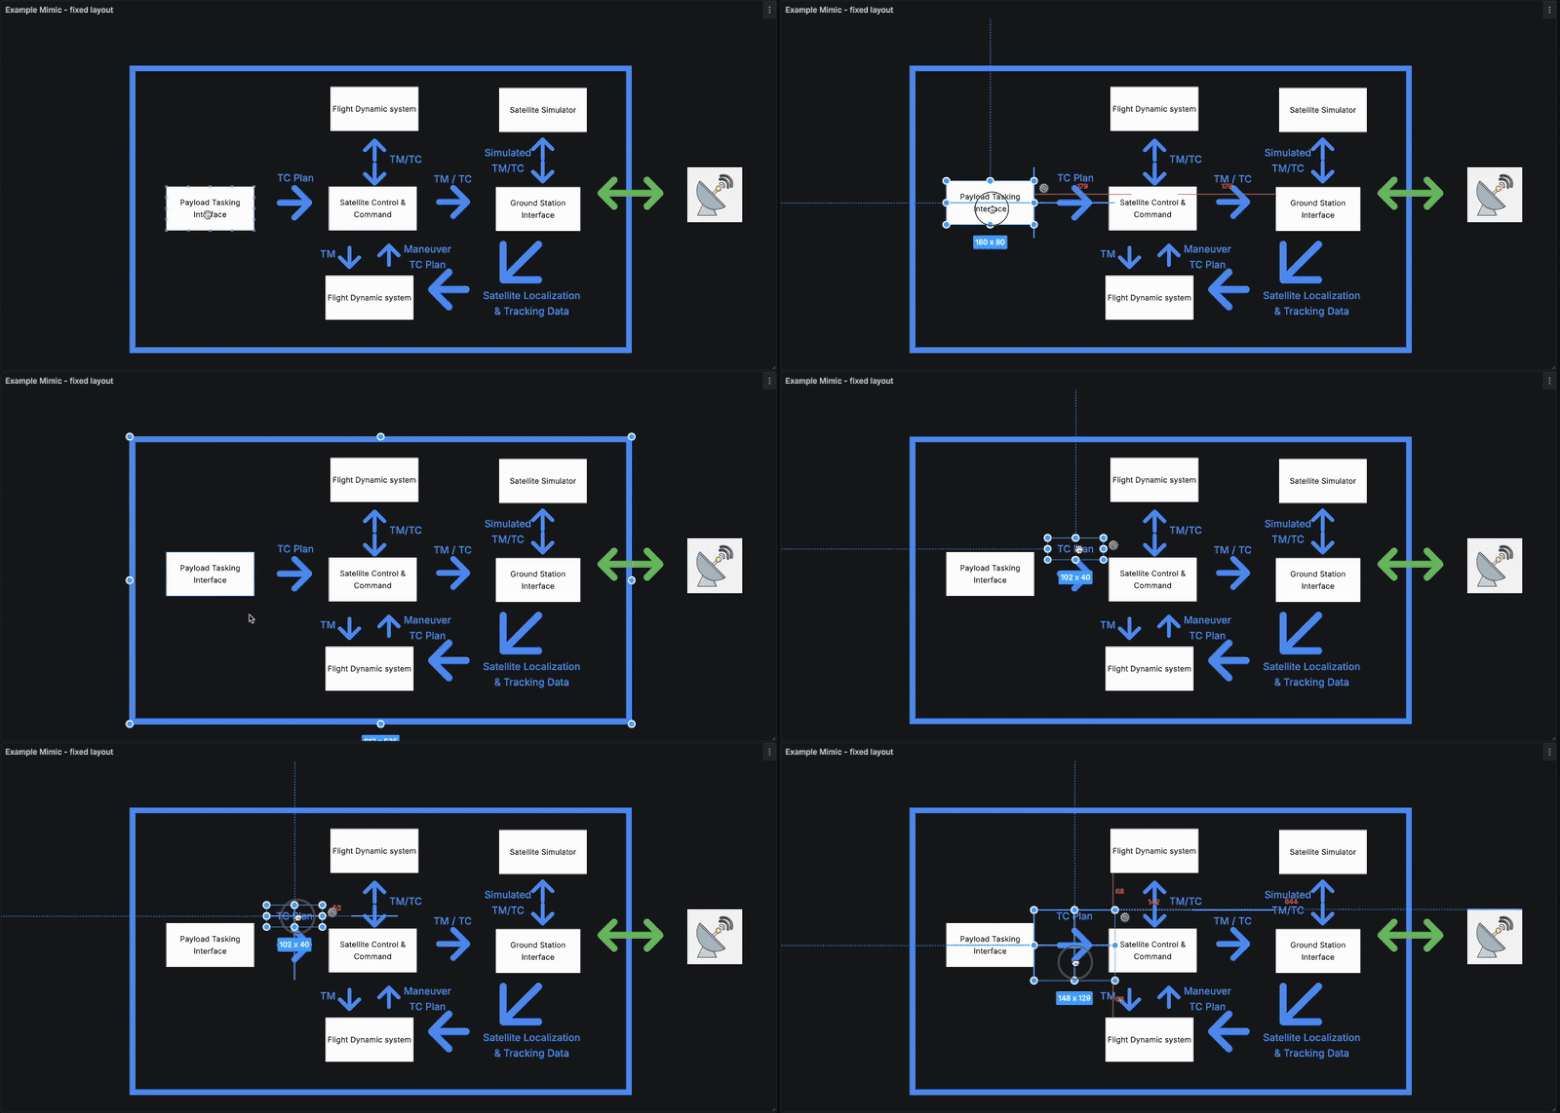
Canvas panel: new capabilities
The Canvas panel, which became generally available in Grafana 10, is an extensible form-built visualization that allows you to explicitly place elements within static and dynamic layouts. This allows you to design custom visualizations and overlay data, all within Grafana’s UI.
This month users will notice that elements will now snap into place and automatically align with others within a canvas, allowing you to more precisely add custom components to your Canvas panel. This builds on recent improvements to pan and zoom within the Canvas panel as well as the ability to add interactive buttons . For more information, check out our Canvas panel documentation.
Geomap updates
The geomap geojson layer now supports styling, such as polygons, point color/size, and line strings. To learn more, refer to our geomap documentation.
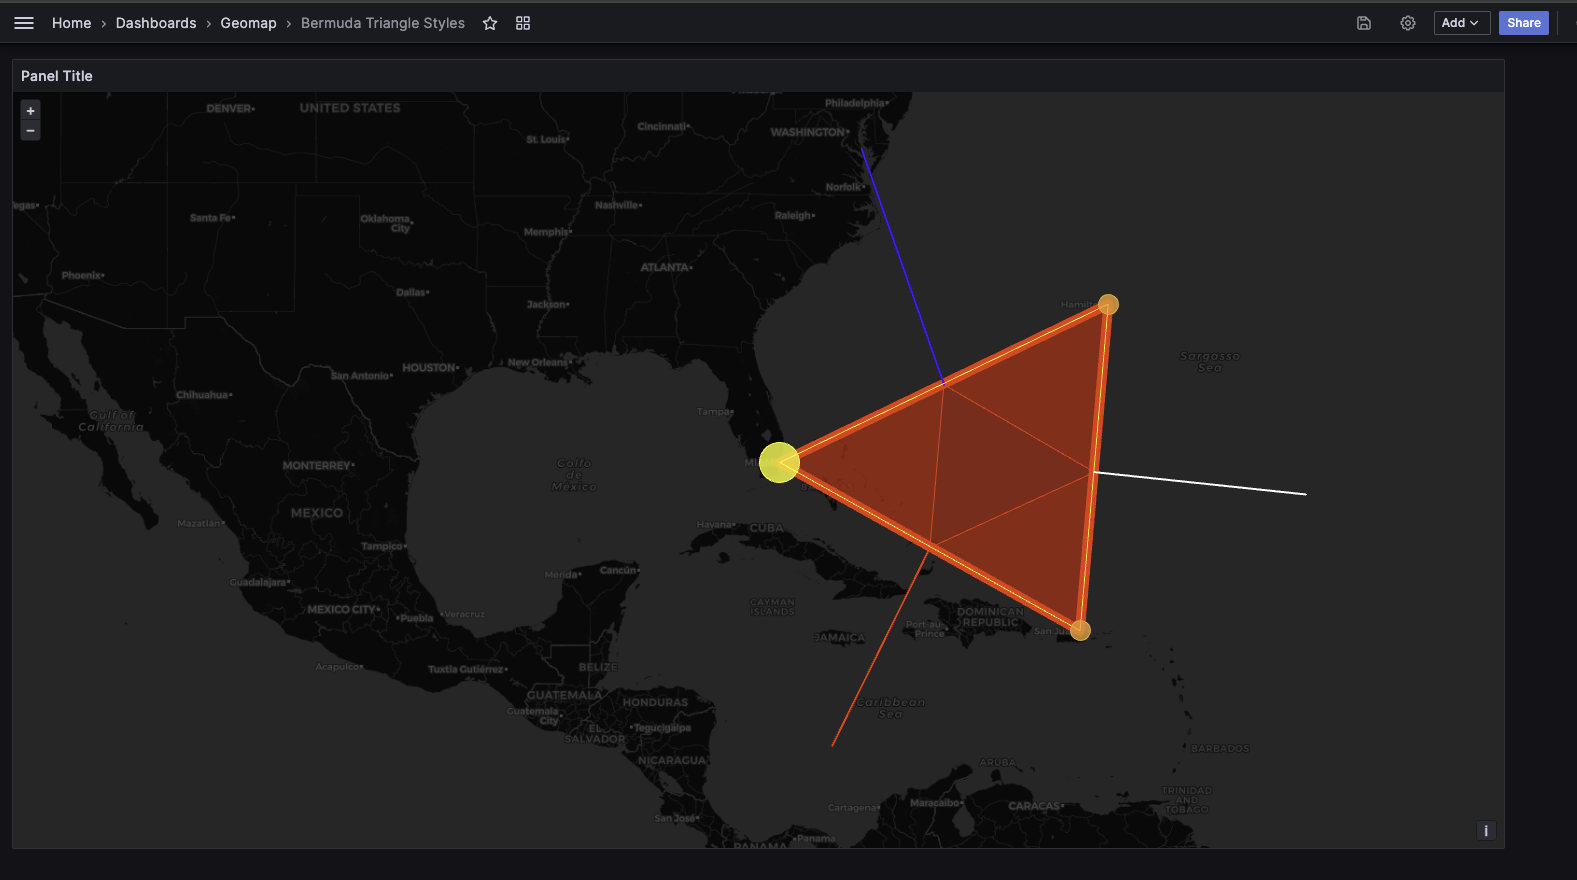
Table panel improvements
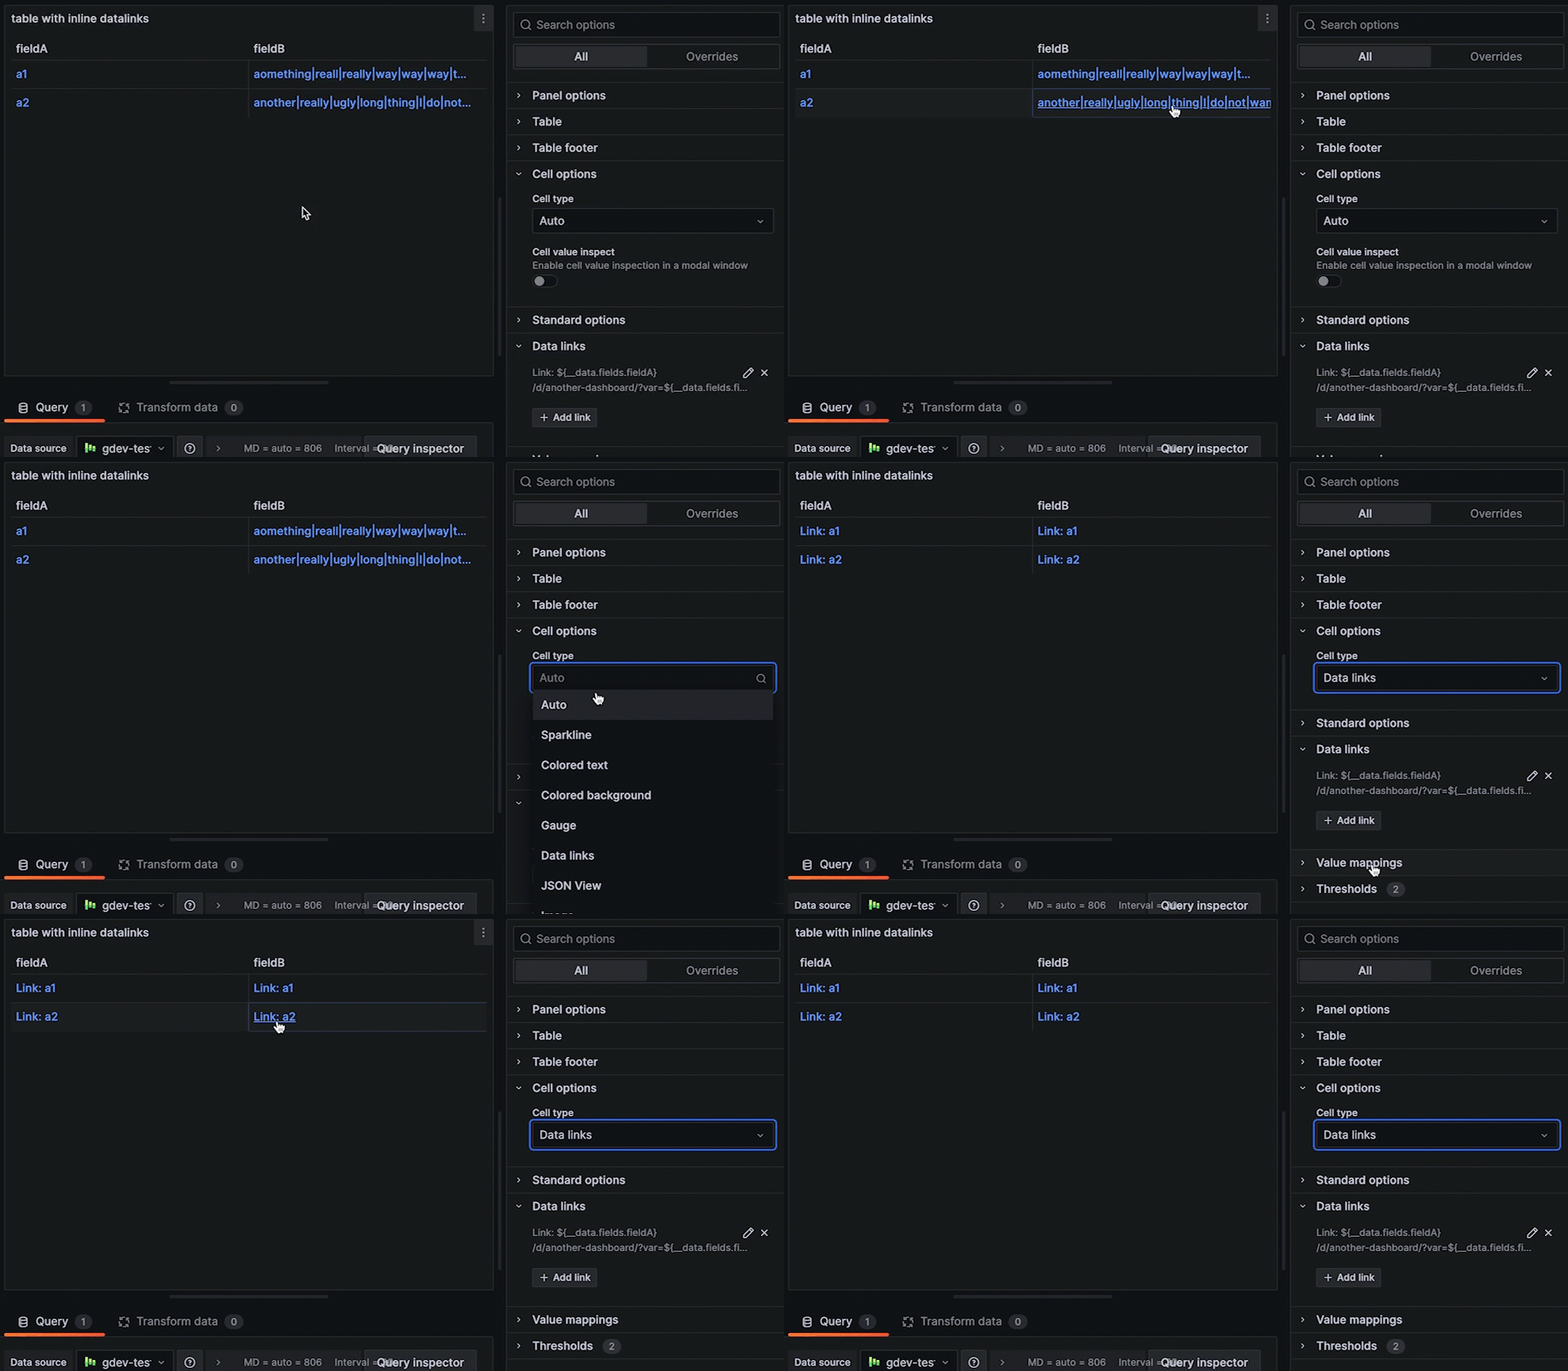
You can now view your data links inline to help keep your tables visually streamlined.
You can also create subtables out of your data using the new group to nested table transformations. To try the subtables feature, reach out to Grafana Labs support.
The latest in Grafana Cloud Logs
Log Volume Explorer for better cost management
The Log Volume Explorer helps you identify the source of high log volumes ingested into Grafana Cloud and answer questions like, “Which teams, environments, Kubernetes clusters, and/or applications are generating the most logs?”
First announced at ObservabilityCON 2023 and now generally available in Grafana Cloud, Log Volume Explorer is part of a suite of new and improved cost management tools developed to help manage, control, and optimize your observability bills. Find the Log Volume Explorer under Administration > Cost Management > Logs.
To learn more, check out our Log Volume Explorer documentation.
Cloud Logs Export for longer log retention
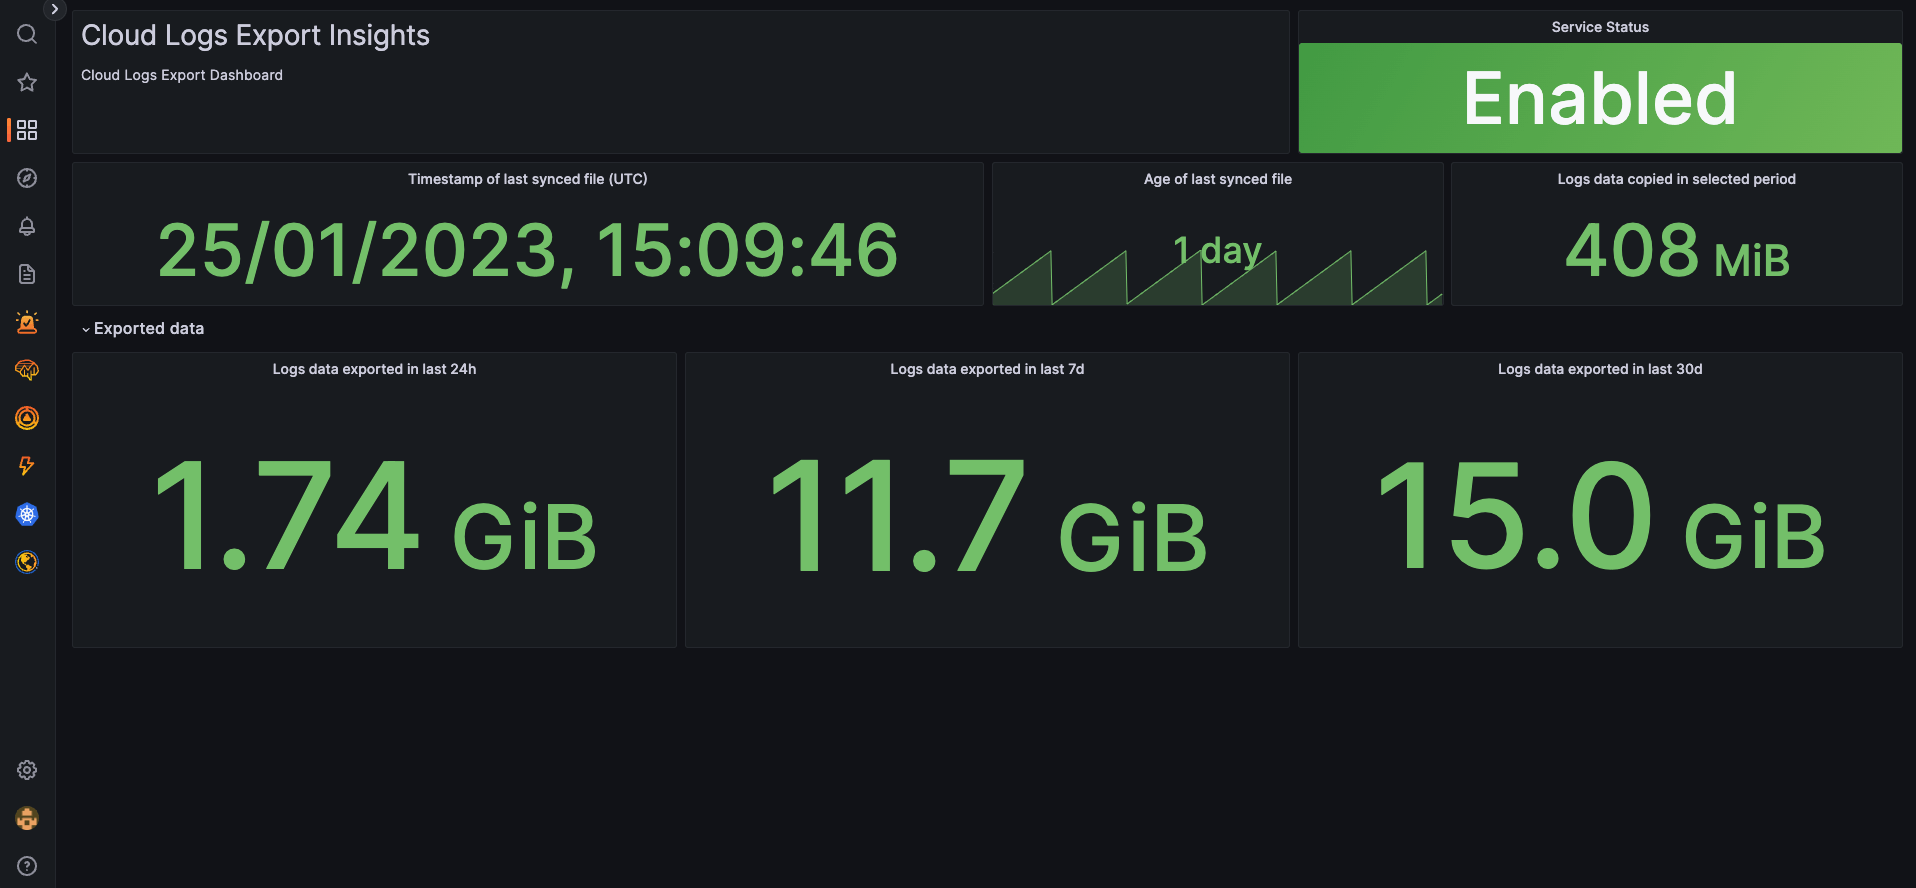
Grafana Cloud Logs offers 30-day retention by default, with the option to pay for longer retention. However, you can also export your logs from Grafana Cloud at no extra cost with Cloud Logs Export.
Now generally available in Grafana Cloud, Cloud Logs Export allows you to cost-effectively archive logs on the object storage of your choice — Amazon S3, Google Cloud Storage (GCS), or Microsoft Azure Blob. You can then access the exported data either with LogCLI or by using a self-hosted version of Grafana Loki.
To learn more, read our blog post or related documentation or try it out yourself! From the Grafana menu, go to Plugins > Cloud Logs Exporter to get started.
New AI/ML features
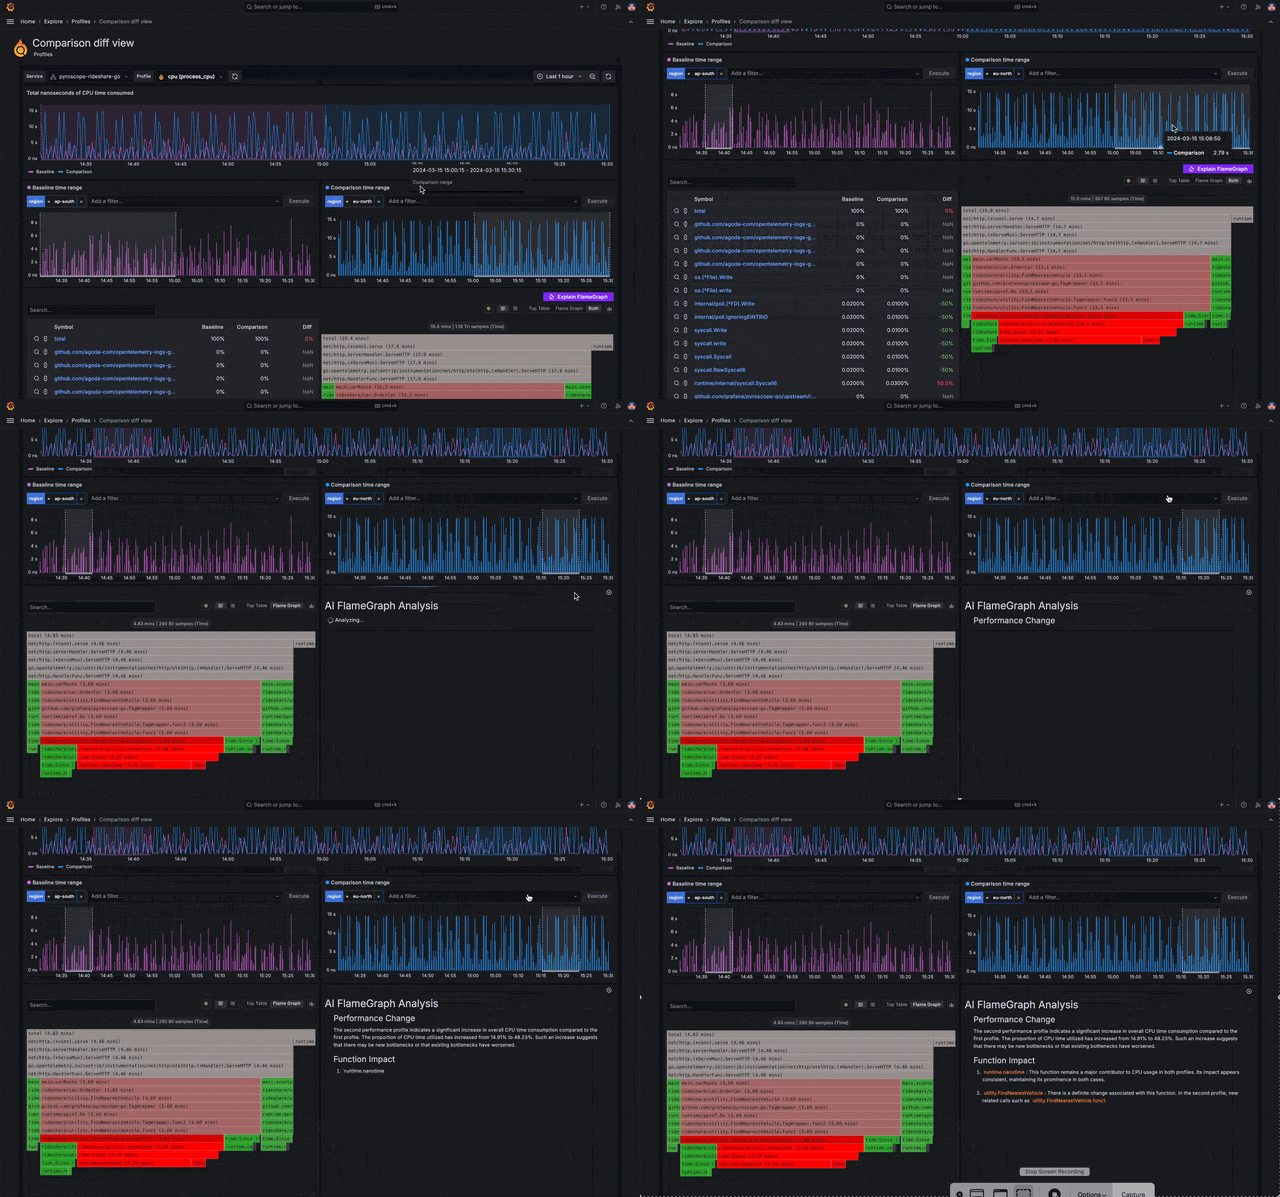
Flame graph AI for faster insights from profiling data
AI and flame graphs come together in Grafana Cloud to make understanding profiling data easier. Flame graph AI helps you understand your profiling data by using a large-language model (LLM) to help you understand your profiling data and identify bottlenecks, root causes, and suggested fixes. To learn more, check out our Flame graph AI documentation.
Note: Flame graph AI uses the LLM app plugin for Grafana to provide the large-language model using the OpenAI API.
AI-generated titles and descriptions for Grafana dashboards
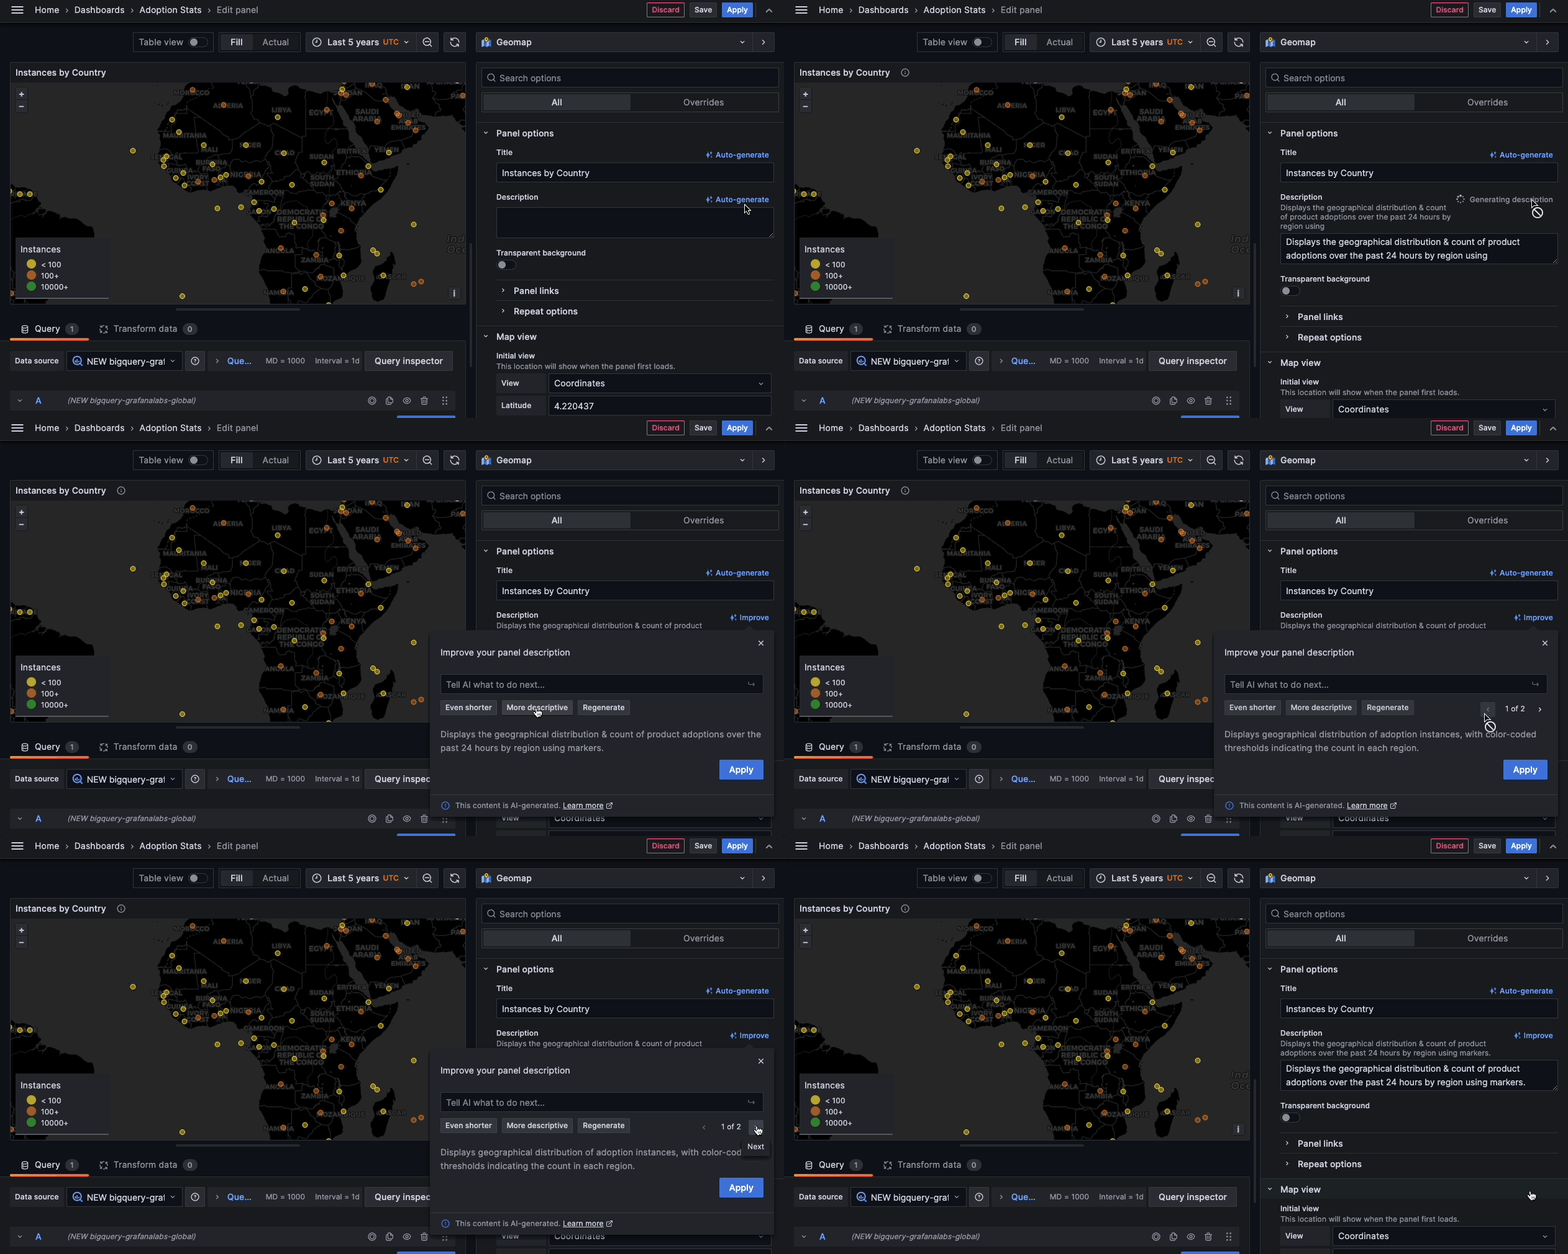
You can now use generative AI in Grafana to automatically summarize the information in your panels and dashboards and create titles and descriptions for your dashboards. To try this feature, which is generally available in Grafana Cloud, you need to enable and configure Grafana’s LLM app plugin.
When enabled, look for the ✨Auto generate option next to the Title and Description fields in your panels and dashboards, or when you press the Save button.
With the LLM app plugin you can also access more AI-powered features in Grafana Cloud, such as Flame graph AI mentioned above, as well as:
- Incident auto-summary
- Sift investigations to identify error patterns in logs, Kube crashes, and more
For more information, refer to the Grafana LLM app plugin documentation.
Simplified routing in Grafana Alerting
This feature simplifies your options for configuring where your notifications are sent when an alert rule fires. You can choose an existing contact point from within the alert rule creation form. (Read: no more label matching for notification policies!) You can also set optional muting, grouping, and timing settings within the alert rule.
Simplified routing also inherits the alert rule RBAC, increasing control over notification routing while preventing accidental notification policy updates and ensuring critical notifications aren’t missed.
To try out simplified alert notification routing, contact Grafana Labs support.
Create metrics from traces with TraceQL metrics
TraceQL metrics is an experimental feature that creates metrics from traces. Metric queries can extend trace queries by applying a function to trace query results. This powerful feature allows for adhoc aggregation of any existing TraceQL query by any dimension available in your traces, much in the same way that LogQL metric queries create metrics from logs.
To learn more, read our TraceQL metrics documentation or contact support to enable this feature in Grafana Cloud.
New and improved Grafana Cloud solutions
- AWS Observability: We’ve built a new user-centric app for monitoring your AWS environment. Access all your Amazon CloudWatch metrics in one place, use tags and filters to better organize your data, make decisions about your instances easier and faster with a specialized EC2 view, and more!
- Apache Solr: Monitor and visualize logs and metrics for the open source search platform built on Apache Lucene. This Grafana Cloud integration includes eight alerts and four prebuilt dashboards for tracking Solr clusters, logs, query performance, resource monitoring, and logs.
- Windows Active Directory: Use Grafana Cloud to monitor Microsoft’s popular directory service for Windows domain networks. This integration includes four alerts and two pre-built dashboards to help monitor and visualize Active Directory metrics and logs.
See the full list of Grafana Cloud solutions, which include Kubernetes Monitoring, Linux, MongoDB, and more.
AngularJS deprecation in Grafana: How to prepare
AngularJS support in Grafana was deprecated in Grafana 9 and it will be turned off by default in Grafana 11, which will be released in May. When this happens, any plugin that depends on AngularJS will not load, and Angular-based dashboard panels will not show data.
To help with this transition, Grafana now displays a warning banner in any dashboard with a dependency on an AngularJS plugin. Warning icons are also present in any panel where the panel plugin or underlying data source plugin has an AngularJS dependency.
This complements the existing warnings already present on the Plugins page under the administration menu.
We’ve also developed an open source tool to detect-angular-dashboards. It can be run against any Grafana instance to generate a report listing all dashboards that have an AngularJS plugin dependency, as well as which plugins are in use. The tool also can also detect private plugins that have an AngularJS dependency; however, this particular feature only works with Grafana 10.1 or higher.
To avoid any interruptions in your Grafana dashboards, we encourage you to migrate to React-based visualizations and data sources included in Grafana or from the Grafana plugins catalog.
To learn more, refer to the Angular support deprecation documentation, which includes recommended alternative plugins, read our migration guide on the blog, and check out our video demo on how deprecation warnings work in Grafana.
Grafana Cloud is the easiest way to get started with metrics, logs, traces, dashboards, and more. We have a generous forever-free tier and plans for every use case. Sign up for free now!


