AWS Observability in Grafana Cloud: A simpler, more intuitive cloud monitoring app
We know monitoring your AWS environment can be difficult, which is why we’re thrilled to tell you about a new application we’ve built to make the entire process easier, more efficient, and more intuitive.
We’ve offered AWS monitoring capabilities for some time, but with the AWS Observability application in Grafana Cloud, we’ve distilled our collective efforts into a more integrated and potent solution. This new app, which supplants our existing AWS monitoring integration, is a more user-centric tool with seamless integration and an intuitive interface.
We’ll dig deeper into the app in future blogs, but for now we want to give a high-level recap of how DevOps teams, cloud architects, and system administrators can use AWS Observability to cater to the needs of diverse projects, from small-scale operations to complex, distributed systems.
How we’re building a user-centric AWS monitoring app
We built the AWS Observability app on Yet Another CloudWatch Exporter (YACE), an open source Prometheus exporter for Amazon CloudWatch. YACE has the unique ability to discover all resources for a particular AWS service and associate those resources to their respective CloudWatch metrics.
We’re able to use that functionality to make your resource tags available at query time. The combination of resource tags and CloudWatch metrics gives you a much more flexible and powerful experience vs CloudWatch metrics alone.
Here are just two of the additional benefits of we provide on top of YACE:
- Agentless: Why do it yourself when we can do it for you? No need for additional infrastructure or software; the app directly interfaces with AWS leveraging the security best practices of AWS AssumeRole authentication
- Simplified cross-account and cross-regional monitoring: Enhanced querying capabilities make it easier to monitor resources across accounts and regions.

Key features to assist with observability
The AWS Observability app has a range of features to make it easier to monitor your cloud environment. This includes helpful dashboards we carried over from the previous experience, as well as new views and capabilities.
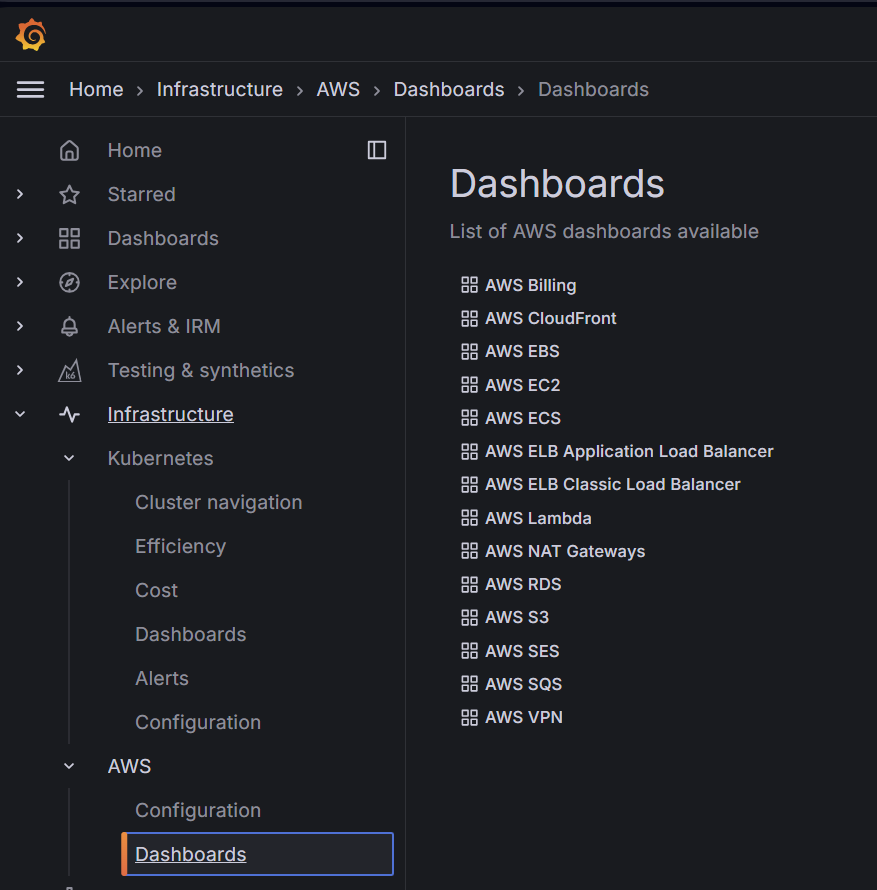
For starters, we made it easier to find the app. It now has a dedicated spot in the left-hand navigation in Grafana Cloud, and you can also access any of your AWS dashboards through the search bar.
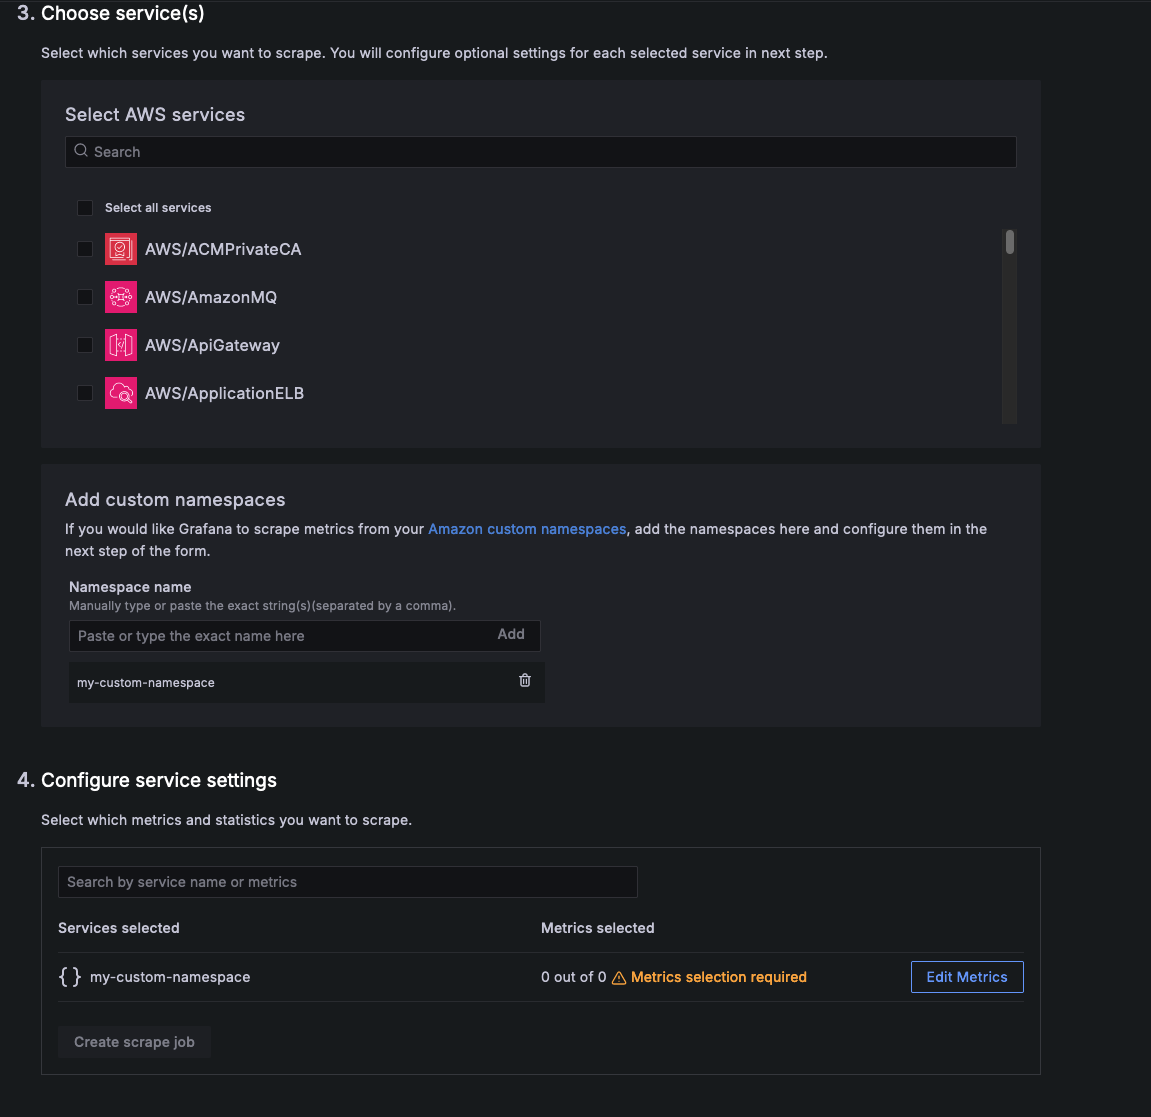
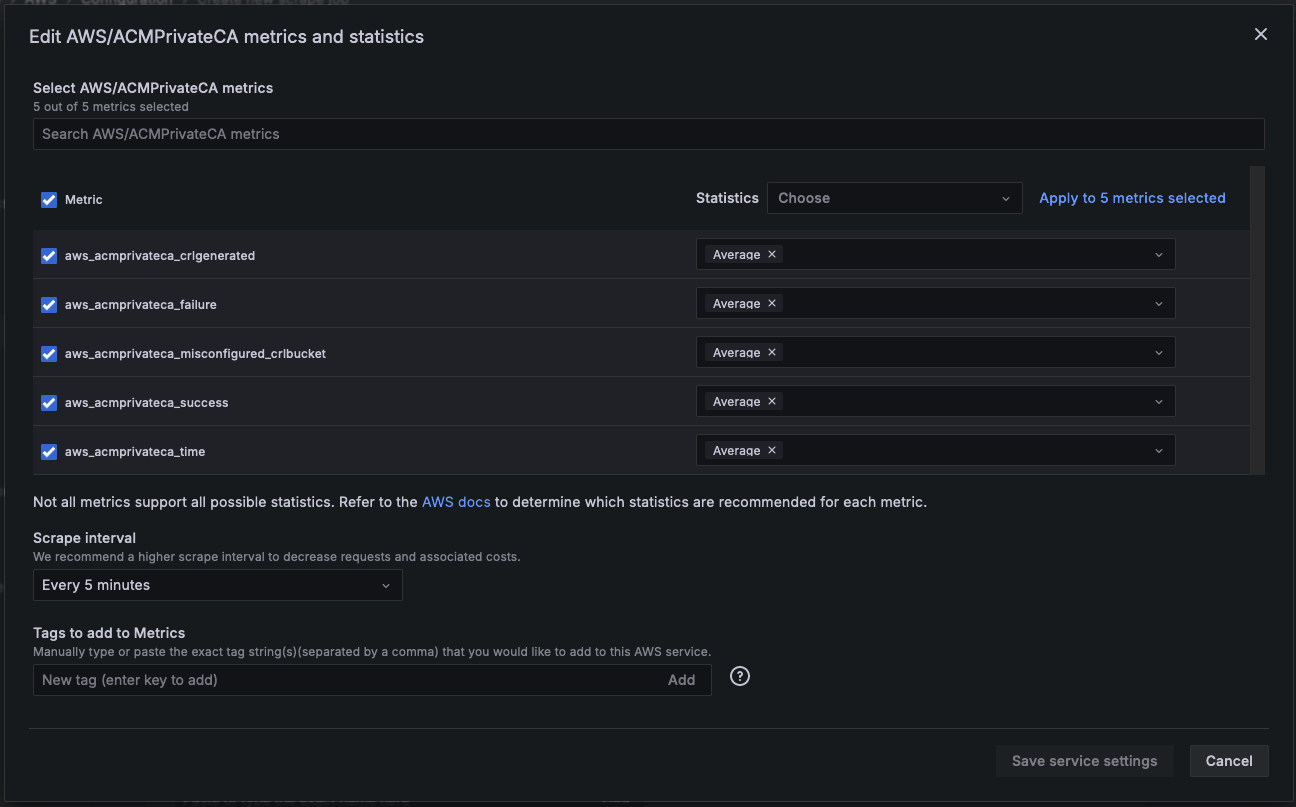
We’ve also added the ability to pull metrics from custom namespaces and add resource tags to metrics. By adding custom namespaces, you can view and access all the data you might have stored in CloudWatch in a single place.

The tags on metrics feature will help you organize your monitoring data more effectively through streamlined data filtering and improved operational alignment. For example, if you know the tags you want to query, you can add them upfront and avoid the need to do complex PromQL joins later. As a result, you’ll be able to take querying from this:
aws_ec2_cpuutilization_maximum + on (name) group_left(tag_aws_eks_cluster_name, tag_eks_nodegroup_name) aws_ec2_infoto this:
aws_ec2_cpuutilization_maximum{tag_aws_eks_cluster_name="example", tag_eks_nodegroup_name="example"}
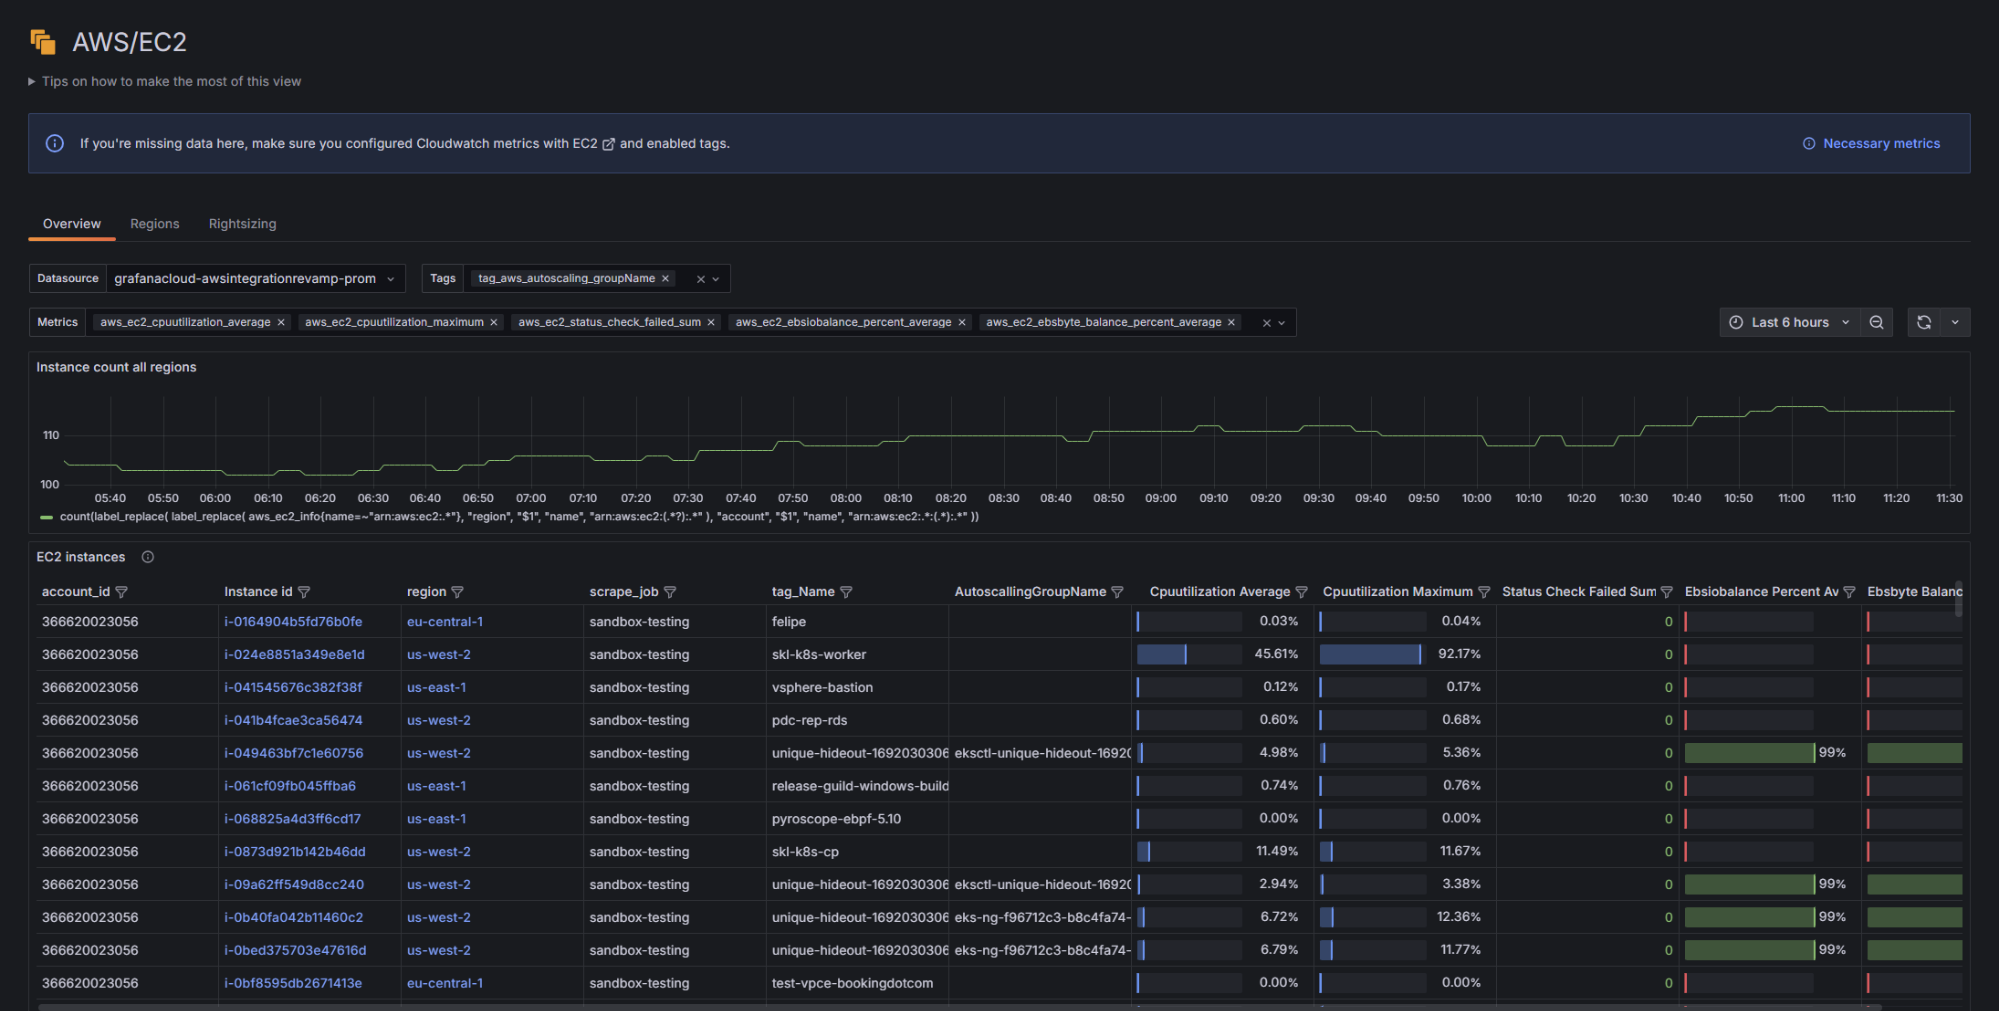
We’ve also added a dedicated Amazon EC2 view so you can get in-depth insights into your instances with a specialized dashboard that helps in monitoring critical metrics, optimizing resources, and making data-driven decisions.
The EC2 view uses resource tags to aggregate data in panels so you can:
- Focus on priority metrics for different use cases (and block out the noise of metrics that don’t matter as much for your goals)
- View dozens to thousands of instances in a more digestible manner
- Pare down the list of instances to the ones you care about, by filtering by AWS account ID, region, scrape job, or tag
- Sort instances by metrics based on industry best practice thresholds
- Quickly and efficiently spot the specific instances that require more attention
- Drill down into the instance detail view to figure out what’s going on and why

In addition to the new features, we’ve retained the popular out-of-the-box dashboards that were previously available, providing instant insights into various AWS services seamlessly. These include:
- AWS Cost Dashboard. Get detailed insights into spending patterns, helping in budget optimization and identifying cost-saving opportunities.
- AWS CloudFront. See request volumes, error rates, error types, and data transfer statistics.
- AWS EBS. Monitors volume queue length and throughput, which is crucial for storage performance.
- AWS ECS and ELB. Get visibility into container orchestration and load balancer health.
- AWS Lambda. View function invocations, errors, and request durations, all of which are essential for serverless monitoring.
- AWS NAT Gateways. Monitor data flow and processing more efficiently.
- AWS RDS: View database performance metrics like CPU utilization and connection counts.
- AWS S3: Tracks bucket sizes, object counts, and request metrics for object storage management.

What’s next: RDS view and log streaming via Firehose
As we continue to evolve the application, we plan to address users’ specific challenges through added features like an RDS view and log streaming via Amazon Data Firehose.
- The RDS view will offer insights into resource utilization and query optimization, enhancing database efficiency and reducing operational bottlenecks.
- Log streaming will facilitate real-time data analysis and incident response, streamlining the troubleshooting process and improving system reliability.
We’re excited to continue to expand and improve the app, but in the meantime it’s already comprehensive enough to serve as the centerpiece of your AWS monitoring efforts. Learn all about the new AWS Observability App in Grafana Cloud by visiting our page dedicated to the all-in-one solution.
Grafana Cloud is the easiest way to get started with metrics, logs, traces, dashboards, and more. We have a generous forever-free tier and plans for every use case. Sign up for free now!


