An OpenTelemetry backend in a Docker image: Introducing grafana/otel-lgtm
OpenTelemetry is a popular open source project to instrument, generate, collect, and export telemetry data, including metrics, logs, and traces. OTel, however, does not provide a monitoring backend — and this is exactly where the Grafana stack comes in.
Here at Grafana Labs, we’re fully committed to the OpenTelemetry project and community. We continually focus on building compatibility into both our open source projects and products, and on helping our users combine OpenTelemetry and Grafana to advance their observability strategies.
In line with that effort, today we’re presenting grafana/otel-lgtm, a Docker image that makes it easy to get started with open source monitoring using OpenTelemetry.
We’ll take a look at how grafana/otel-lgtm works, as well as how to run the image, populate your databases with OpenTelemetry data, and run queries. Lastly, we’ll briefly explore how you can use grafana/otel-lgtm for automatic integration testing of OpenTelemetry applications.
Note: The grafana/otel-lgtm Docker image is an open source backend for OpenTelemetry that’s intended for development, demo, and testing environments. If you are looking for a production-ready, out-of-the box solution to monitor applications and minimize MTTR with OpenTelemetry and Prometheus, you should try Grafana Cloud Application Observability.
A quick overview of the Docker image
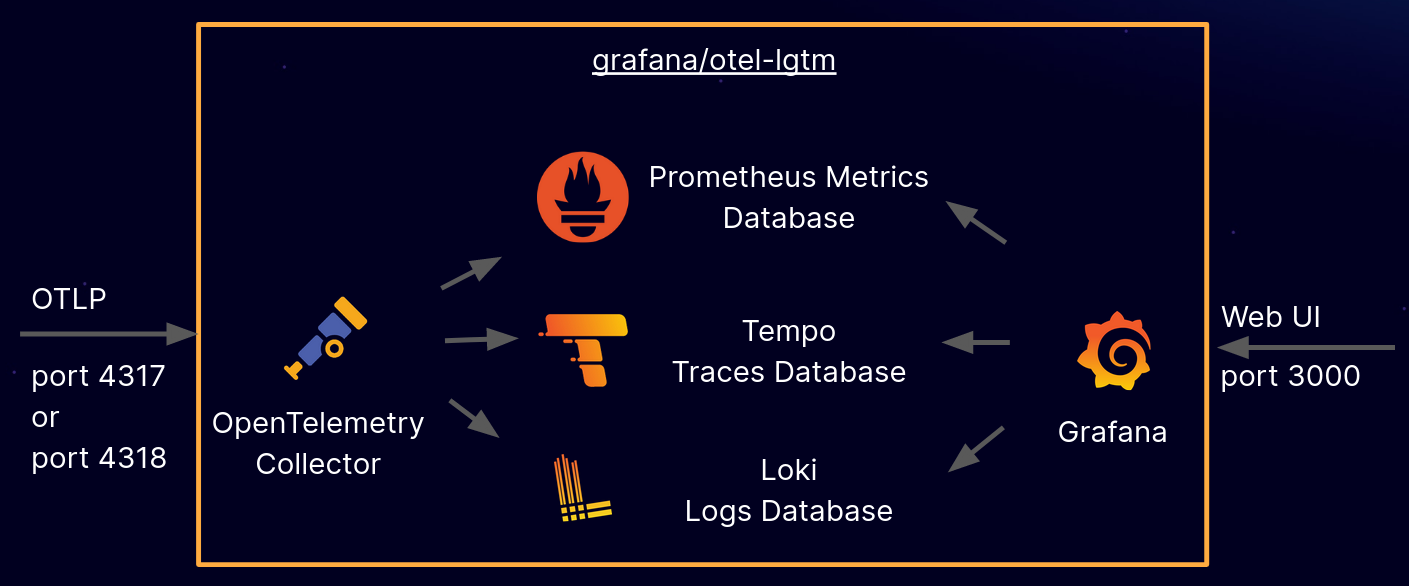
The grafana/otel-lgtm image contains a preconfigured OpenTelemetry backend based on the OpenTelemetry Collector, Prometheus, Loki, Tempo, and Grafana.
The OpenTelemetry Collector receives OpenTelemetry signals on ports 4317 (gRPC) and 4318 (HTTP). It forwards metrics to a Prometheus database, spans to a Tempo database, and logs to a Loki database. Grafana has all three databases configured as data sources and exposes its Web UI on port 3000.

The image is available on Docker Hub, and the source code can be found on GitHub.
Run the Docker container
Withgrafana/otel-lgtm, you can run an open source backend for OpenTelemetry on your laptop with a single command:
docker run -p 3000:3000 -p 4317:4317 -p 4318:4318 --rm -ti grafana/otel-lgtm
It may take a minute for the container to start up. When startup is complete, the container will print the following line to the console:
The OpenTelemetry collector and the Grafana LGTM stack are up and running.
In the command line example above, we use the -p command line switch to expose a few ports from the container. Port 3000 is used by the Grafana UI, while ports 4317 and 4318 are exposed for the OpenTelemetry Collector. We’ll explain the usage of these components in the sections below.
As a quick test, once the container is up and running, you can log into the Grafana UI on http://localhost:3000 (username: admin, password: admin). At this point, you cannot see any interesting data. The next step is to run an application instrumented with OpenTelemetry to send some metrics, traces, and logs.
Send OpenTelemetry signals
The OpenTelemetry line protocol defines two alternatives for sending OpenTelemetry signals: gRPC and HTTP. The grafana/otel-lgtm image supports both, and accepts OpenTelemetry signals on the default OpenTelemetry ports:
- 4317: OpenTelemetry gRPC endpoint
- 4318: OpenTelemetry HTTP endpoint
By default, any application instrumented with OpenTelemetry will automatically send metrics, traces, and logs to one of these ports on localhost. There’s no configuration required.
If you don’t have an example application available, you can find example REST services in various programming languages in the examples/ folder on https://github.com/grafana/docker-otel-lgtm. Each example includes instructions on how to run it. Once the example is up and running, point your Web browser to the example application and reload a couple of times to generate some network traffic.
By default, OpenTelemetry exports signals every 60 seconds. While this is a reasonable default for production, it’s a bit long when you are experimenting on your laptop and want to see data quickly. There is a standard environment variable for setting a shorter export interval with OpenTelemetry instrumentation:
export OTEL_METRIC_EXPORT_INTERVAL=500
Set this variable prior to starting your application to see your OpenTelemetry metrics, traces, and logs faster.
View the example dashboards in Grafana
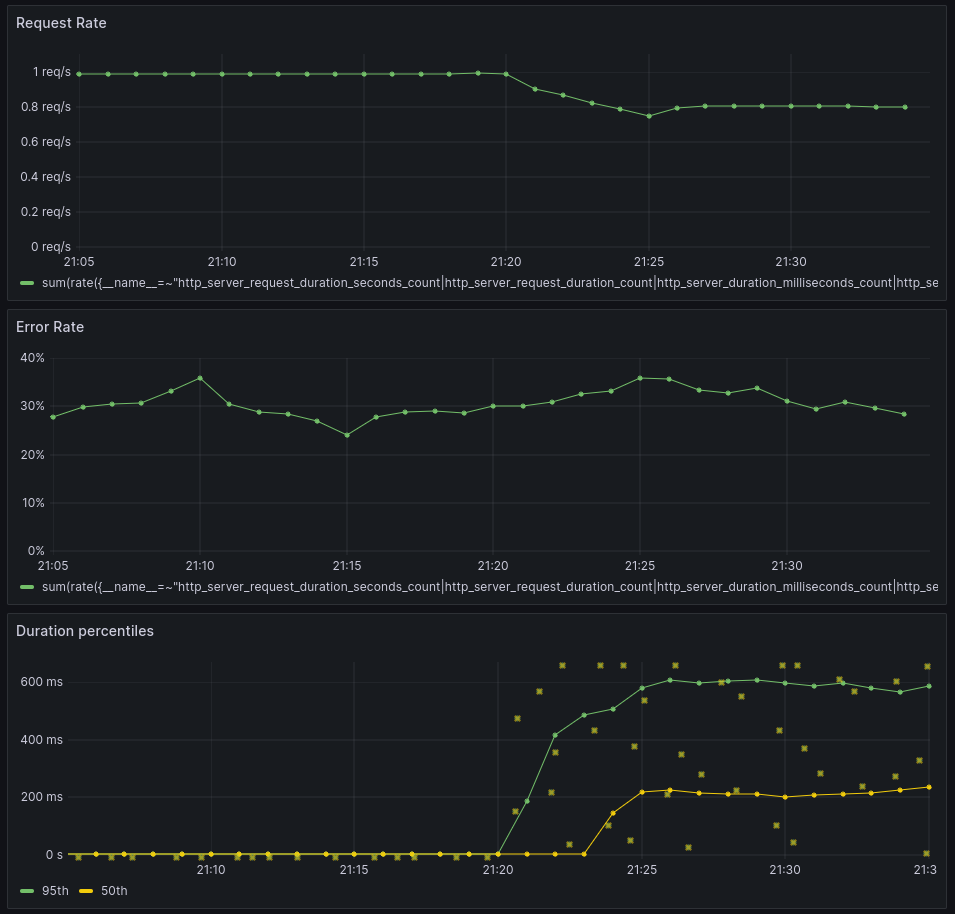
The grafana/otel-lgtm image includes a couple of example Grafana dashboards that are based on OpenTelemetry’s semantic conventions, like HTTP metrics or runtime metrics. The goal is to provide simple examples for getting started, not to provide the most sophisticated dashboards. You can find these dashboards in the Dashboards menu on the Grafana UI http://localhost:3000/dashboards.

Run queries in Grafana Explore
Apart from browsing the example dashboards, you can use Grafana Explore to manually run queries. Select the data source from the dropdown on the top left of the Explore view.
- The Prometheus data source allows you to run PromQL queries against the metrics database. If you are unfamiliar with PromQL, use the query builder to select metrics from a dropdown menu.
- The Tempo data source allows you to run TraceQL queries against the trace database. If you are unfamiliar with TraceQL, use the query builder to search for traces using drop down menus.
- The Loki data source is for exploring logs with LogQL. If you are unfamiliar with LogQL, use the label browser to select logs based on labels.
Query OpenTelemetry metrics with PromQL
OpenTelemetry defines standard metric and attribute names as part of the semantic conventions. For example, any HTTP service instrumented with OpenTelemetry will provide a histogram metric named http.server.request.duration in OpenTelemetry.
The Prometheus and OpenMetrics Compatibility spec defines how the OpenTelemetry metric names map to Prometheus metric names, and it may vary depending on the version and configuration. By default, the request duration histogram will be represented as three time series in Prometheus:
http_server_request_duration_seconds_counthttp_server_request_duration_seconds_sumhttp_server_request_duration_seconds_bucket
The _count represents the total number of requests since the application started. The _sum represents the total time spent serving requests since the application started, and the _bucket metrics are the actual histogram buckets. Type the metric names in the Explore view to see the raw values.
The next step is to apply a PromQL function to get some useful information out of that count. The most common and most useful PromQL function is rate(), which gives you the increase rate per second for a counter.
The following is a simple example of a PromQL query. It will give you the request rate per second for your HTTP endpoints:
rate(http_server_request_duration_seconds_count[$__rate_interval])
For more sophisticated examples of PromQL queries, take a look at the queries used in the example dashboards.
Query OpenTelemetry metrics with TraceQL
Switching to the Tempo data source in Grafana Explore allows you to run TraceQL queries against the Tempo database. The following is a simple example query for all traces that include a service named rolldice (this is one of the example services in the examples/ folder on Github.com/grafana/docker-otel-lgtm):
{.service.name="rolldice"}
The OpenTelemetry semantic conventions define various attributes that you can filter for. For example, the following shows only spans with HTTP status code 500:
{.service.name="rolldice" && .http.response.status_code=500}
TraceQL is a powerful query language that allows filtering not only on attributes, but also on timing and duration. Moreover, it offers aggregations like count(), avg(), min(), max(), and sum(). Take a look at the docs to learn more.
Query OpenTelemetry logs with LogQL
Switching to the Loki data source in Grafana Explore allows you to run LogQL queries against the Loki database. Note: this section is an introduction to querying OpenTelemetry logs with Loki 2.x. However, this will change significantly with the upcoming Loki 3.x release, as Loki 3.x will no longer use JSON to represent OpenTelemetry logs.
OpenTelemetry logs contain metadata, in addition to the actual log body. Today, grafana/otel-lgtm uses the Loki exporter to convert OpenTelemetry logs to Loki. The Loki exporter formats OpenTelemetry logs as JSON blobs.
For example, if you used the label browser to view INFO logs, you will end up with the following query:
{level="INFO"}
The results of this query are JSON blobs representing the OpenTelemetry data. These JSON blobs contain a body field with the actual log lines, and many additional fields with metadata. While it is nice to see what metadata is available, this format makes it hard to read the actual log lines.
The following shows a query that parses these blobs into JSON objects, and defines a line format containing only the log body.
{level="INFO"} | json | line_format "{{.body}}"
The result is what you would typically expect as console log data.
The upcoming Loki 3.0 release will ship with built-in OpenTelemetry logs support. This will make the Loki exporter obsolete. Loki will have native support for OpenTelemetry metadata, and JSON parsing will no longer be necessary. grafana/otel-lgtm will switch to Loki 3.0 as soon as it’s available.
grafana/otel-lgtm for integration tests
While grafana/otel-lgtm is a great way to get started with Grafana and OpenTelemetry, it’s also well-suited for integration testing.
If you build an application that provides OpenTelemetry signals, you might want to write integration tests to verify that these signals are as expected. Writing a test from scratch is significant work, because you need to set up a temporary monitoring backend to send data to. Using a Docker-based integration test framework like testcontainers and the grafana/otel-lgtm image simplifies such tests significantly.
First, configure your test framework to start grafana/otel-lgtm and wait for the following line on the console output:
The OpenTelemetry collector and the Grafana LGTM stack are up and running.
This line indicates that the container is ready to accept data and queries. If you use testcontainers, you can use the Log output wait strategy for that.
Now, run your test scenario and send OpenTelemetry signals to the Docker container.
Finally, use Grafana’s HTTP API to run queries against the data sources and verify that the expected telemetry signals are present.
The following examples use the curl command to illustrate how these requests work. In your test, use your favorite HTTP client instead of curl.
The first example shows how to query Prometheus for a metric named http_server_request_duration_seconds_count:
curl --user "admin:admin" \
	--data-urlencode 'query=http_server_request_duration_seconds_count' \
	http://localhost:3000/api/datasources/proxy/uid/prometheus/api/v1/query
The next example shows how to query Tempo for traces with HTTP status code 200:
curl --user "admin:admin"  \
	--data-urlencode 'q={span.http.response.status_code="200"}' \
	http://localhost:3000/api/datasources/proxy/uid/tempo/api/search
And finally, the following example shows how to query Loki for logs:
curl --user "admin:admin" \
--data-urlencode 'query={level="INFO"} | json | line_format "{{.body}}"' \	http://localhost:3000/api/datasources/proxy/uid/loki/loki/api/v1/query_range
Using these types of queries in your integration test is an easy way to automatically verify telemetry data for your application.
Looking ahead
Overall, the grafana/otel-lgtm image is a great way to get started with open source monitoring with OpenTelemetry, as well as streamline integration testing.
We are excited to see community adoption of our image. There is currently an open PR in Red Hat’s Quarkus Java stack that will add grafana/otel-lgtm as a Quarkus extension. This will make it even easier to get started with OpenTelemetry and Grafana with Quarkus. If you have a project that could benefit from including grafana/otel-lgtm, please let us know. We are happy to help. You can reach us on GitHub or in the #OpenTelemetry channel in our Community Slack.
Our main objective is to keep grafana/otel-lgtm small and simple, so we don’t bloat the image with additional functionality. That said, moving forward, we will add more examples and dashboards, and keep the database versions up-to-date. If you have an example or dashboard that you want to see included in the github.com/grafana/docker-otel-lgtm repository, please create an issue or a PR.
We look forward to hearing from you!


