Removal of AngularJS support in Grafana: what you need to know
In Grafana 11, which will be released in preview in April and generally available in May, support for AngularJS will be turned off by default for all on-premise and cloud instances of Grafana. This will prevent any plugin that relies on AngularJS from being loaded and has the potential to significantly disrupt your dashboard experience.
In this blog post, I will explain what is happening, how to tell if you will be impacted, and provide guidance on how to migrate to supported data sources and visualization panels. Read on to ensure a smooth experience with Grafana 11.
Background
Grafana’s journey from AngularJS v1 to React has been a long one.
AngularJS v1 is an older frontend JavaScript framework for which active development stopped many years ago. Grafana Labs selected React as the successor to JavaScript based on both its features and popularity among the developer community at the time, which was essential for us to work with the greater open source community to expand the capabilities of Grafana. In Grafana v5 (2018), we began our migration of all Grafana components, and shortly thereafter in Grafana v6 we introduced the React-based platform for plugin development.
In Grafana v9, we formally deprecated support for AngularJS with the intent of removing it in Grafana v10, but that didn’t quite go as planned … We recognized that it was still too difficult for Grafana users to understand how they might be impacted, so we pushed back the removal by another year, and ramped up our efforts to better surface this dependency, hoping to reduce the chances of users being caught off-guard by the changes. We switched off AngularJS for new Grafana Cloud users, but left AngularJS enabled for existing users and self-managed distributions.
In Grafana 11, which will be generally available in May, we will turn off AngularJS by default in all cloud, open source, and Enterprise instances.
Plugins: updated catalog
Grafana benefits from its wonderful community of users, contributors, and plugin developers; the latter of whom have brought hundreds of powerful visualizations and data sources into the ecosystem that support use cases we never could have imagined. Many of these features were developed in the early days of Grafana, when the project was much more limited in its capabilities. We never would have been as useful or successful had it not been for these contributions, and we are eternally thankful for them.
Today, the Grafana plugins catalog boasts more than 200 plugins from Grafana, our commercial partners, and our community. We provide numerous built-in data sources, visualizations, and our suite of Grafana Cloud applications to help you monitor anything: from Kubernetes clusters to power plants, or even a moon landing.
For plugin developers, we provide create-plugin—an open source tool to scaffold and update new apps, panels and data sources, as well as our new developer portal with tutorials and guidance, and a set of examples.
Many plugins joined us on the journey from AngularJS to React and remain available in the catalog to be enjoyed by millions of Grafana users across the globe. Others were in support of services which have waned in popularity or have been discontinued. And for some, the developers moved on or their priorities changed, and they were no longer able to maintain their projects.
Our recently established deprecation policy seeks to provide more clarity for both users and plugin developers around how we curate the catalog to ensure a positive user experience. Plugins depending on AngularJS with no communicated plan to migrate have been removed from the catalog. Delisting in this manner discourages further adoption, which would result in disruption for users of the plugin.
How to tell if you are using an Angular-based plugin
Since the release of Grafana v10, we have been introducing additional notices within Grafana itself to surface when a plugin has a dependency on AngularJS and/or has been deprecated from the catalog.
In dashboards
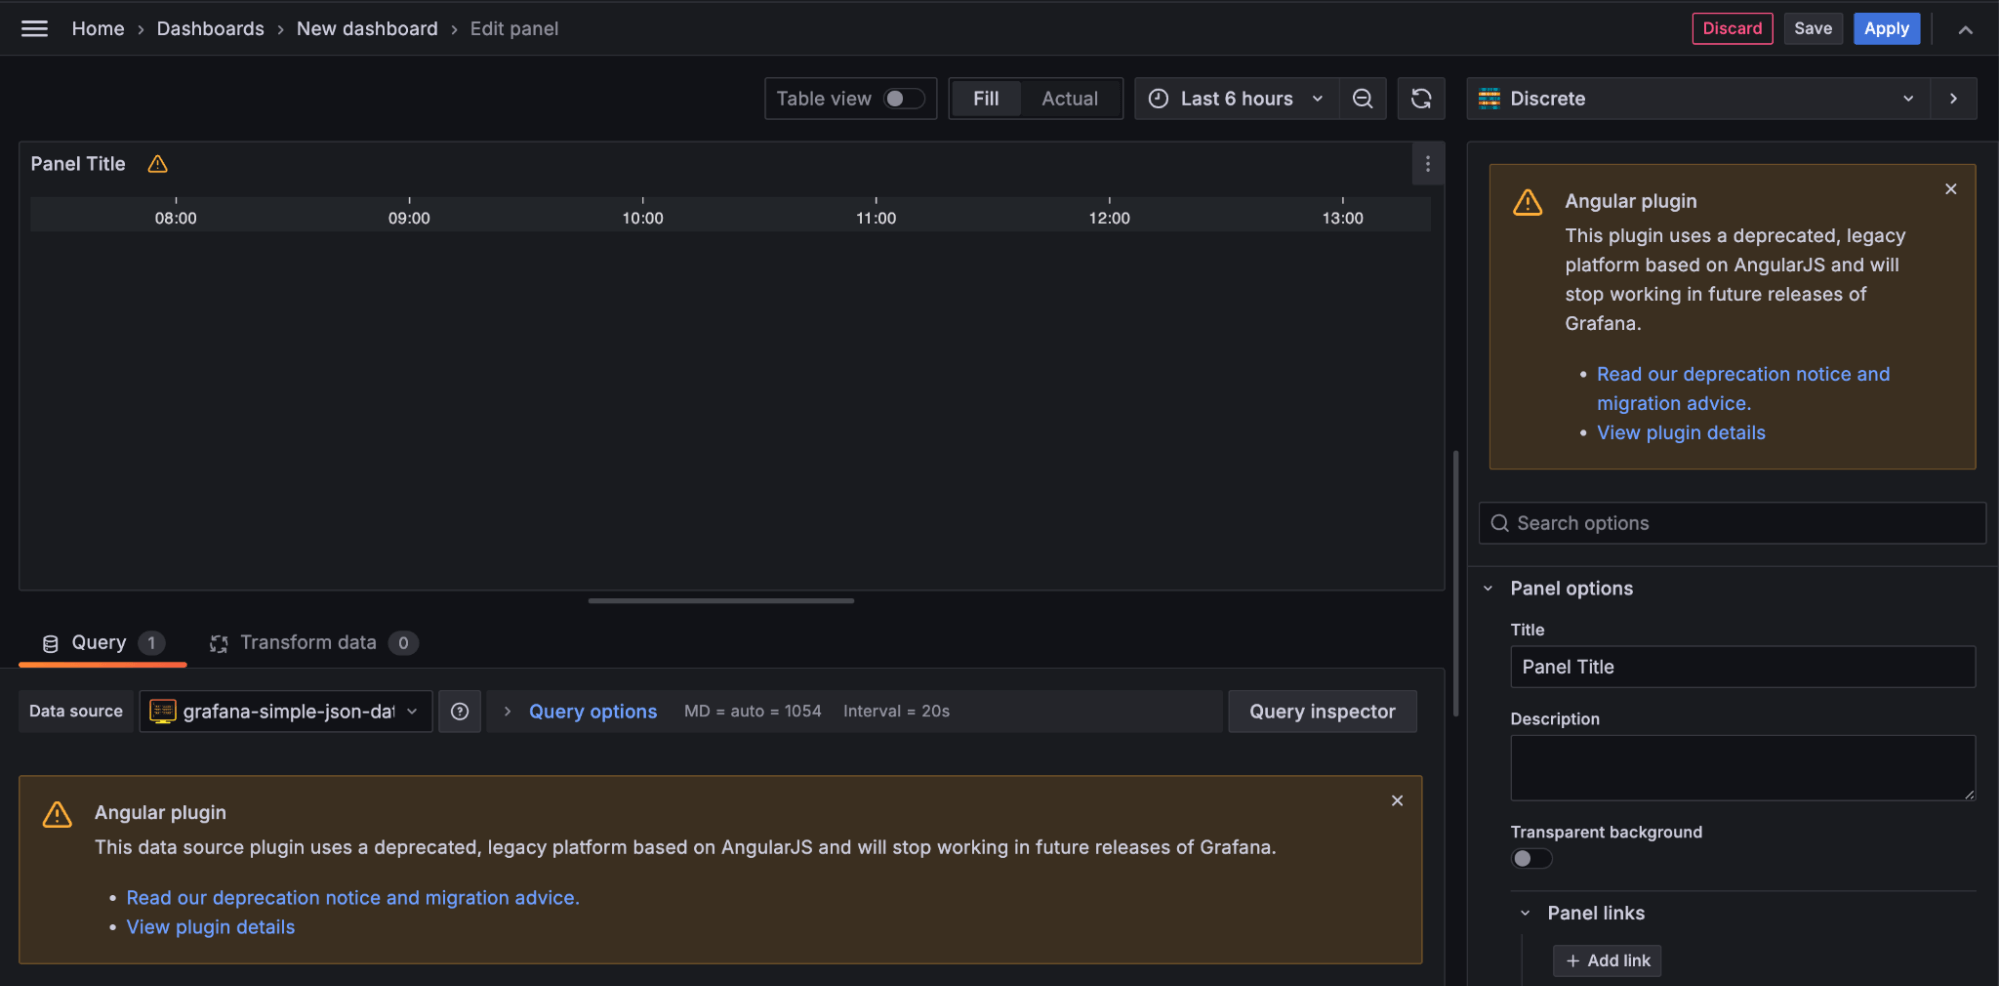
Starting with Grafana v10.1, a warning icon is displayed when editing a dashboard that uses an AngularJS panel plugin or data source, as shown below.

Additionally, as of Grafana v10.4, a warning banner is displayed at the top of a dashboard when there is any AngularJS plugin dependency, and warning icons are also displayed in the impacted panels.

On the Plugins page in Grafana
Note: This is applicable in Grafana V10.1 or later
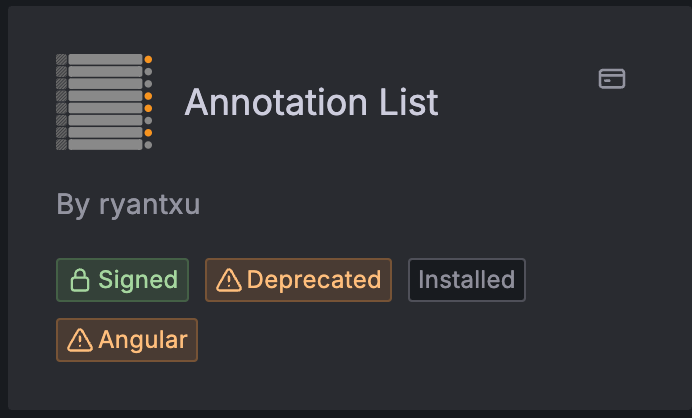
From the catalog view in Administration > Plugins and Data > Plugins, Grafana administrators can view which plugins are installed on their instance. Plugins that have a dependency on AngularJS or are deprecated display a warning icon as shown below.

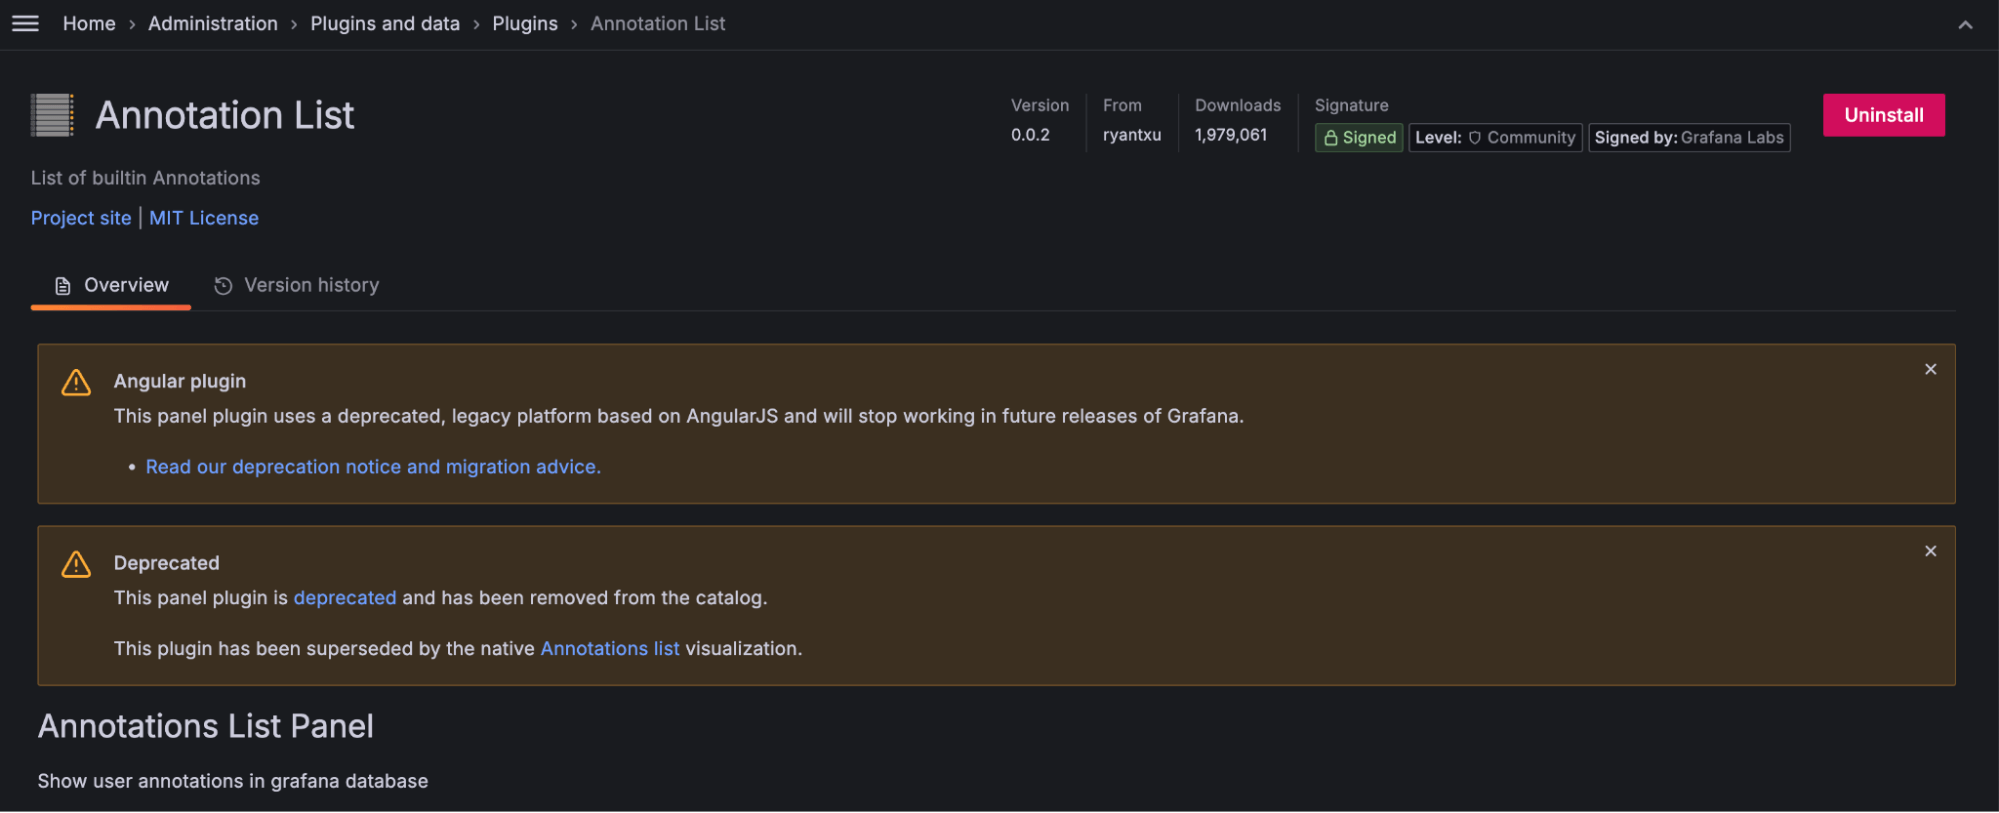
When you look at any given plugin’s detail page, it will display a warning as well as a deprecation message that can include specific migration advice as shown below.

In Grafana documentation
In the Grafana documentation, we list every plugin that has ever had a dependency on AngularJS.
We provide the minimum plugin version to update to if the plugin had been subsequently updated to React, as well as potential alternative plugins that can either replace the original plugin or provide similar functionality.

Listing all of your dashboards with a dependency on Angular
Alongside the warnings within Grafana itself, we created detect-angular-dashboards, a new open source tool that allows you to query a given Grafana instance for a list of all dashboards that have a dependency on AngularJS plugins—including any private plugins that you have created.
The tool requires a service account and API key and usage instructions can be found in the README.
GRAFANA_TOKEN=glsa_aaaaaaaaaaa ./detect-angular-dashboards http://my-grafana.example.com/api | tee output.json
2023/08/17 11:25:54 Detecting AngularJS dashboards for "http://my-grafana.example.com/api"
[
  {
    "Detections": [
      {
        "PluginID": "akumuli-datasource",
        "DetectionType": "datasource",
        "Title": "Panel two"
      },
      {
        "PluginID": "grafana-worldmap-panel",
        "DetectionType": "panel",
        "Title": "Angular"
      }
    ],
    "URL": "http://my-grafana.example.com/d/ef5e2c21-88aa-4619-a5db-786cc1dd37a9/angular",
    "Title": "Angular"
  },
  {
    "Detections": [
      {
        "PluginID": "grafana-worldmap-panel",
        "DetectionType": "panel",
        "Title": "World map panel"
      }
    ],
    "URL": "http://my-grafana.example.com/d/Y-RvmuRWk/datasource-tests-elasticsearch-v7",
    "Title": "Datasource tests - Elasticsearch v7"
  },
  {
    "Detections": [
      {
        "PluginID": "akumuli-datasource",
        "DetectionType": "datasource",
        "Title": "My panel"
      }
    ],
    "URL": "http://my-grafana.example.com/d/e10a098c-ad80-4d3c-b979-c39a4ce41183/new-dashboard",
    "Title": "New dashboard"
  }
]
Note: The detect-angular-dashboards tool requires you to upgrade to Grafana 10.1 or later to detect private plugins. Basic functionality is available in all versions of Grafana.
What to do if you’re using an AngularJS plugin
Check if you are running the latest version of a plugin. A large number of Angular-based plugins have been updated to React, and you can avoid disruption simply with an update. Be sure to check for any breaking change documentation in case there have been changes in the plugin between versions.
To update a plugin, go to the plugin’s detail page at Administration > Plugins and Data > Plugins > Plugin_name and click Update. Grafana Cloud users can also update all plugins at once by going to their instance details page on grafana.com.
Search for the plugin in our documentation to find any available migration advice. If none exists, browse for the most suitable alternative based on your use case in our visualizations, data sources, and plugins catalog.
Start your migrations. Once you know how you are impacted, prioritize your most important impacted dashboards. If using Grafana Enterprise or Grafana Cloud, you can use usage insights to help with this prioritization. Then edit the affected panels to use an alternative plugin.
Try removing AngularJS support on your instance prior to Grafana 11 to verify everything is working as expected—the ultimate test. This can be done by adding the configuration parameter
angular_support_enabled=false, or for Grafana Cloud users, by contacting Grafana support.
How to migrate from an AngularJS plugin
For certain core Grafana plugins (built-in visualizations that do not require installation), automatic migration is possible. This will occur when AngularJS support is removed from an instance, if it is manually invoked in the panel editor; or by enabling the feature toggle autoMigrateOldPanels. For the latter you will need to save the change to persist the new plugin ID in the dashboard.json.
Automatic migration is supported for the plugins shown in the following table. Each of the target plugins are also included in Grafana and don’t require installation.
| Plugin | Migration target |
|---|---|
| Graph (old) | Time series |
| Singlestat | Stat |
| Stat (old) | Stat |
| Table (old) | Table |
| Worldmap | Geomap |
However, in the majority of cases, migration is a manual process. For data sources you will need to install (if required), configure an appropriate data source, then select it within a query editor for a dashboard panel. Similarly, panel plugins will need to be installed (if required), selected as the chosen visualization, then configured as appropriate to display your data.
Even when automatic migration is possible, we would strongly encourage you to try to migrate before AngularJS support is turned off in Grafana 11, in order to verify everything continues to work as expected. In particular, depending on the use case, the most suitable replacement for the legacy graph panel may be the time series, bar chart, or histogram visualization.
What happens when AngularJS support is removed?
If a plugin has a dependency on AngularJS support that is not available on a Grafana instance, the plugin will fail to load. It will not appear as installed in the catalog, no previously configured data sources will show in the data sources list, and any dashboard panels that require the plugin will display a warning message such as: Error loading: plugin_name or Panel plugin not found: plugin_name.

Plugins that automatically migrate to their React replacements will be loaded instead.
Configuration is not lost. The dashboard.json remains intact and can be edited to use an alternative plugin. If the removal of AngularJS support is temporary via feature toggle, and you re-enable support, then all the configured data sources will reappear and dashboards will work again.
When is support for AngularJS being removed?
In Grafana 11, which will be released in preview in April and generally available in May, support for AngularJS will be turned off by default for all Grafana Cloud users and self-managed (OSS and Enterprise) installations.
New Grafana Cloud users will be unable to request for AngularJS support to be added to their instance. Self-managed users will be able to re-enable support through the angular_support_enabled=true configuration parameter, but this is highly discouraged given the impending removal.
In Grafana 12, support for AngularJS will be completely removed alongside the config parameter toggle.
What’s next for Grafana plugins
Deprecations of this scale are never easy. We’ve had to say farewell to a number of great plugins from the community, and we know that some level of disruption is inevitable for users of Grafana.
However, the future is bright. The catalog continues to expand with exciting new plugins such as the variable panel and the funnel panel. Our tooling and platform has evolved to make plugins even more powerful — such as with the new Scenes framework, as well as simplifying their development and maintenance with the create-plugin tool. Even using plugins is getting easier, such as the recent improvements in Grafana Cloud to manage their lifecycle from directly within Grafana.
So to reiterate:
- Check for any dependency on AngularJS plugins via in-product warnings and use of our tooling.
- Review the guidance to update or migrate as appropriate.
- Plan for the removal of AngularJS support by default in Grafana 11 to avoid surprises.
Grafana Cloud is the easiest way to get started with metrics, logs, traces, dashboards, and more. We have a generous forever-free tier and plans for every use case. Sign up for free now!


