
The Golden Grot Awards are back: Vote for your favorite dashboard
The Grafana community knows a thing or two about what goes into a great dashboard. But what constitutes a truly great dashboard can be subjective, which is why we need your help.
After a fantastic inaugural run, The Golden Grot Awards are back for a second year, recognizing the very best in professional and personal Grafana dashboards. We received tons of great submissions, and our expert judges narrowed the field down 10 finalists. Public voting is now open and the grand prize winners in each category will join us in Amsterdam to be celebrated on stage at GrafanaCON.
Voting closes on Friday, March 1, so you don’t have much time to weigh in. Go to the Golden Grot Awards webpage to cast your vote, and continue reading to get a recap of all the finalists’ great work.
Personal dashboards
Ruben Fernandez: monitors daily commute in Atlanta
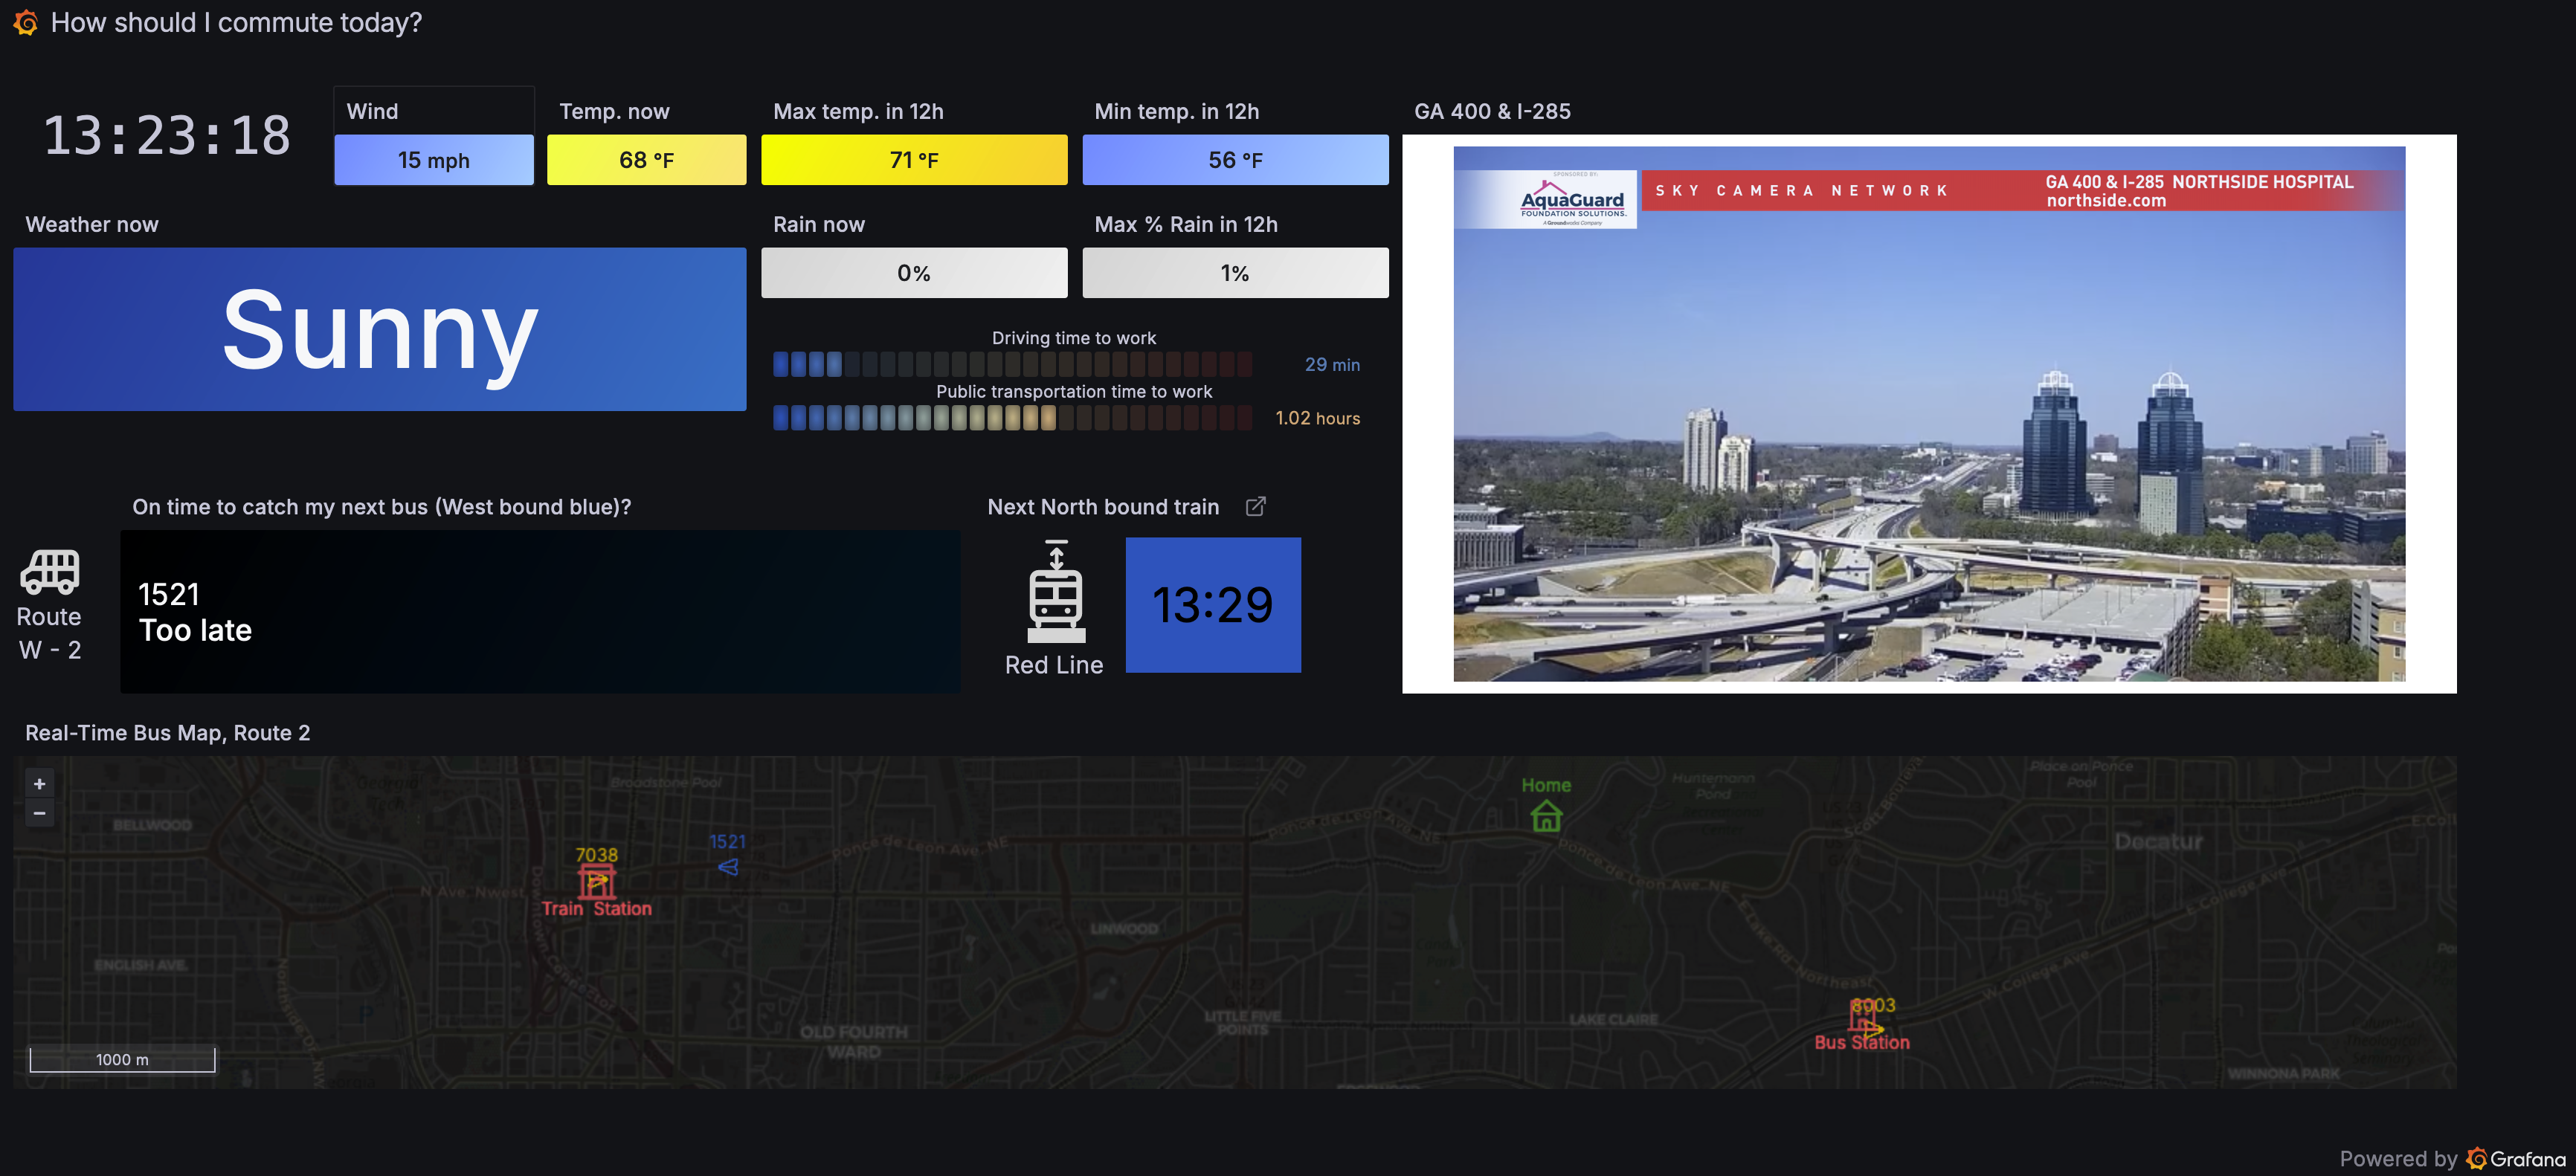
Ruben Fernandez built his dashboard to improve his daily commute in Atlanta, which can be drastically impacted by inclement weather and heavy traffic. He uses APIs and GTFS realtime feeds to pull in data from weather.gov, the Metropolitan Atlanta Transit Authority, and drive time and traffic information from Google Maps and Bing Maps. He also uses a Prometheus instrumentation library for Python to combine metrics and send them to Grafana Cloud via Grafana Agent.
“Instead of manually looking up information, Ruben has created an amazing dashboard that compiles all of this information and provides a great overview and support in making commuting an easier and more data-driven decision,” one of our judges said. “I would recommend creating a similar dashboard to anyone who commutes to work daily.”
Andreas Rahimic Andersen: tracks Counter-Strike video game stats

Andreas Rahimic Andersen uses his dashboard to track his usage of the popular video game series Counter-Strike. He tracks matches, metrics, and game stats, and he plans to use it in the future for tournaments. The data is sent from an OSS project called CS Demo Manager to a PostgreSQL database and then to Grafana. He’d seen similar sites that could track games, but he wanted to run it locally — and he wanted a challenge.
“I’m really proud that it’s gotten a lot of attention and people like it,” Andreas said. “I’m also proud that it shows that you can use Grafana for funny projects like Counter-Strike data.”
Asep Supriyadi: BI dashboard for shipping analytics

Asep Supriyadi built a personal BI dashboard for shipping analytics, with panels breaking down everything from order by country to total profit and loss. He installed Grafana on a virtual private server, and he was inspired to show that Grafana can be used for more than just monitoring infrastructure, and that you can do it without lots of money.
“What makes me proud is when I become a person who is useful to many people,” Asep said. “Through this dashboard, people can gain valuable insights into how BI dashboards are created on the Grafana platform.”
“The dashboard is very well designed — it’s beautiful to look at — and uses many different types of visualizations and plugins to extend the capabilities of our panels. I love the use of ‘inline variables,’” said one judge.
Amar Bin Lokman: tracks water quality in different environments
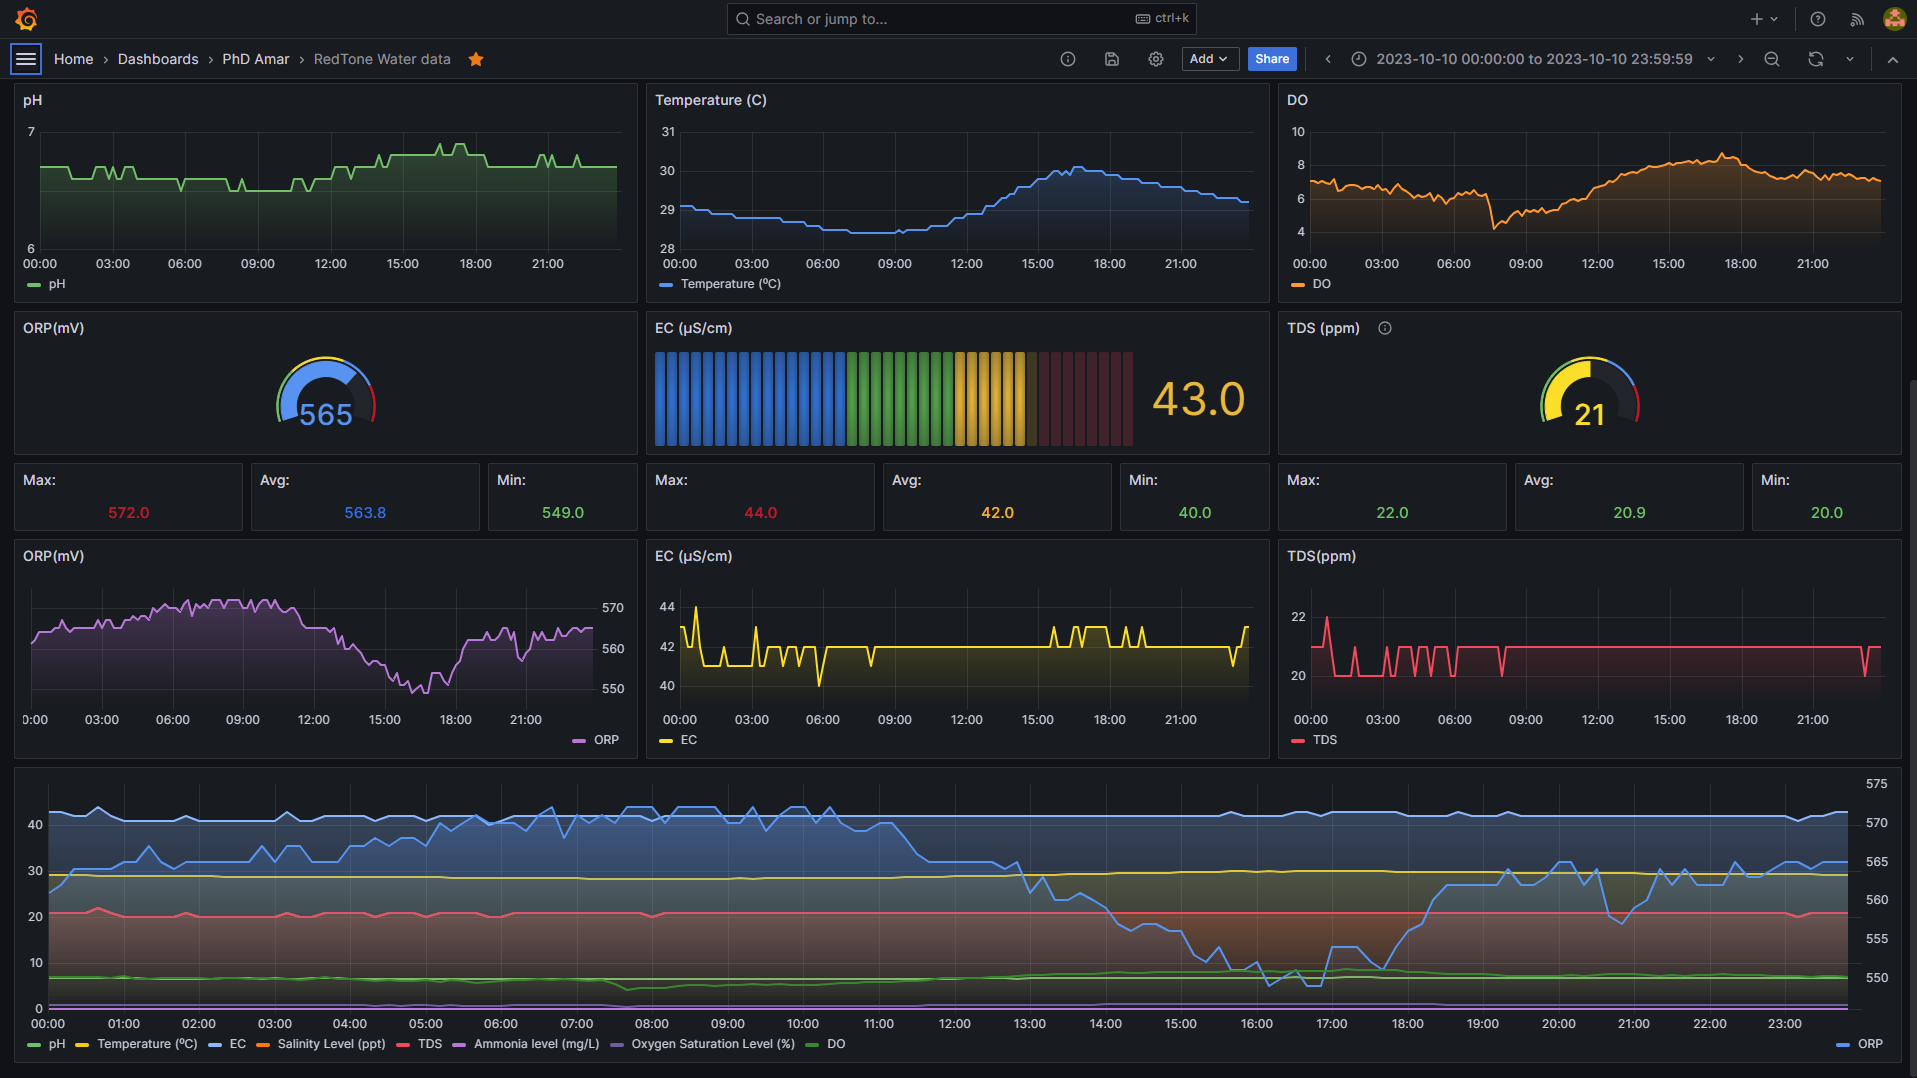
Amar Bin Lokman built his dashboard to monitor water quality in settings such as municipal water systems, industrial processes, aquaculture facilities, and environmental monitoring sites. He uses a variety of sensors to track pH levels, turbidity, dissolved oxygen, and more. That data is transmitted to a central database and it’s displayed in Grafana where he can monitor everything in real-time or analyze historical trends to drive informed decision-making and improve operational efficiency.
“I’m proud of this project because it addresses a critical need for ensuring the safety and sustainability of water resources, which are vital for human health, environmental well-being, and economic prosperity,” Amar said.
Josh Gitlin: monitors temps around the house
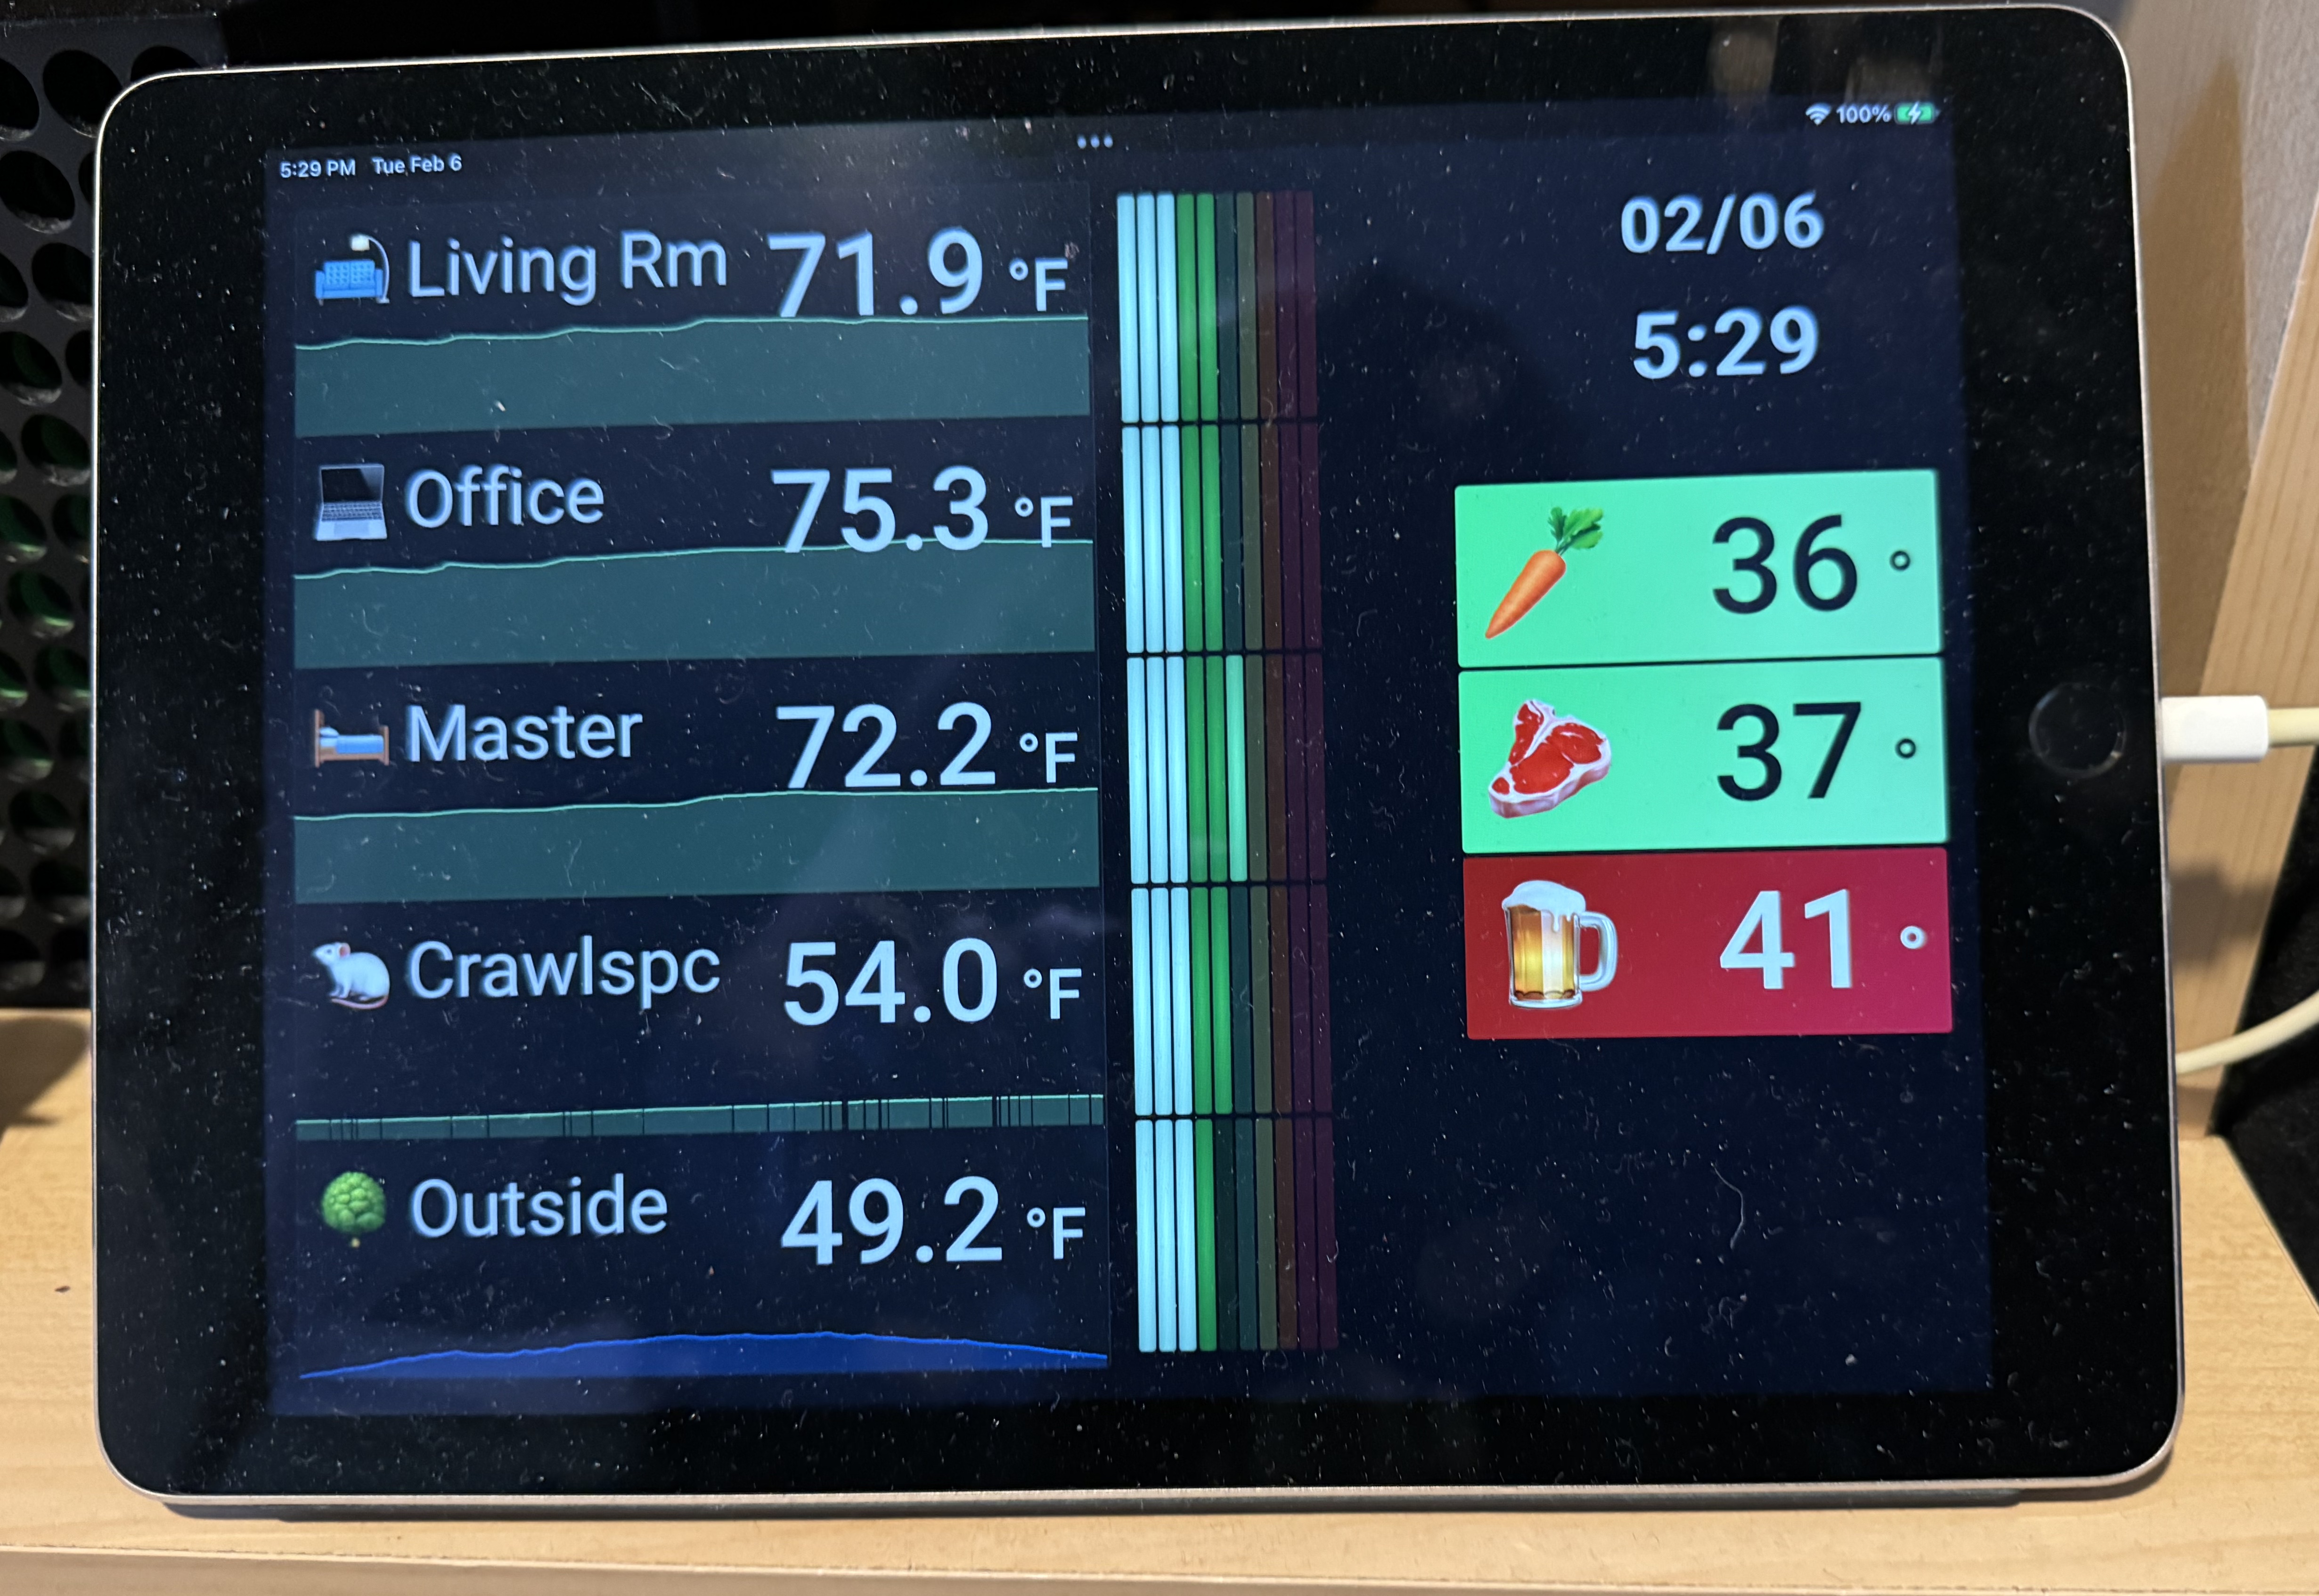
Josh Gitlin’s dashboard monitors temperature around his house and inside his refrigerator using Gove sensors. He was inspired to create the dashboard to replace an indoor/outdoor thermometer and to compensate for unreliable temps in his fridge. It has helped him save food from spoiling and avoid the pipes in his crawl space from freezing. He says his husband, who isn’t an engineer, also gets peace of mind from the easy-to-use dashboard.
“It was a lot of fun,” Josh said. “It can be done with low skill (the devices are bluetooth and the code is open source) and it shows how Grafana can be used beyond software operation teams, in the home, for an application everyone can understand.”
“Josh’s dashboard truly resonates with me, shining a light on the critical issue of food waste through a personal lens,” said one judge. “I’m genuinely inspired by his dedication and the potential impact of his work.”
Professional dashboards
Christopher Field: monitors defects in steel alloys
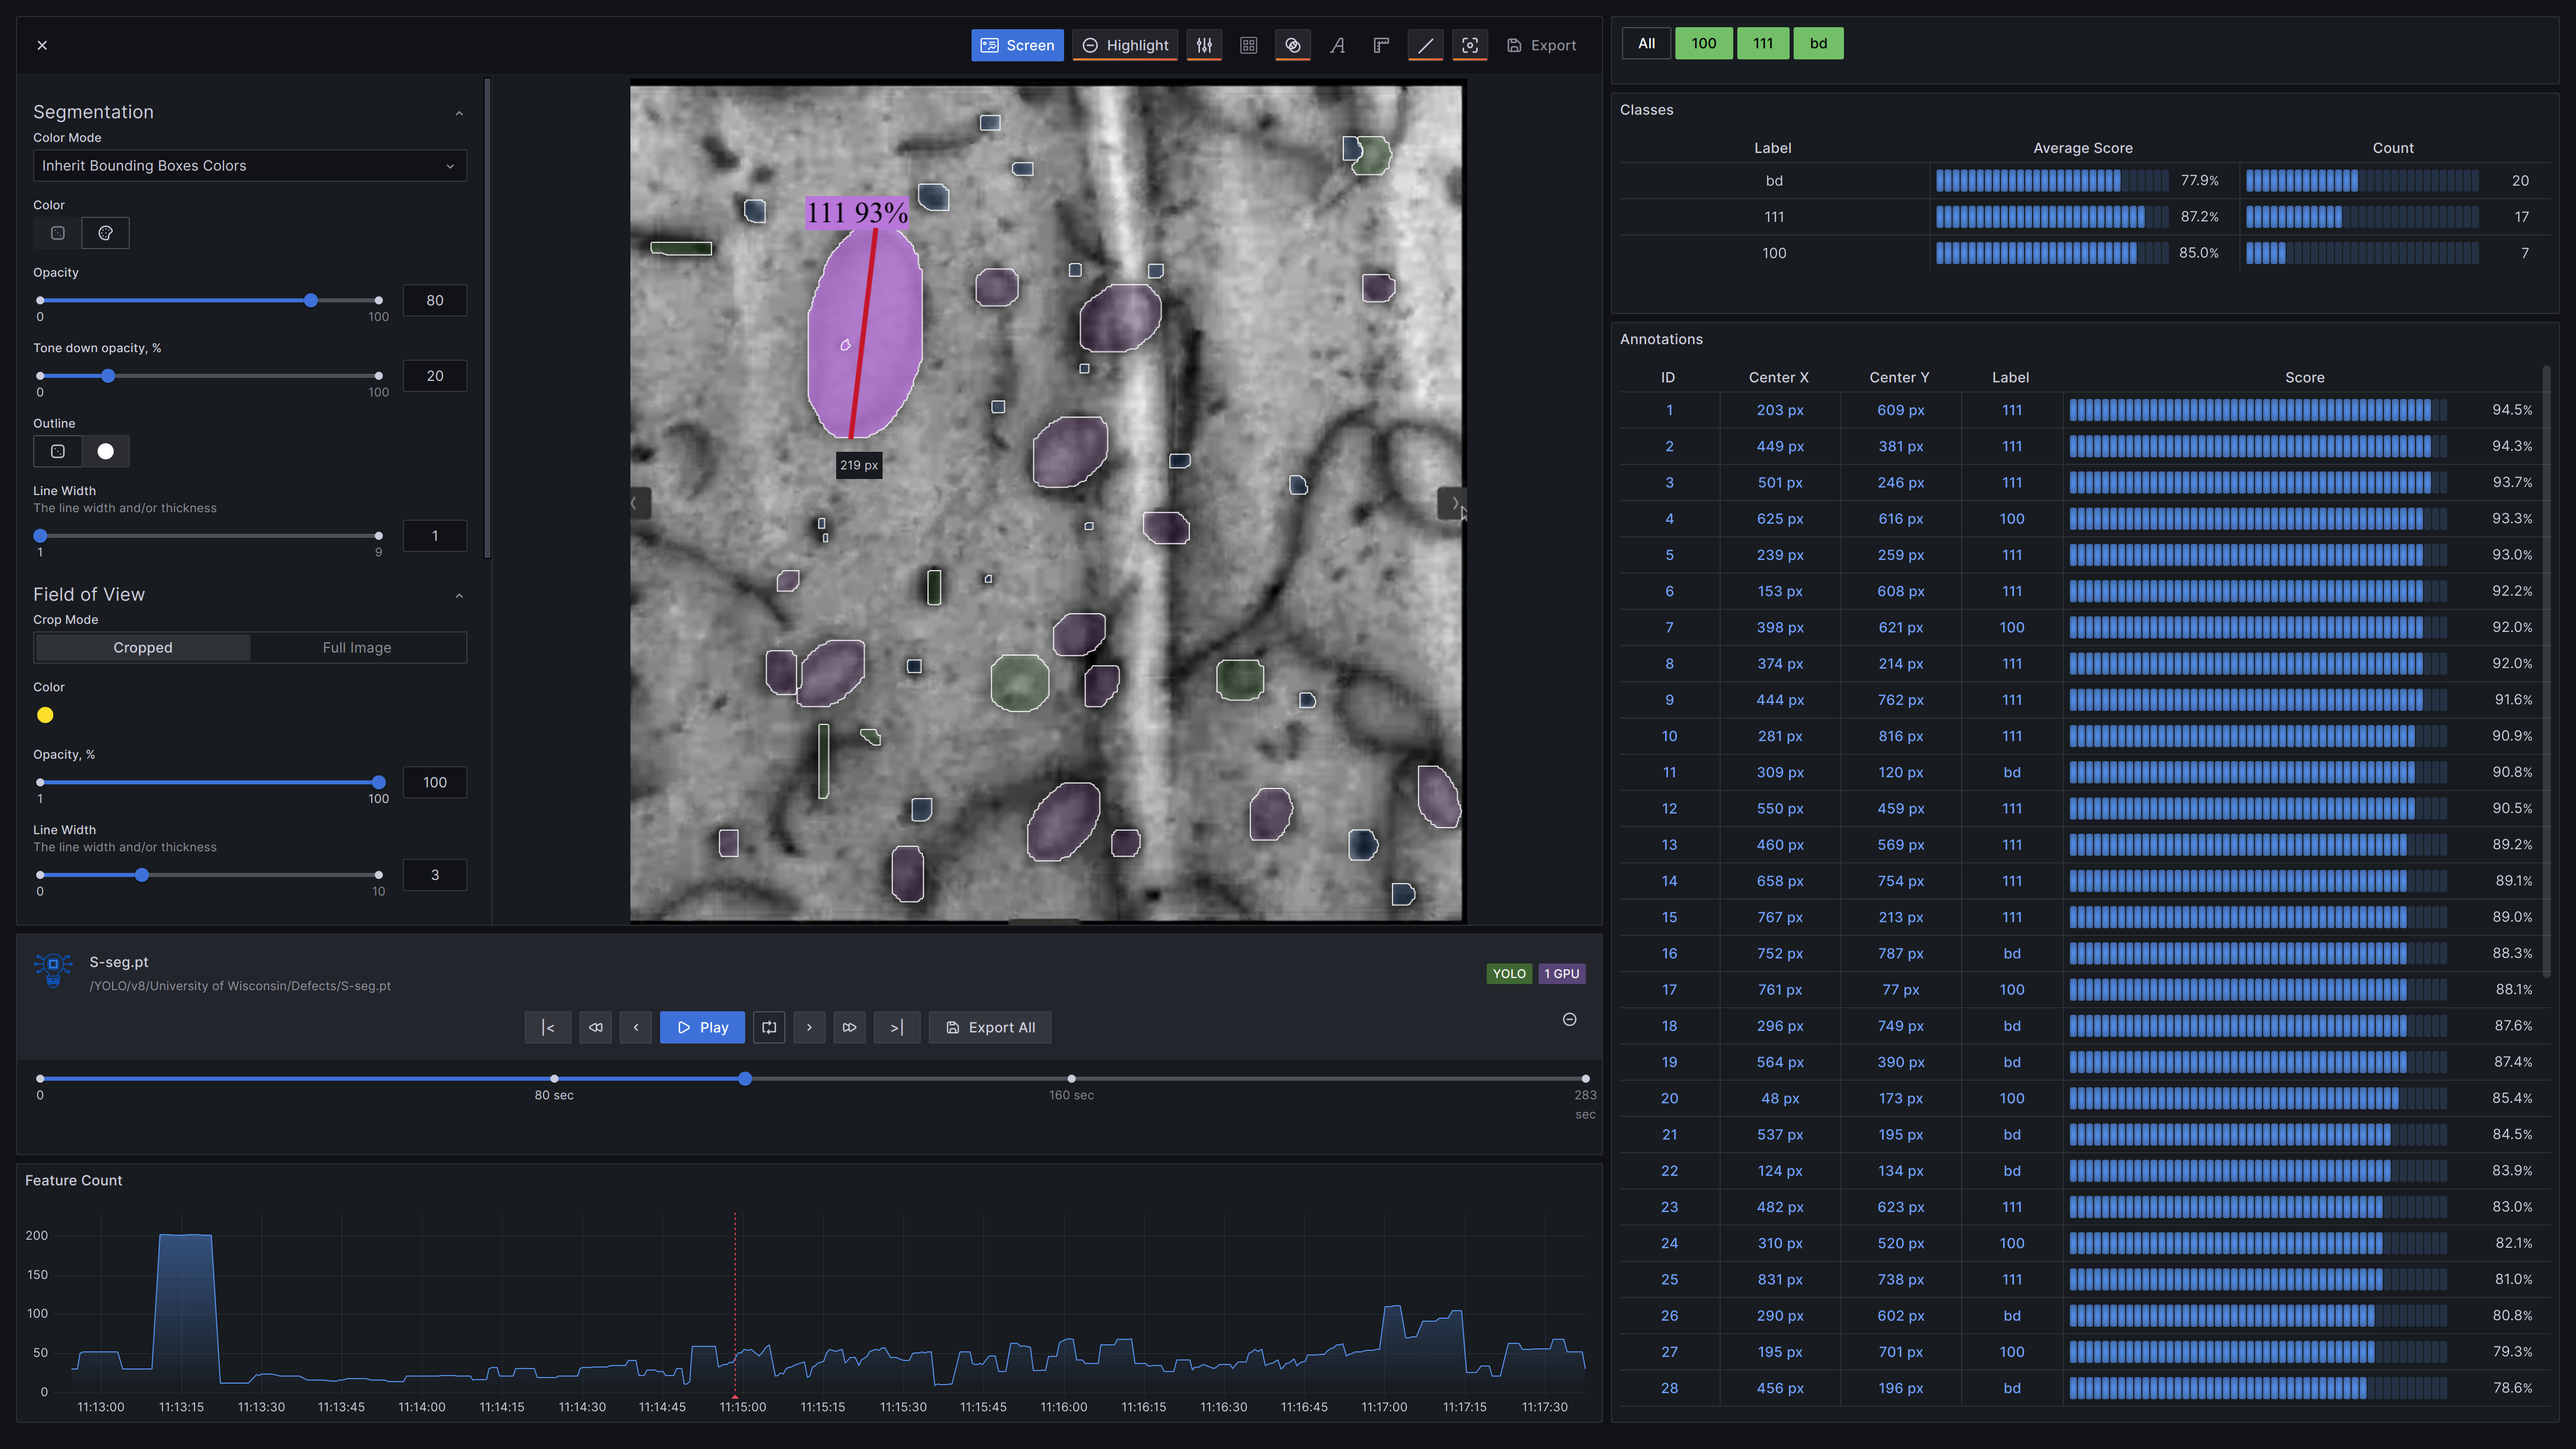
Christopher Field’s dashboard monitors the growth of defects in steel alloys caused by exposure to radiation for next-generation nuclear fission reactors and fusion energy. Images from electron microscopes are streamed to a time series database and machine learning models are used to instantly identify defects. The dashboard is shared internally, and other variations are used by US Department of Energy (DOE) national laboratories and research universities.
With the technology displayed in Grafana, scientists, engineers, and researchers are saving up to 80% of the time it used to take to determine the suitability of an alloy. He said he’s most proud of how scientists and engineers light up when interacting with the data.
“A light bulb goes off, and the flood gates open to new ideas and new experiments that can be conducted because they are getting their results faster and not having to lose weeks to drawing boxes around black dots,” Christopher said.
Satoshi Takano: shows athletes’ cognitive test results
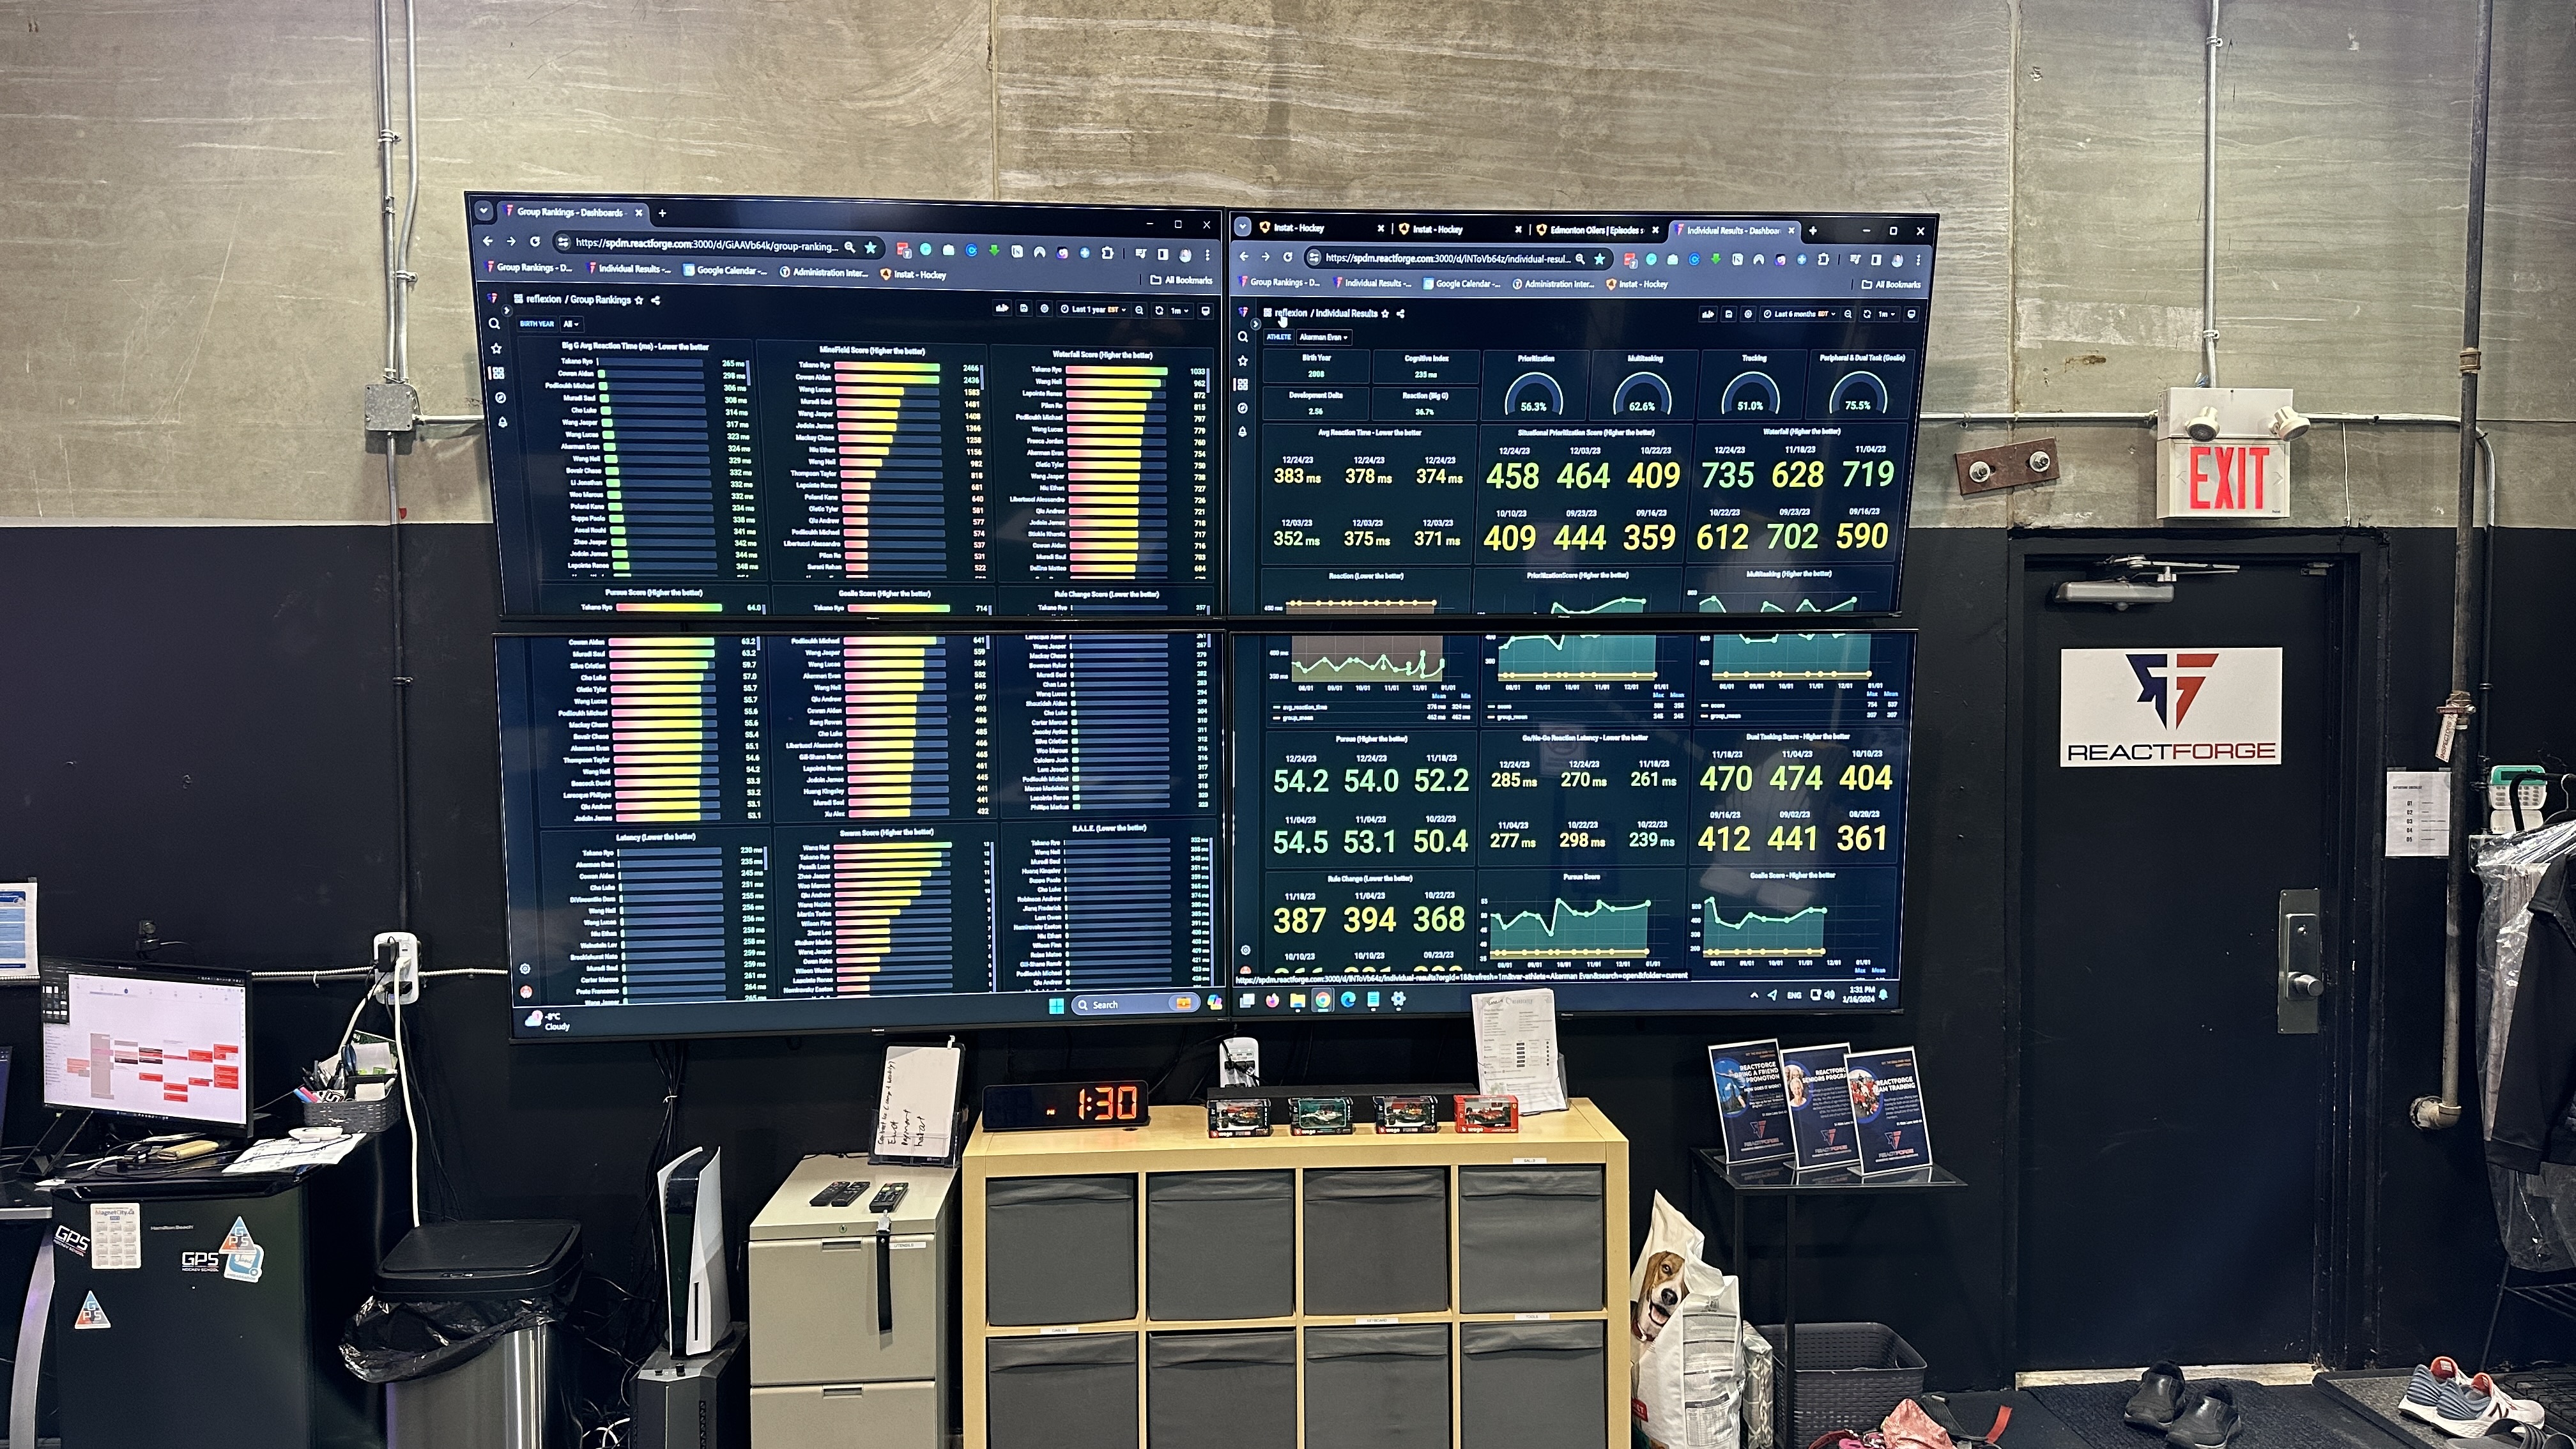
Satoshi Takano’s dashboard tracks the results of cognitive tests for elite athletes. Tests are conducted weekly, and the results are used to design training plans for the athletes. They pull data from three training platforms, and they currently have approximately 13 million data points they collect and store for their athletes. The dashboard is the centerpiece of their facility, helping to create a “wow experience” for everyone who comes in.
“We are able to empower the athlete to think faster in their game, so that the entire world feels slower to them,” Satoshi said. “The numbers they generate evokes confidence and control that they really want in their game.”
“This tool empowers athletes and their supporters to grasp cognitive improvements visually, which is innovative and deeply impactful,” said one judge. “I’m excited about the potential for this project to inspire and transform even more lives in the sports community.”
Varun Bhaaskar: assesses the health of multiple apps

Varun Bhaaskar’s dashboard keeps tabs on different applications so anyone in support or senior management across the organization can quickly gauge what’s going on. The top panels describe overall health for different infrastructure components and the four golden signals. Lower down there are KPI sections for information on incidents and change requests, as well as panels that provide snapshots of various metrics and error logs.
They’ve used templates to reduce their dashboards by 70%. They’ve also seen faster adoption, improved performance, and a 40% reduction in MTTR.
“Even though a lot of thought process and effort went behind building this dashboard, it can provide huge dividends by being a breeze to configure an application team to adapt to this dashboard. The ability of this dashboard to provide crisp information with appropriate drilldowns is amazing,” Varun said.
As one judge put it: “Varun’s dashboard is beautifully designed, enabling anyone in the organization, from developers and support teams to senior management, to quickly assess the status of the applications at a glance.”
Wilson Acero: monitors volcanic earthquakes
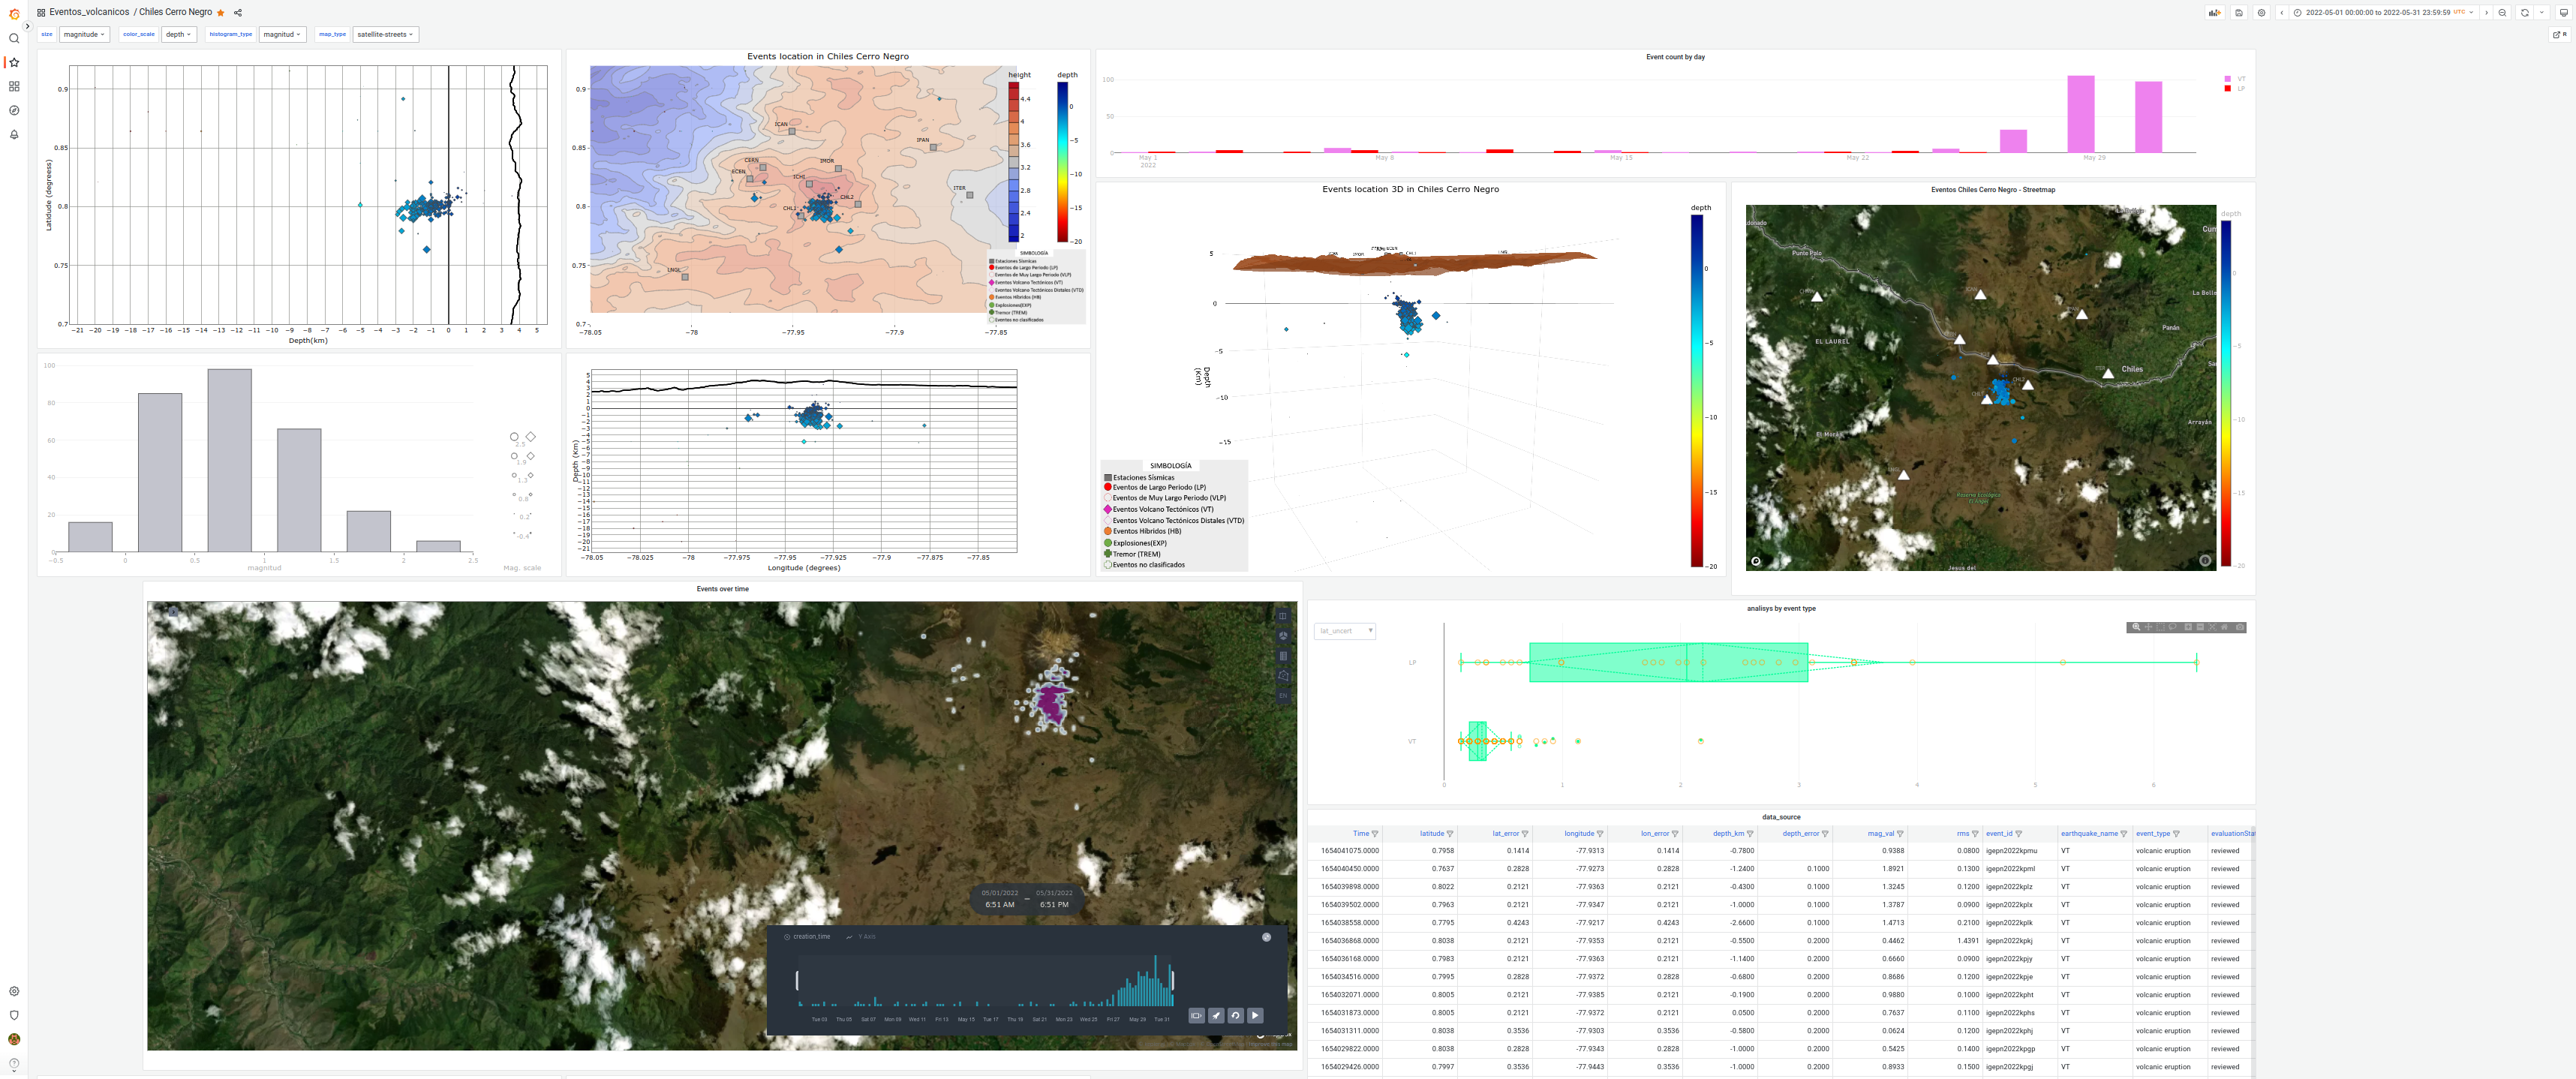
Wilson Acero’s dashboard monitors earthquakes that occur in Cotopaxi, Chiles-Cerro Negro, and other volcanoes. He uses Grafana and the Plotly panel plugin to retrieve data from a MySQL database, and users can visualize any period of volcanic activity since 2012 to check information about the number of earthquakes, magnitudes, and possible errors committed by automatic or manual processing. So far, they’ve detected and corrected around 100 errors and improved operator performance by showing mistakes in real time.
“It makes me proud to show interactive 2D and 3D maps and replace 2D static maps on PDF,” Wilson said. “Now the earthquake information is not only stored in a MySQL database but anyone at IGEPN can access and visualize it.”
Martin Olsson: driver interface for a hydrofoiling passenger ferry
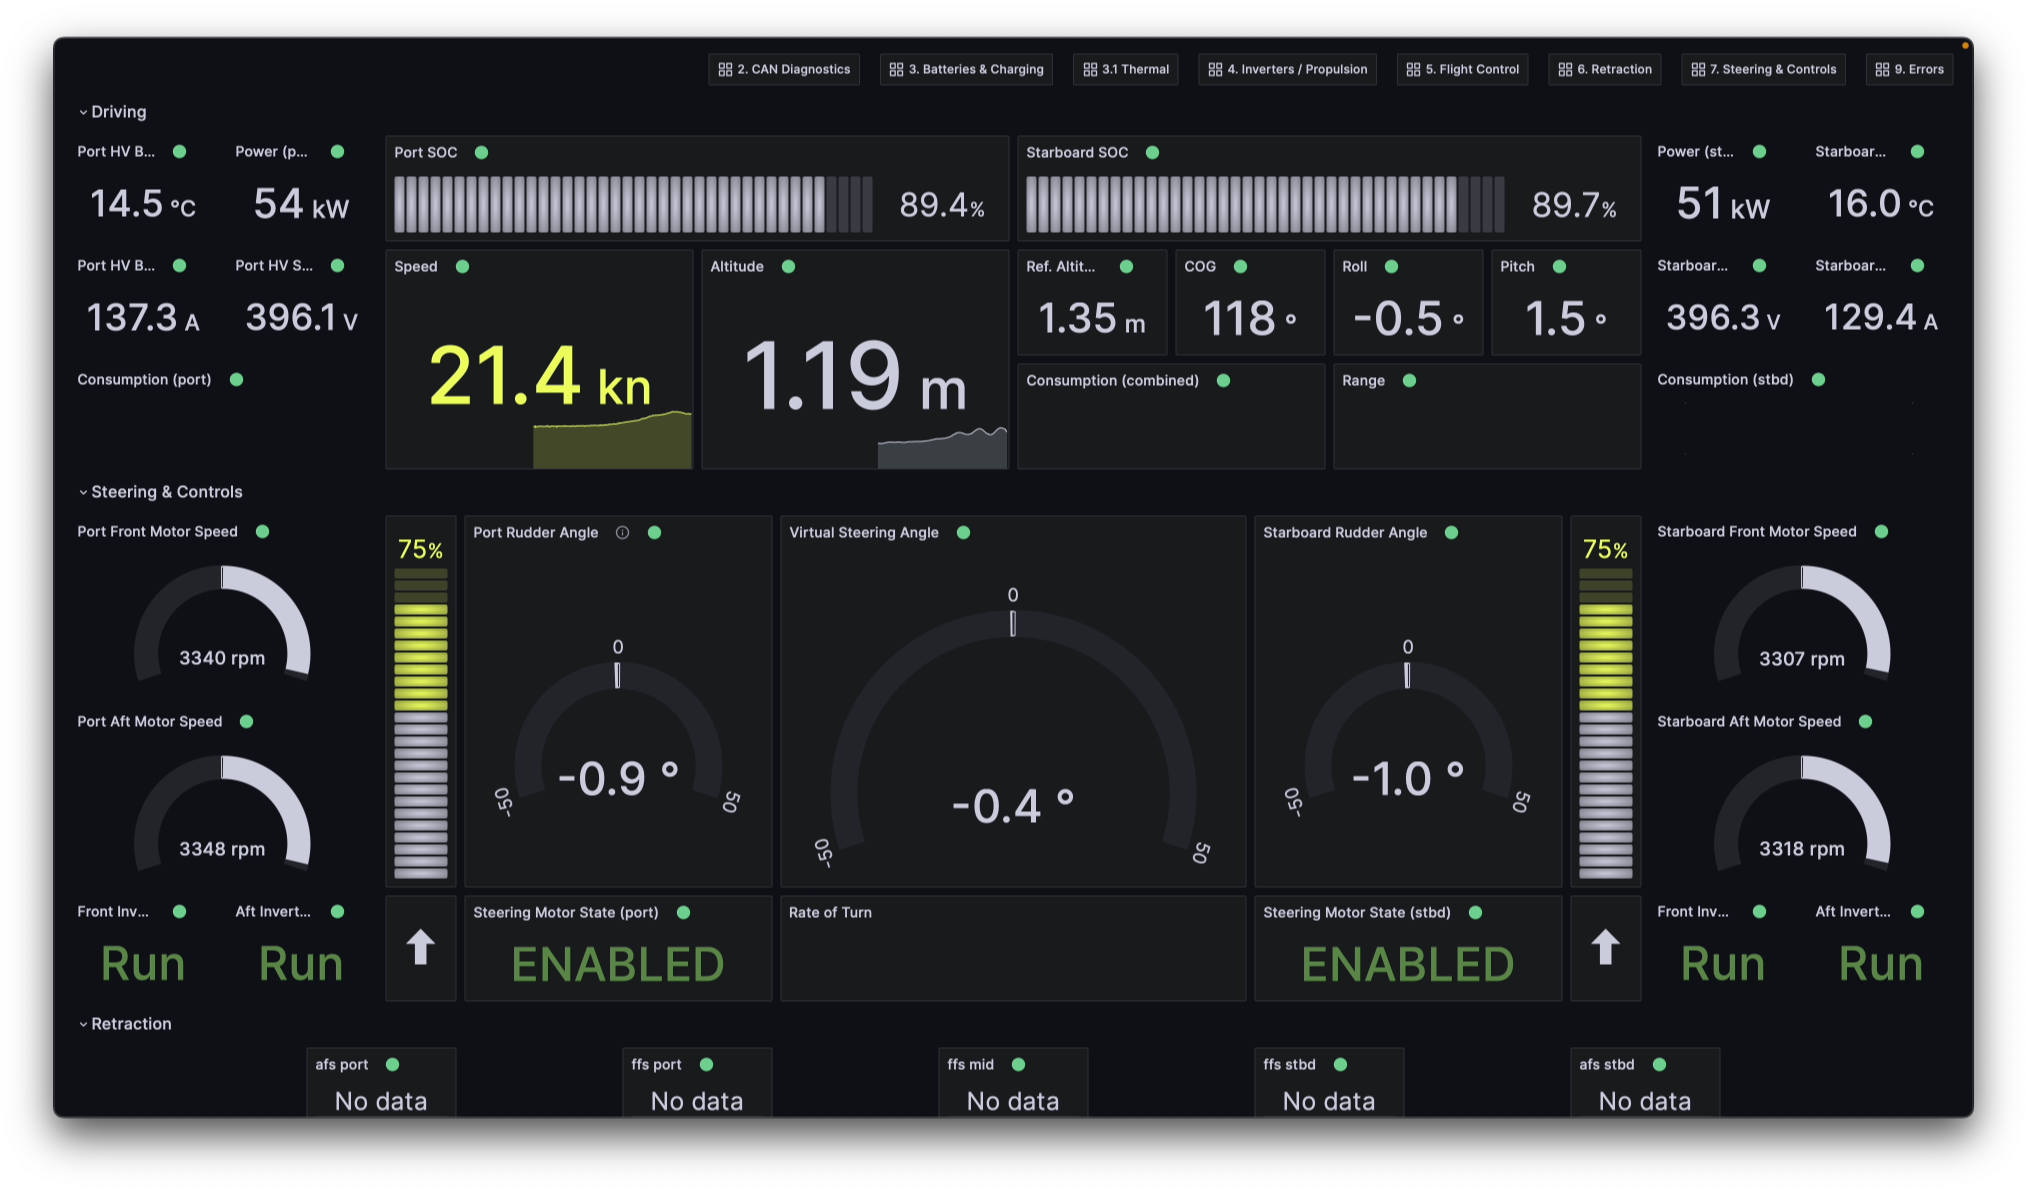
Martin Olsson’s dashboard is actually the driver interface for Zero, a prototype of the Candela P-12 electric hydrofoiling passenger ferry. It shows vital real time information from the propulsion, flight controls, steering and other systems. There are also more detailed dashboards to track both real time data, as well as provide historical data for later analysis.
The information is collected from five different data sources and sent to Grafana over MQTT. It’s then logged to InfluxDB and Grafana Loki, and the Grafana instance runs locally on the boat and data is mirrored to the cloud for later analysis. With this setup, they’re able to analyze thousands of 100 Hz telemetry points with ease so they can fine-tune the boat for safety, performance, and reliability.
“Grafana has been invaluable for rapid prototyping of the user interface of the P-12 electric ferry,” Olsson said. “We have been able to iterate quickly on the UI, and all R&D teams have been able to build their own detailed dashboards.”
“I found this use case interesting, especially how the designer and dev team used Grafana as a sort of design system to develop the dashboard,” said one judge. “The setup also seems pretty complex with many data sources.”
Grafana Cloud is the easiest way to get started with metrics, logs, traces, dashboards, and more. We have a generous forever-free tier and plans for every use case. Sign up for free now!


