How the open source Caddy server uses Grafana Cloud for full-stack observability
Mohammed Al Sahaf serves as Technical Product Manager at Samsung Electronics Saudi Arabia. Outside his day job, he serves with the Caddy team to tackle the web of problems facing web servers in the third millennium. Mohammed is the author of Kadeessh, formerly caddy-ssh, and the maintainer of numerous Caddy modules. When he isn’t programming, he is trying to catch up on life and sleep with the help of coffee. You can find his caffeinated wonders at caffeinatedwonders.com.
As maintainers of the OSS project Caddy server, we know the value of end-to-end observability, in terms of accelerating root cause analysis and reducing MTTR. But rather than do all the undifferentiated heavy-lifting to manage an observability stack, my team wants to dedicate as much time as possible to our core mission: developing and optimizing our open source project.
These were some of the biggest reasons behind our recent migration to Grafana Cloud.
In this blog post, I’ll take a closer look at why the Caddy team chose Grafana Cloud as an observability solution, and how it’ll help us advance the Caddy project, moving forward.
Get a free Grafana Cloud Pro account for your OSS project
Full-stack observability is essential for any OSS project to progress and thrive. That’s why Grafana Labs — a company with open source software in its DNA — offers a free Grafana Cloud Pro account to maintainers of OSS projects like Caddy. Interested in receiving your Cloud Pro account? You can reach us at community@grafana.com.
Our path to Grafana Cloud
Caddy, an extensible web server written in Go, is known as the first generally available HTTP/2 server. Caddy’s flagship features include automatic HTTPS/TLS procurement and management through the ACME protocol, as well as robust OCSP stapling.
When Caddy launched in 2015, users could create a one-of-a-kind, on-demand Caddy build, using a custom set of plugins through the download page. This custom builder withstood the test of time, as demand for Caddy grew. The “buildworker,” as the Caddy dev team calls it, was rewritten shortly after the GA of Caddy v2 in 2020. The rewrite was to accommodate a new module structure and build flow using xcaddy, a convenient library and tool to generate custom Caddy builds, under the hood. The new version had been functioning with minimal complaints — until early 2023.
At this point, we started to hear about unresponsive download requests and the download page failing to build the requested custom Caddy build. We were relying on our cloud provider’s dashboard to monitor server health, and would manually comb through journald to identify and troubleshoot issues, as needed. The cloud provider’s dashboard provided a high-level view of server resource utilization, but didn’t offer deep insights into the applications running on the server.
The absence of a unified and user-friendly interface for log inspection also made it cumbersome to troubleshoot when away from the keyboard, to share interesting log lines with team members, and to trace problematic requests across service boundaries. To make matters worse, this was reactive: end users needed to tell us, so we couldn’t act on or resolve issues proactively, due to a lack of alerting. Recognizing these growing pains, we knew we needed a more mature observability solution for our infrastructure.
So in March 2023, we connected with Grafana Labs, and learned they have a program through which they offer a free Grafana Cloud Pro account to OSS project maintainers (a special shout-out here to Dave Henderson, a fellow member of the Caddy project and a senior software engineer at Grafana Labs, who helped us discover this program). This Grafana Cloud Pro account enabled several Caddy project maintainers to monitor our infrastructure and, after experimenting with the dashboards provided by the Linux Server integration, we found value almost immediately.
Faster root cause analysis with Grafana Cloud
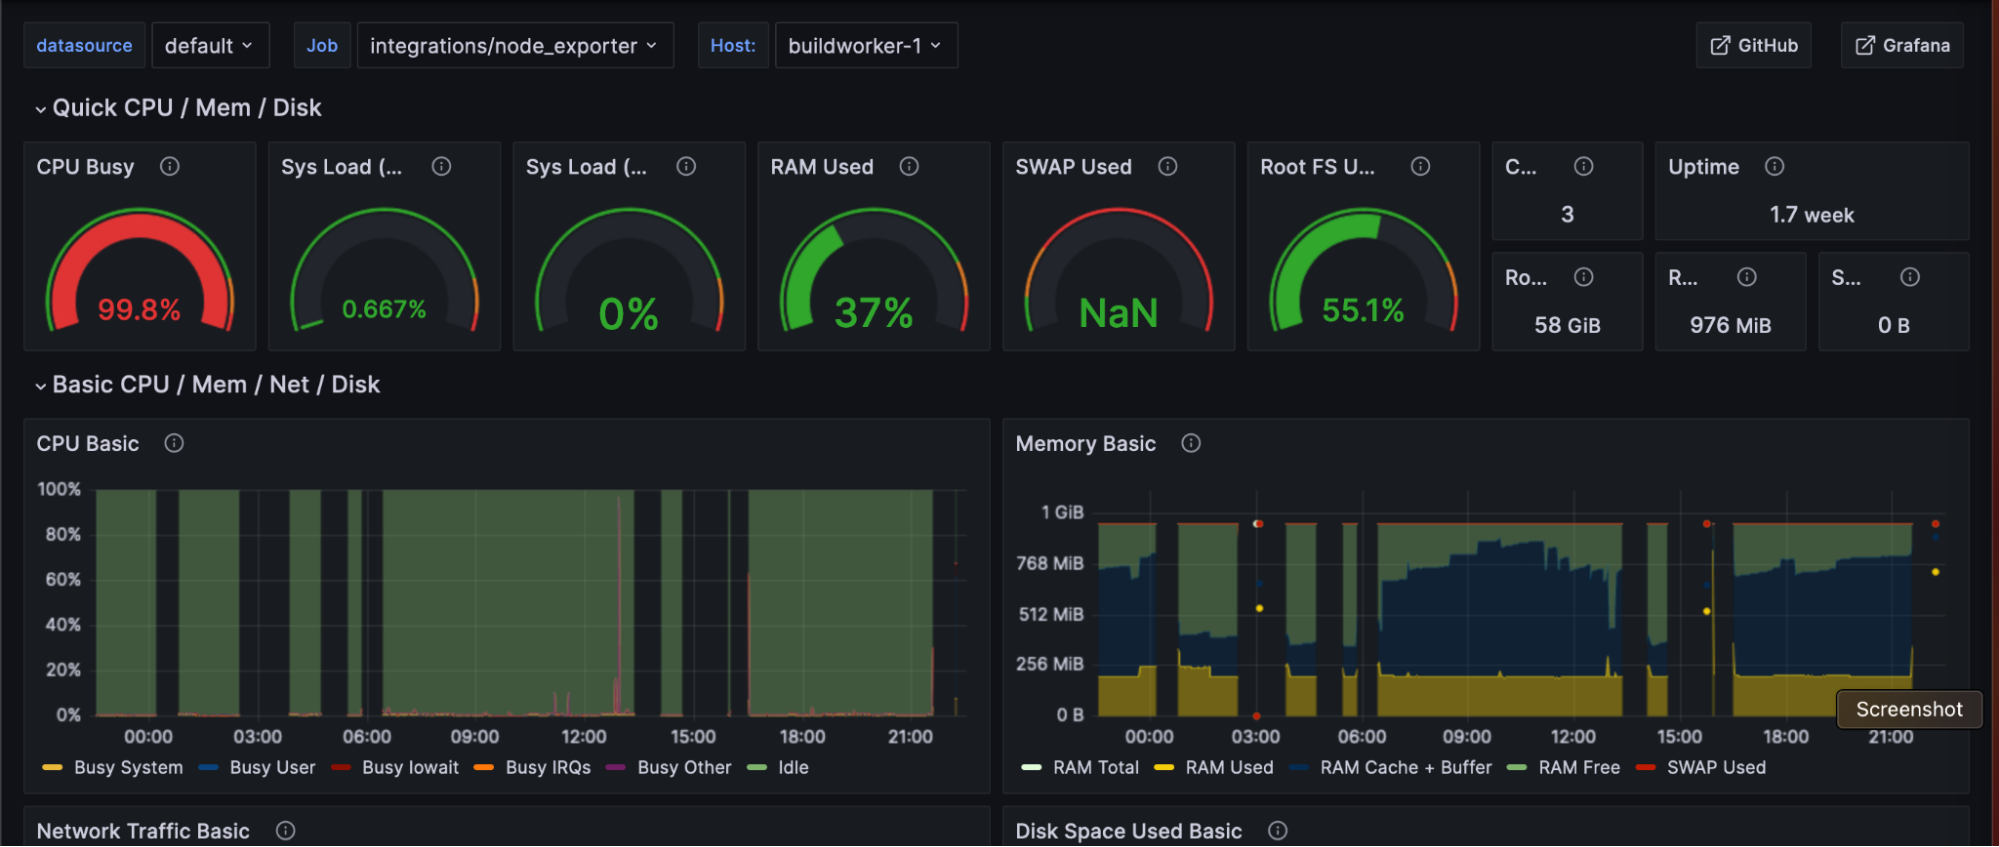
To get started with Grafana Cloud, we followed the integration onboarding steps to install and configure Grafana Agent on all our servers. Knowing our buildworker was the bottleneck, we customized a dashboard to inspect various angles of the buildworker node. The node_exporter was vital to understand how our workload affected the instance it’s running on.

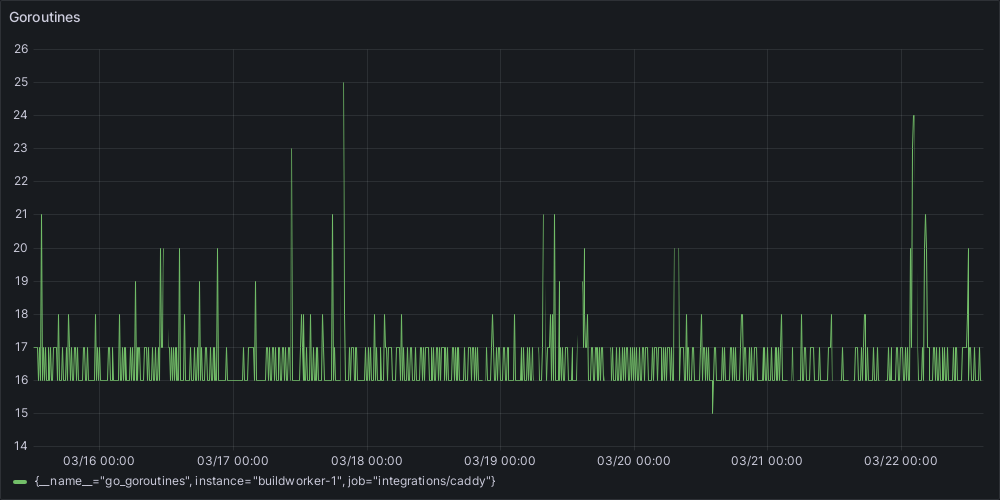
We quickly learned we had a goroutine leak due to long-running builds that included some of our heavier modules. We observed in a time series chart the number of goroutines growing over long periods, but never touching the zero line:

Long-running builds had not been a problem until recently, which we knew may be a symptom. Timeouts were set on build requests, so we knew at least one trigger for the struggling server. Treating this symptom ensured jobs that were stuck didn’t run indefinitely or consume resources. When we fixed the goroutine leak on the buildworker, we saw that there may be spikes, but the chart line was not always stepping up:

Although we addressed the goroutine leak, we still needed to find and resolve the root cause of our server performance issue. The question remained: why were those builds slow? Compilation demands RAM, CPU, and I/O, depending on the stage. We observed reports of unresponsiveness that never correlated with excessive RAM utilization, but CPU utilization had always been high — to the point of failing to accept SSH logins within reasonable time. This was a key realization for us to discover that our process is CPU-bound, not memory-bound. It provided us with a new action plan: the buildworker server upgrade should optimize for CPU.
What’s next for Caddy and Grafana Cloud
While our plan was a success, we are far from finished. SRE is a process of continual improvement.
Looking ahead, the observability tools in Grafana Cloud will allow us to efficiently diagnose and treat issues as they arise. Log aggregation allows us to correlate various events across different application and system boundaries; continuous monitoring lets us alert on sudden drops in activity and the events surrounding the drops; profiling indicates where resources utilization is subpar; and synthetic monitoring provides an external perspective to observe our system as a black box, using periodic PING and/or TRACEROUTE. We look forward to advancing our observability strategy — and the Caddy OSS project — with Grafana Cloud.
To learn more about a Grafana Cloud Pro account for your OSS project, reach out at community@grafana.com.


