Inside TeleTracking's journey to build a better observability platform with Grafana Cloud
Oren Lion, Director of Software Engineering, Productivity Engineering, and Tim Schruben, Vice President, Logistics Engineering, both work for TeleTracking, an integrated healthcare operations platform provider that is Expanding the Capacity to Care™ by helping health systems optimize access to care, streamline care delivery, and connect transitions of care.
If today’s distributed applications introduce a host of complexities, then the holy grail for observability teams is making it easy for development teams to integrate observability into their services, get feedback, and respond to potential issues.
Our engineering team at TeleTracking is making that philosophy a reality through our adoption of a centralized observability stack, which combines Prometheus with Grafana Cloud for metrics and logs. These tools not only give us greater visibility into our services, but serve as key feedback mechanisms for an ever-evolving developer experience. We have also lowered our overhead with Adaptive Metrics, the metrics cost management tool in Grafana Cloud, and increased our team’s investment in other high-impact projects.
In this blog, we’ll show you how we got here, how we got others in the company to buy in, and how Grafana Cloud has helped us bring more value to the business and save money and time along the way.
From SaaS to OSS and back again
Before we get into how we’re using Grafana Cloud today, we first want to provide a brief recap of how we got here. About six years ago, our observability bills had become exorbitant, so we opted to make a change and develop it all in-house with open source tools — Grafana, Prometheus, and Thanos.
We architected our system for a global view of our services, which had grown organically across AWS and Microsoft Azure and ran on a variety of cloud resources, including Amazon EKS and Azure Kubernetes Service (AKS) clusters, Amazon EC2, AWS Lambda, Azure VMs and Azure App Services. And while we love open source, along the way we lost sight of what we set out to do in the first place — to make observability effective, self-service, and low cost. As operations scaled, we went in the opposite direction and realized we needed to return to a managed solution.
We ultimately selected Grafana Cloud. We liked how you could have labels in common between metrics and logs; how well Grafana Loki (the open source logging solution that powers Grafana Cloud Logs) performed; and how you didn’t have to define how you wanted your logs parsed ahead of time. We also liked the centralized approach of Grafana Cloud Metrics, which uses a remote-write model, as well as the ability to visualize both metrics and logs, side-by-side in a Grafana dashboard.
The road to better observability with Grafana Cloud
Once we switched, we knew we wanted to make it easier for our developers to configure how their services get monitored. Here is a synopsis of some of the changes we made.
Simplified configuration
One of the first changes we made was to enable developers to store their monitoring configuration, including alerting rules, in the same repo as their service’s source code.
Configuring alerting rules was simplified by a one-liner, Bitbucket Pipe alertrule, in a repo’s build file. It publishes alerting rules to Grafana Cloud. Many alerting rules are common across all services, e.g., up and absent alerts and deviations in event processing, so we stored standard alerts in a centralized repo.
Monitoring configuration was simplified by adding a ServiceMonitor to the repos. For easy deployment and without changes to the deployment pipeline, it only needs to be added to the kustomization file.
Destination: 2 key labels
Software engineering teams were re-organized along service lines and services, so we wanted to make it easy for teams to use these same organizing principles for observability. To do this, we standardized on two key labels (serviceline and service) that go on all metrics and logs. Simple and consistent labeling across metrics and logs makes it easy for developers to correlate data, jump between the two, and get consistently alerted.

Since these labels were already configured in the Service manifest for services that run in Kubernetes, getting these labels appended into metrics was done by setting the targetLabels field in the ServiceMonitor file to “service” and “serviceline.” targetLabels injects labels from the Kubernetes Service into metrics.
For logs, we faced the question of where to pull the value to inject as the service line label. We landed on using the Kubernetes namespace as the service line label. However, our teams had not been deploying their services into namespaces that were named after service lines, so our developers needed to re-deploy into these new namespaces.
Additional changes were needed for services that do not run on Kubernetes clusters. These ranged from baking Grafana Agent into AMIs to code changes that add log appenders to legacy services. All configurations were required to inject the service line and service labels.
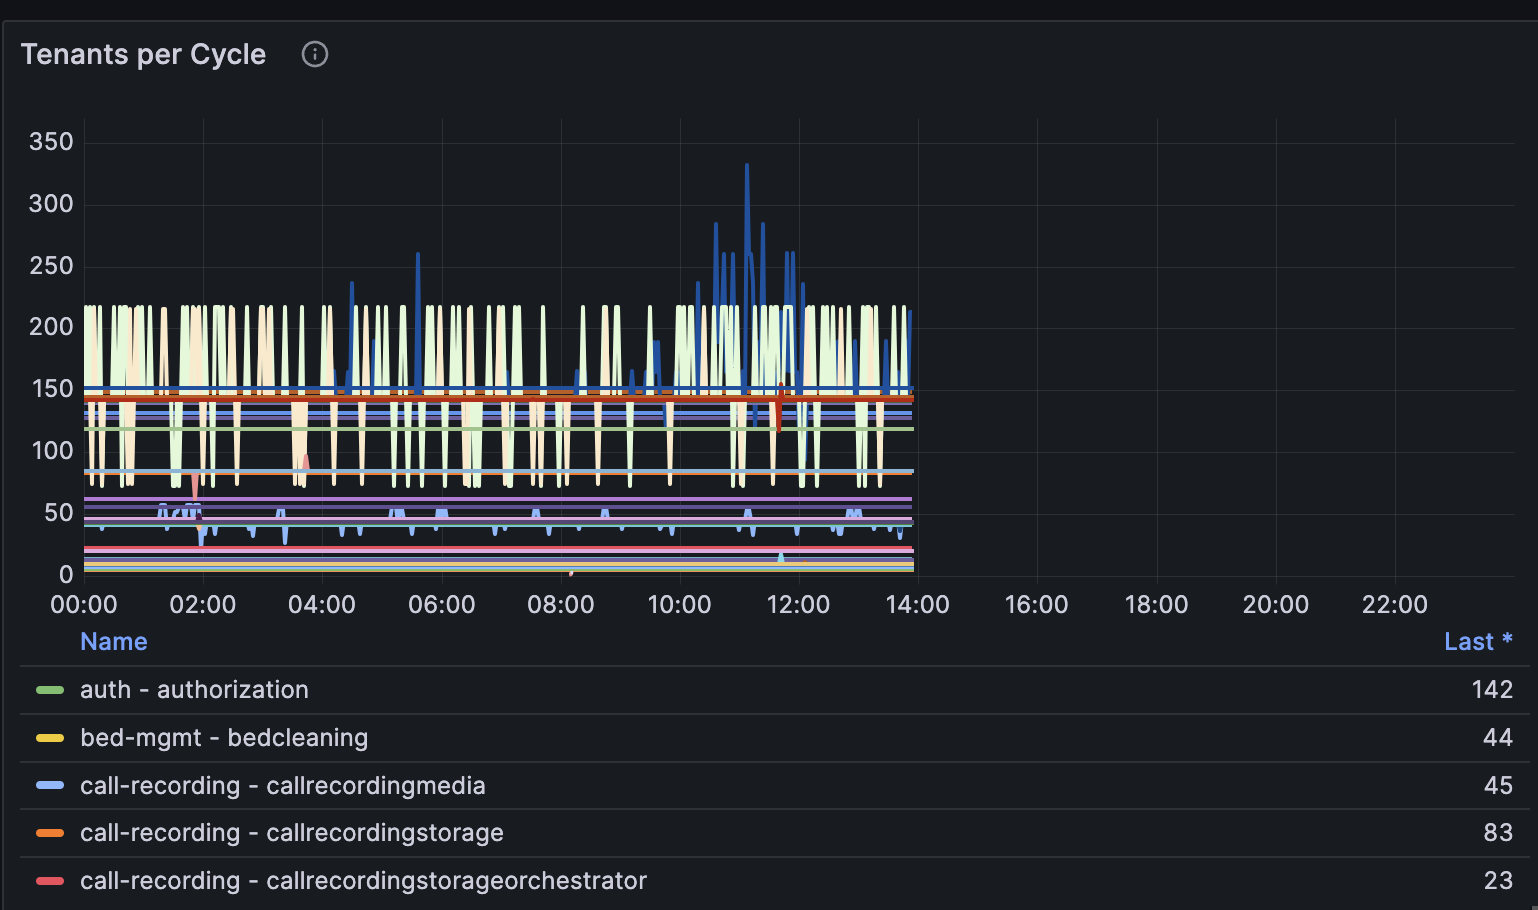
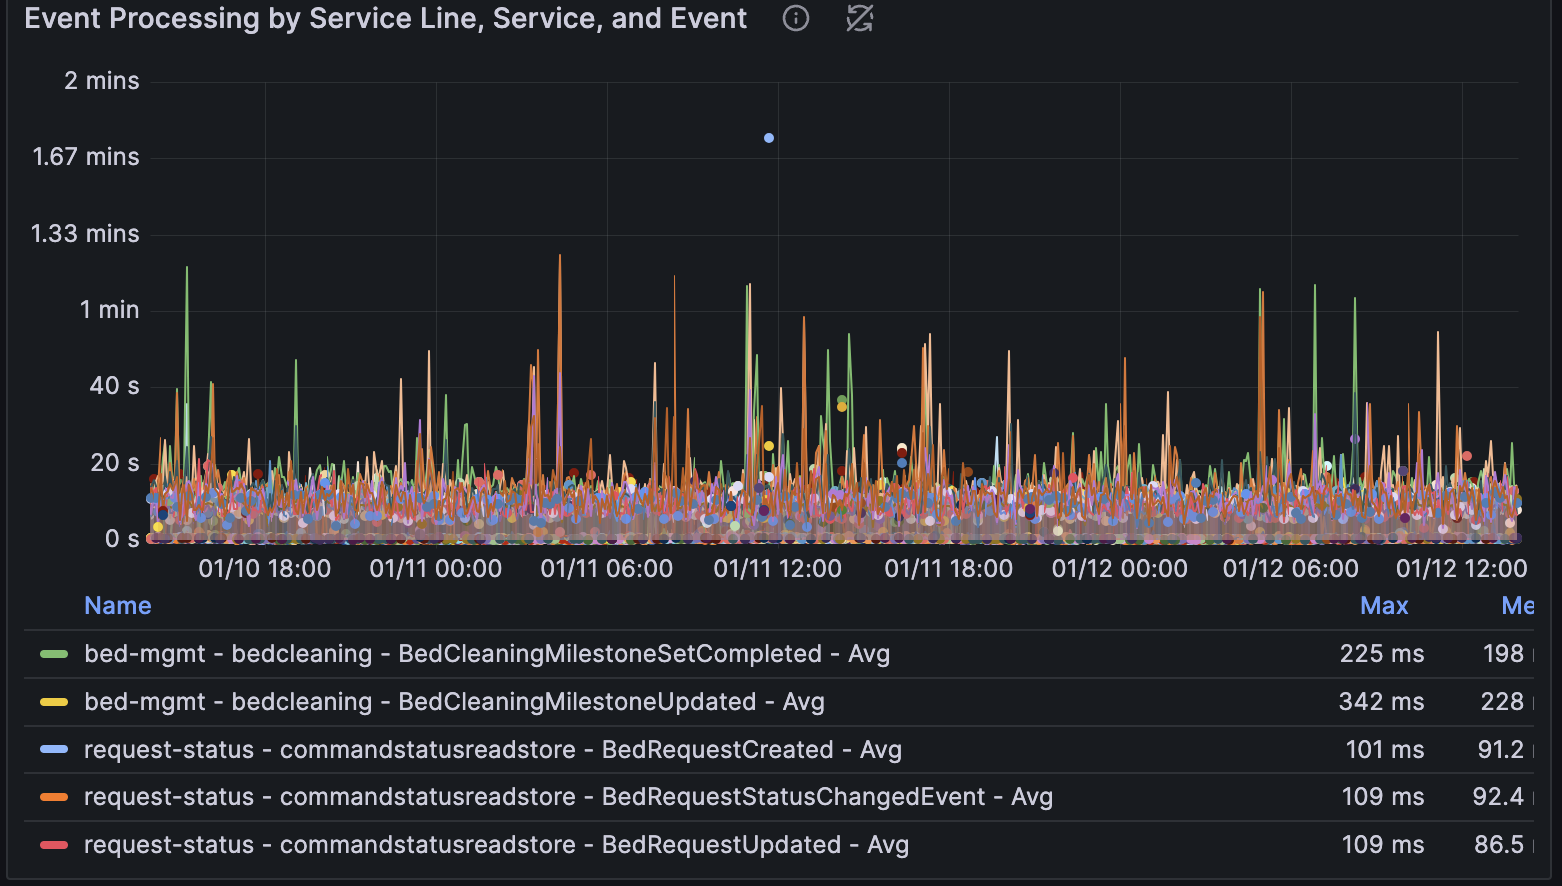
With those two key labels in hand, teams had an easy way to query and alert on metrics and logs. Dashboard configuration was, likewise, simplified by filtering on those labels. Now it’s easy to gain visibility into RED metrics across the platform and to focus down to the service lines and further down to each service.

A paved road for functions
For services that run on AWS Lambda, we built a “paved road” repository creator that prebuilds a new code repository with the ability to:
- Deploy code to AWS using Spinnaker and Terraform
- Push metrics to a Prometheus Pushgateway
- Publish alerting rules to Grafana Cloud
- Forward logs to Loki
Now developers who use the paved road Lambda repos have more time to focus on business features, with less time spent on dependencies such as service deployment and monitoring. We plan on expanding this model to microservices later this year.
2 labels, a route, and a receiver walk into a bar
Since alerting was also based on the service line and service labels, all the routes and receivers were prebuilt for all the service lines that were defined. To differentiate priority alerts that page the on-call engineers 24/7 from less urgent informational alerts, each service line has two receivers — one for high severities that goes to the on-call engineer and the other for lower severities that post to a central Slack channel.
Yes, some engineers balked at the idea at first, but once they started using the key labels and standing up dashboards and easily writing alerts, they were quick to see the value. Couple that with the ability to go between logs and metrics seamlessly, and we quickly saw developers latch on to this new framework.
Getting more for less
Grafana Cloud has considerably reduced our team’s workload. We no longer worry about managing our self-hosted stack or troubleshooting permission issues with querying across our networks — it’s all handled for us.
And that two-key labeling discipline is paying off. We now have a combination of fine-grained and coarse-grained views. We can go from business metrics down to low-level service line and service metrics and back again by using variables we place on labels in our dashboards.
This uniformity between the tools makes it easy to do many tasks, because we can aggregate everything into one dashboard and let others go out and create their own alerts. That’s not something we could have done with other observability tools, and we expect those label hooks to continue to pay off as we grow and adopt other Grafana Cloud services or integrate third-party data sources.
Tamping down costs
In addition to lower maintenance, we also realized considerable cost savings, but not before we ran into some early budgeting constraints. Our initial costs trended above our monthly target on Grafana Cloud Logs, though we expected some variance as teams adopted better log management practices. To tackle those overages, we monitored log ingest volume and worked with development teams to dial back log levels once debugging efforts were completed.
What caught us off guard was how fast our costs could increase on Grafana Cloud Metrics. It can be difficult to predict what a metric will cost, but we did notice that each new service or exporter correlated with a significant spending increase.
We used the Cardinality Management dashboard in Grafana Cloud to identify metrics that drove spending increases, but that didn’t immediately translate to savings since cost reductions were not realized until code changes and deployments were completed. However, we did find a fast and low effort response on spend with Adaptive Metrics, which aggregates unused or partially used metrics into lower cardinality versions. It’s a feature that works like a “loglevel” for metrics. We can increase metric verbosity when actively debugging and need labels that provide granular detail. And when we are done debugging, Adaptive Metrics allows us to revert to less verbose metrics by re-aggregating labels. That’s reduced our spend on Grafana Cloud Metrics by 50%!
We’ve also been pleased with how Grafana Cloud has saved us money, including in some unexpected ways. For starters, we worked with Grafana Labs to adjust our contract so we could operate with a prepaid spend commitment based on our projected usage. This one change helped us avoid potential overages and saved us 20% on our overall bill. It also gave us some flexibility in how we allocated resources in Grafana Cloud. Finally, it provided predictability for our expenses, which was important amid all the recent economic uncertainty.
More features, lower cost
Now, as we couple those savings with the reduction in our overall bill, we’re ready to align more capabilities under this observability framework that’s glued together by our key labels. We plan to reinvest those savings into Grafana Cloud.
Frontend Observability will be adopted to gain real-time frontend metrics that enable us to draw correlations between the user experience in the browser to backend services. And Grafana Incident will be adopted to more tightly integrate on-call serviceline team members with the logs and metrics they use to speed up service recovery.
Migrating to Frontend Observability (powered by the open source Grafana Faro web SDK), and Grafana Incident (part of the Grafana Incident & Response Management suite of services) will allow us to significantly reduce spend on competing offerings we will migrate off of later this year.
It’s a far cry from where we were just a few short years ago. We’re no longer just keeping the lights on and putting out fires. Today, we’re being proactive, finding new ways to support the business, and helping our developers do their jobs easier, faster, and better.
Grafana Cloud is the easiest way to get started with metrics, logs, traces, dashboards, and more. We have a generous forever-free tier and plans for every use case. Sign up for free now!


