10 trending topics in the Grafana community
When community members share their Grafana story and best practices with others — whether they’re presenting at a meetup, writing a blog, or creating a video tutorial — it’s truly a win-win. It benefits the broader community through knowledge sharing, but also provides you with a platform to showcase your expertise — and could pave the way toward becoming a Grafana Champion.
But we know it can be a challenge to choose a particular topic to speak or write about. That’s why, in this post, we hope to spark a little inspiration by sharing some of the most popular topics within the Grafana community over the past year.
To compile the list below, we looked at some of the most commonly discussed topics across Grafana community members. This involved analyzing community data from Grafana.com, the Grafana Community Slack Workspace, our 70+ meetup groups, LinkedIn, Stack Overflow, Reddit, medium, X, and YouTube.
The topics on this list are fairly broad and evergreen. If you want to drill down further, you can find more details on each topic by searching our community forum. For each topic, we’ve also provided examples of relevant content, including blog posts, YouTube videos, conference talks, and more.
Popular topics in the Grafana community
1. Visualizations, dashboards, and panels
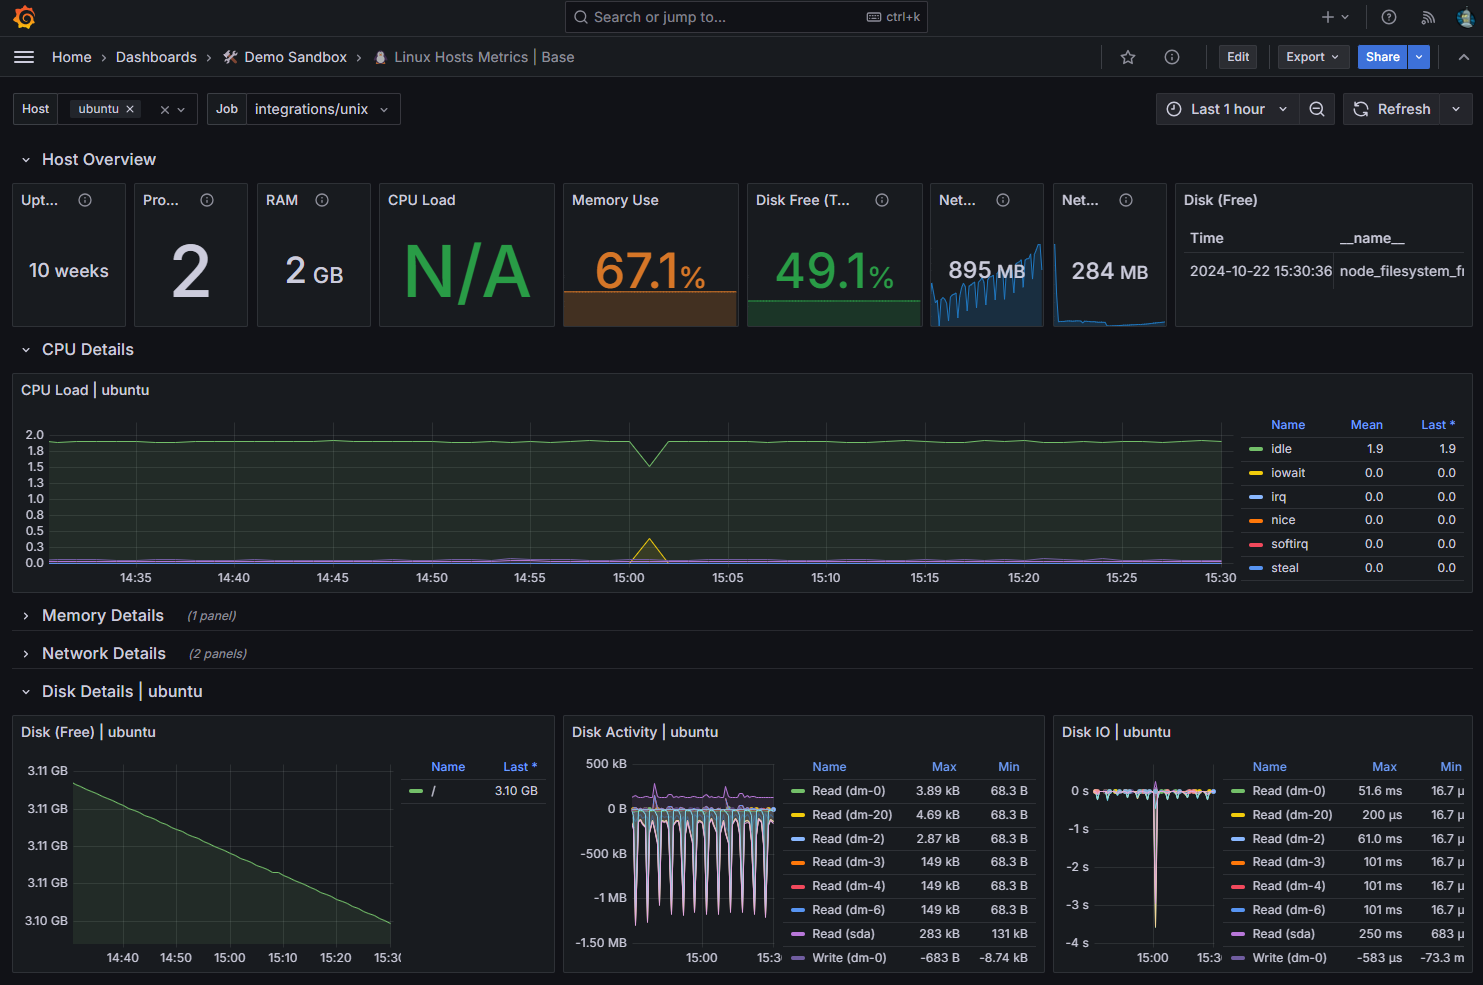
Dashboards are Grafana’s bread and butter, and the community loves helpful posts about how others are using dashboards to visualize and derive value from their data.

There’s also a lot of interest, specifically, related to panels, which are the basic visualization building blocks in Grafana. Each panel has a query editor (specific to the data source selected) that allows you to build a query to return the data you want to visualize. Grafana users are always eager to hear how fellow community members style and format their panels to create beautiful dashboards, as well as explore different panel types, such as stat and Canvas.
Content examples:
- Visualize real-time CAN-to-USB data via custom Grafana dashboards and the MQTT plugin
- Understanding dashboards in Grafana | Panels, visualizations, queries, and transformations
- Industrial IoT visualization: Why United Manufacturing Hub chose Grafana to power its IIoT platform
- Variable panel for Grafana | New features and updates | Easy tutorial
2. Alerts
With Grafana Alerting, you can create queries and expressions from multiple data sources — no matter where your data is stored — giving you the flexibility to combine your data and alert on your metrics and logs in new and unique ways. We’d love to hear how your team uses Grafana Alerting to quickly identify and resolve issues.
Content examples:
- How to display Grafana Alerts on dashboards
- How to monitor your kids’ chores: An introduction to Grafana-powered parenting
- How to create alert rules to monitor sensor data with Grafana and Raspberry Pi
3. Performance testing
Performance testing is essential to consistently prevent system failures and deliver reliable software. Our community members are looking to learn more about how teams can use Grafana k6, the open source load testing tool, or Grafana Cloud k6, the fully managed performance testing platform, to achieve these goals.
Content examples:
- Grafana k6 for beginners: Why observability needs testing
- Organizing your Grafana k6 performance testing suite: Best practices to get started
- Explaining performance testing types with k6
- How to modularize your k6 tests
4. Troubleshooting
Troubleshooting is another important topic within the community. There are various methods and best practices to troubleshoot within Grafana itself, and there’s a wide range of features in Grafana and Grafana Cloud — such as the Errors Overview page within Grafana Cloud Frontend Observability — to help users identify and troubleshoot issues within their systems and applications.
Content examples:
- Observe deleted Kubernetes components in Grafana Cloud to boost troubleshooting and resource management
- How to implement ErrorHandler to log errors in k6
5. Logging (especially labels and queries)
Grafana Loki — the open source, horizontally scalable, highly available, multi-tenant log aggregation system — is another popular community topic, and Loki labels and queries, in particular, continue to be of interest. Labels are key value pairs and can be defined as anything; we like to refer to them as metadata to describe a log stream. Users can combine different labels to create flexible log queries.
Content examples:
- Inside TeleTracking’s journey to build a better observability platform with Grafana Cloud
- How to add annotation queries to your Grafana dashboards
- The concise guide to Grafana Loki: Everything you need to know about labels
6. Prometheus metrics
Grafana Mimir is an open source, horizontally scalable, multi-tenant TSDB for long-term storage for Prometheus. It lets you scale metrics to 1 billion active series (and beyond), with high availability, durable storage, and blazing fast query performance over long periods of time.
Content examples:
- How CERN uses Grafana and Mimir to monitor the world’s largest computer grid
- How to set up Grafana Mimir using Ansible
7. Grafana Cloud (especially the free tier)
Grafana Cloud is a fully managed cloud-hosted observability platform powered by the Grafana LGTM (Loki for logs, Grafana for visualization, Tempo for traces, and Mimir for metrics) Stack. In addition to content about using Grafana Cloud to visualize data, reduce operational overhead, and optimize observability costs, our community loves to read about all the fun and creative ways their peers have used the Grafana Cloud free tier — from monitoring the weather to tracking fitness goals.

Content examples:
- How to monitor your local weather with Grafana Cloud
- Using Prometheus, Python, and Grafana Cloud for data-driven triathlon training
8. Distributed tracing
Grafana Tempo is an open source, easy-to-use, and high-scale distributed tracing backend. Tempo is cost-efficient, requiring only object storage to operate, and is deeply integrated with Grafana, Prometheus, and Loki. Similar to content related to other Grafana open source projects, both beginner-level content and technical deep dives resonate with the community.
Content examples:
- OpenTelemetry Looks Good To Me: Loki, Grafana, Tempo, Mimir
- Traces to metrics: Ad hoc RED metrics in Grafana Tempo with ‘Aggregate by’
9. Grafana Alloy (and OpenTelemetry)
In the opening keynote of GrafanaCON 2024, we announced our newest OSS project: Grafana Alloy, our open source distribution of the OpenTelemetry Collector. Alloy is a telemetry collector that is 100% OTLP compatible and offers native pipelines for OpenTelemetry and Prometheus telemetry formats, supporting metrics, logs, traces, and profiles. A continuation of our work on Grafana Agent Flow, we designed Alloy to simplify observability at scale and to easily integrate with the OpenTelemetry and Prometheus ecosystems.
In addition to content about Grafana Alloy, OpenTelemetry, in general, continues to be a popular topic within the community.
Content examples:
- Shorten your feedback loop: Java observability with OpenTelemetry, Grafana Cloud, and Digma.ai
- Metrics, logs, traces, and mayhem: introducing an observability adventure game powered by Grafana Alloy and OTel
- Use Grafana Alloy to collect Azure metrics with less hassle
10. Getting started and beginner content
Everyone has to start somewhere, which is likely why “Configure Grafana” consistently ranks as our #1 most-viewed docs page. There’s still a lot of room to grow here, as our global (and growing) community seeks resources to get started with Grafana for a wide variety of use cases.
Content examples:
- Grafana for beginners: Quick tips to add a data source, choose a visualization type, and more
- How to work with multiple data sources in Grafana dashboards: best practices to get started
- Grafana Scenes — 10 development tips
How to submit your blogs, talks, and more
While we hope the topics above provide some inspiration for future presentations, videos, or blog posts, this is by no means an exhaustive list — we welcome all ideas related to Grafana open source projects, our broader OSS ecosystem, and Grafana Cloud. To submit your application for a blog or talk, please fill out this form.
Present at GrafanaCON 2025
Want to share your story at our biggest community event of the year? GrafanaCON 2025 is taking place May 6-8 in Seattle, and we’re looking for speakers to present real-world experiences, tips and tricks, dashboard demos, and cool use cases. The GrafanaCON 2025 CFP is open for submissions until January 30. Submit your talk today!
We look forward to hearing from you!
Community is at the heart of Grafana. Find out how you can join our passionate and growing community today.


