
How to monitor a MySQL NDB cluster with Grafana
Jason Mallory is a senior MySQL/SQL server database administrator who develops monitoring and alerting solutions for operations departments in the aerospace industry. Jason is also a Grafana Champion.
MySQL Network Database — or NDB, for short — is an in-memory, sharded database platform. Consisting of several moving parts, NDB can be one of the most challenging database platforms to monitor. However, monitoring NDB cluster health is crucial to ensure reliability and performance.
While it’s possible to use MySQL Enterprise Manager to monitor NDB, this method can require a lot of manual maintenance and effort. Instead, in this blog post, we’ll explore how you can use Grafana to more easily monitor NDB nodes in near real-time.
To get most of our metrics, we will poll from MySQL API nodes using a BASH script. We will then store many of these metrics in InfluxDB 1.8, as it’s a time series-based database that most administrators and developers are familiar with. We will ingest logs from the MGM nodes and store them in Grafana Loki; these will be used mainly for alerting. Then, we will create visual alerts within Grafana from our InfluxDB and Loki data sources.
But first, an overview of NDB processes
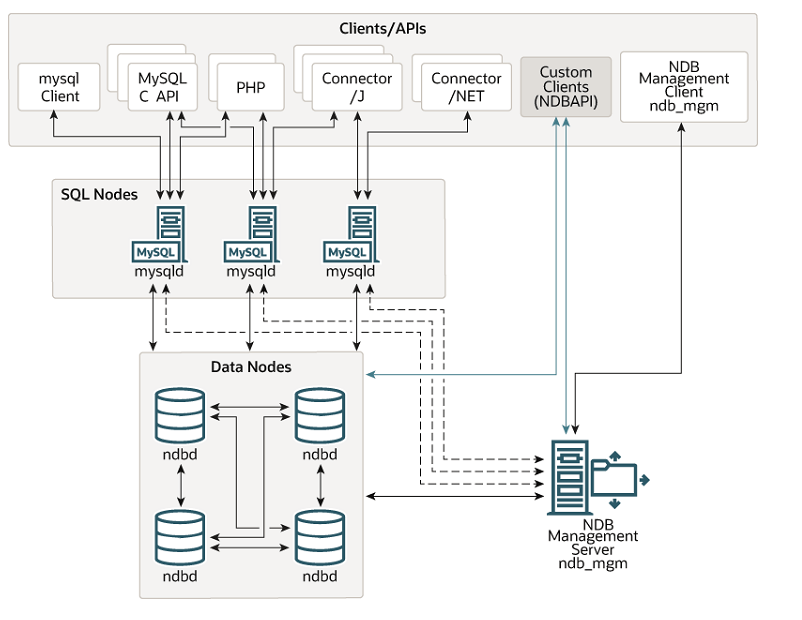
Before getting started, it’s helpful to note that the NDB platform consists of three major components, or processes.
First, there’s the ndb_mgm process, which is the cluster manager. This is the service that holds the configurations of the cluster, manages sharding and paging within memory, performs snapshots to disk, and manages the quorum of nodes within the cluster. It also partitions the data across the various nodes and groups within the cluster.
Next is the ndbd process, which connects the data nodes to the cluster and allows memory and disk resources to be available for the cluster to store data and indexes.
Lastly, there’s the MySQL process within the NDB platform, known as the API node. This is because this is the access point to the NDB database engine, which can consist of SQL and NoSQL queries at any given time. It is also where the NDB table and index information is stored locally in the InnoDB MySQL schema.
Requirements
To monitor NDB, you’ll need several components:
- MySQL client: To run queries against the API node.
- Telegraf: To monitor various parts of the operating system, as well as support targeted process monitoring of ndb_mgm and ndbd processes.
- InfluxDB: To store trend data on the NDB platform, along with alert data.
- Promtail: To gather ndb_mgmd logs.
- Loki: To monitor the ndb_mgmd logs for failures within the cluster.
- Grafana: To create dashboards and manage our alerts.
We need to create a database, called ndbpolls, to send the MySQL stat query results to, and also need a one-year data retention policy to store trend information on the NDB cluster.
Poll from MySQL API
For NDB, there are specialty queries to get data related to node memory usage. These are critical to monitor and are independent of what the operating system reports.
I wrote a script to perform the queries we need:
nodemem1=`mysql -h server -ugrafmon -ppassword -N -e 'select used from ndbinfo.memoryusage where node_id = 1 LIMIT 1;'`This gives us a variable that we can then insert into InfluxDB:
influx -database ndbpolls -execute "insert NDBnodeMemory,NodeID=1,host=server01 values=$nodemem1"Syntax, in terms of how you place the variables in the values, is important. In our case, we can insert a FLOAT value instead of a STRING.
We repeat this process until we have the queries and variables we need to monitor this portion of the NDB stack. We can use the Influx client to verify that the values key is a FLOAT:
> SHOW FIELD KEYS FROM NDBnodeMemory
name: NDBnodeMemory
fieldKey fieldType
-------- ---------
values   float
>
We can also verify all of the data going into the measurement is correct:
> select * from NDBnodeMemory order by time desc limit 5
name: NDBnodeMemory
time                NodeID host       values
----                ------ ----       ------
1699055880407675483 4      server04 159670272
1699055880307061679 3      server03 159662080
1699055880207231805 2      server02 159621120
1699055880107481533 1      server01 159637504
1699055820464704341 4      server04 159588352
>
This is exactly what we want to see. But now, we want this done every minute.
Create a polling script with Telegraf and inputs.exe
To get the data in the timeframe we would like, it’s better to let Telegraf do the polling. We can create the poll script, ndbPolls.sh, and give the Telegraf user full ownership of the script. Now, we add the inputs.exec to run the script every minute:
[[inputs.exec]]
   interval = "60s"
   commands = [
       "/usr/local/telegraf/ndbPolls.sh",
   ]
   timeout = "50s"
Save and test the configuration to ensure everything works as it should. Restart the Telegraf service and check the logs for errors. I can tell you from experience, permissions are the biggest hindrance — so just be aware of the script permissions and ownership. Then, verify the data is going into InfluxDB by checking the measurements. As each minute passes, you should see new data entering within all the measurements.
Telegraf for process monitoring
On the ndb_mgmd, ndbd, and API nodes, there are a lot of operations to monitor. First off, the ndbd, ndb_mgmd, and mysqld services and processes need to be monitored. We can easily monitor the mysqld service by enabling inputs.systemd_units in the Telegraf config:
[[inputs.systemd_units]]
  unittype = "service"
This allows us to monitor for the specific servers and the mysqld process:
> select * from systemd_units where "name" = 'mysqld.service' and host =~ /dnbcs*/ limit 2
name: systemd_units
time                active active_code host       load   load_code name           sub     sub_code
----                ------ ----------- ----       ----   --------- ----           ---     --------
1697136780000000000 active 0           servercs01 loaded 0         mysqld.service running 0
1697136790000000000 active 0           servercs02 loaded 0         mysqld.service running 0
>
However, ndbd and ndb_mgm don’t run as a service. So, we need to to enable procstat and pgrep for the individual processes on each server:
[[inputs.procstat]]
  pattern = "ndb_mgmd"
In this case, now we can am verify that the ndb_mgmd process is running:
> select "host", "pid" from procstat where "pattern" = 'ndb_mgmd' limit 2
name: procstat
time                host       pid
----                ----       ---
1698423960000000000 servercs01 1322
1698423960000000000 servercs02 1340
>
We can verify the same for the ndbd process:
> select "host", "pid" from procstat where "pattern" = 'ndbd' limit 2
name: procstat
time                host       pid
----                ----       ---
1698875580000000000 servercd01 9667
1698875640000000000 servercd02 9666
>
Monitor logs with Loki and Promtail
At this point, we need to start ingesting the ndb_mgmd logs. The only way to tell if there is a failure with the cluster itself is by monitoring the logs. In my experience, before implementing Loki, we had zero visibility into the logs and failures occurring within the cluster. We had to monitor the NDB cluster by querying an NDB table every minute. If it failed, we started looking for the reason for the failure.
With Promtail and Loki, we can see all possible warnings and failures that NDB can produce. The main ones we are concerned with are:
TransporterErrorTransporterWarningMissedHeartbeatDeadDueToHeartbeatBackupFailedToStartBackupAborted
We are also looking for these log entries every six hours to make sure it has started:
BackupStartedBackupCompleted
To make this happen, we can use Promtail on the ndbd and ndb_mgmd nodes and push to our Loki server. The Promtail for our scenario is as follows, but depending on your NDB cluster configuration and build, it can vary:
server:
  http_listen_port: 9080
  grpc_listen_port: 0
positions:
  filename: /opt/loki/positions.yaml
clients:
  - url: http://server:3100/loki/api/v1/push
scrape_configs:
- job_name: ndb
  static_configs:
  - targets:
      - localhost
    labels:
      job: servercs01ndblogs
      __path__: /var/mysqlcluster/48/ndb_48_cluster.log
- job_name: mysql
  static_configs:
  - targets:
      - localhost
    labels:
      job: servercs01mysqllogs
      __path__: /var/lib/mysql/logs/error.log
This allows us to get the NDB logs we are searching for errors, and the MySQL logs for additional NDB debugging on the API piece, as needed.
Bring it all into Grafana
Here’s where we see if it works.
When testing new queries from new data sources, I usually use Explore. It gives me the flexibility to test multiple platforms at once and compare queries and data returned. For the first test, let’s check to see if Grafana is seeing the NDB data that we are polling for in Telegraf with inputs.exec:
SELECT last("values") FROM "autogen"."NDBnodeMemory" WHERE $timeFilter GROUP BY time($__interval) fill(null)Here, we see data coming in every minute, as we have it set in Telegraf:

Now let’s check for my ndb_mgmd pid count per minute to see if the process is running:
SELECT count("pid") FROM "procstat" WHERE ("process_name"::tag = 'ndb_mgmd') AND $timeFilter GROUP BY time($__interval) fill(null)Again, we can see results coming in:

Let’s say we do the same for ndbd and get the same results. Now, we move on to our Loki data source and see if logs are coming in. Check log entries for servercs01ndblogs:
{job=”servercs01ndblogs} |=``And we can see logs are coming in:

Then, add a filter to the query that we will use for our alarm:
{job=”servercs01ndblogs} |=`backup`Again, we see the logs are coming in for backups within the timeframe we want:
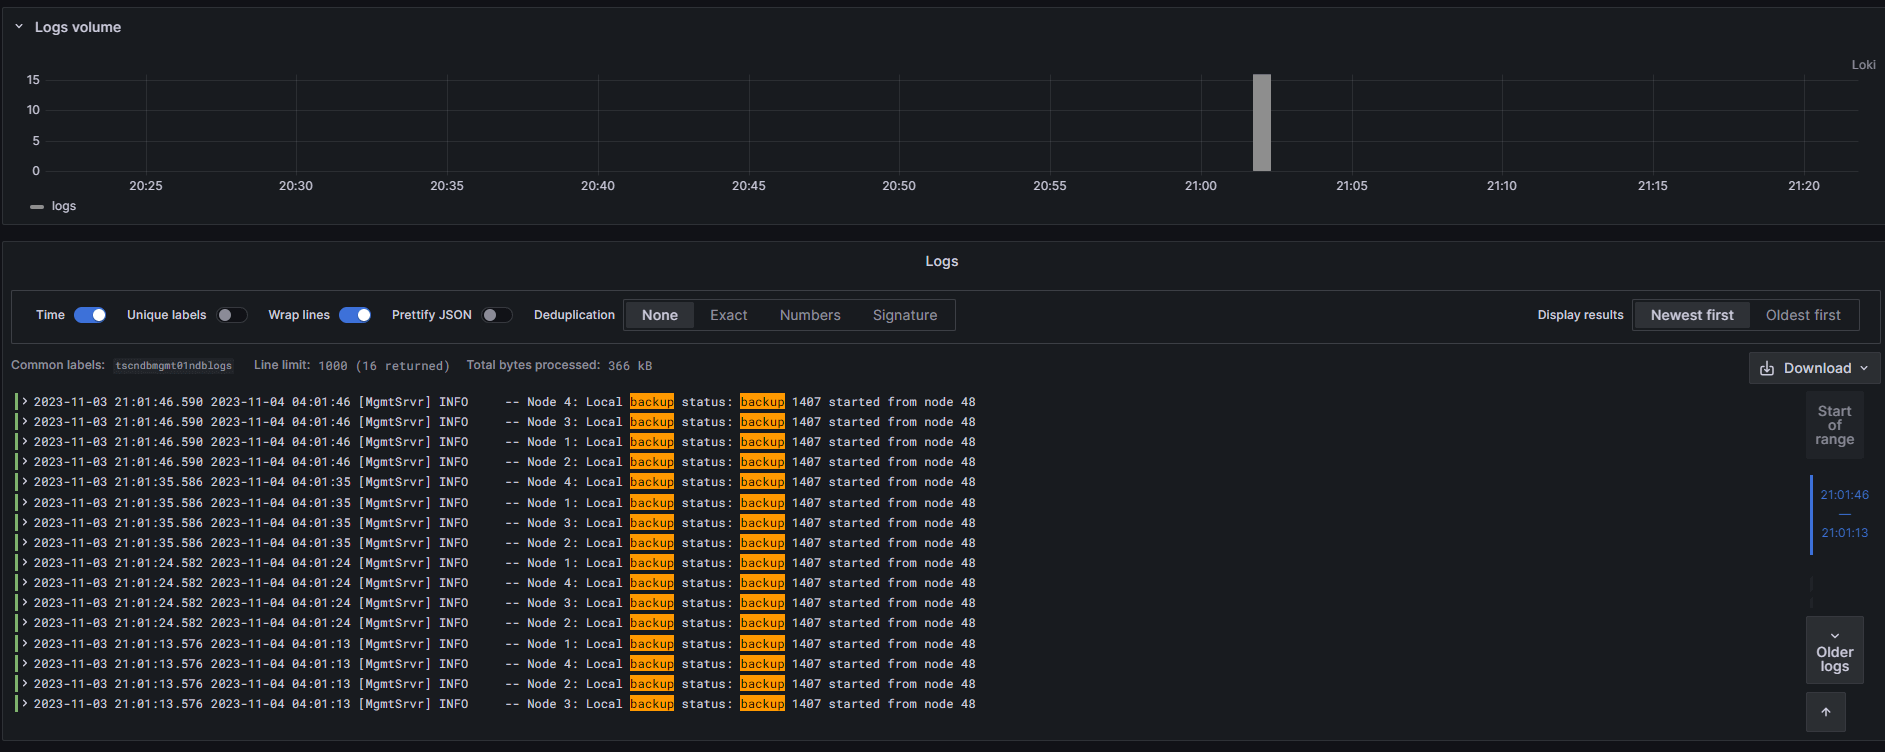
Perfect! We know everything is coming into InfluxDB and Loki like it should. On to the alert rules!
Set up our alarms
What has this all been for? To let us know when something catastrophic has happened to the NDB cluster — things we couldn’t see without these tools.
Our first alarm will be for the ndbd process. The alarm is as follows:
select count("status") from procstat where "host" =~ /servercd*/ and process_name = 'ndbd' AND $timeFilter GROUP BY "host" fill(null) ORDER BY time ASCThe query sees the process is running within the time specified:

We can write our expressions for the alarm based on the count of processes; if the count is below 1, the alarm is triggered:
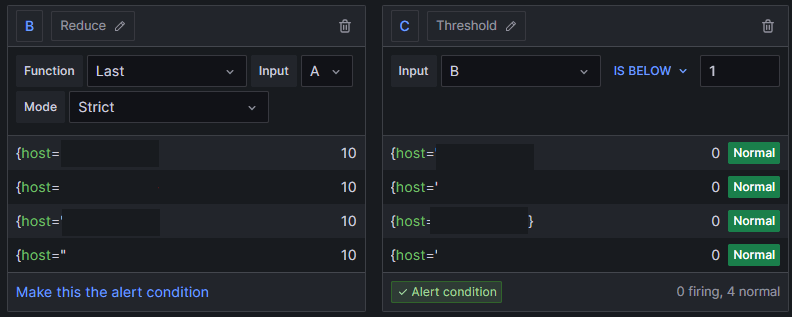
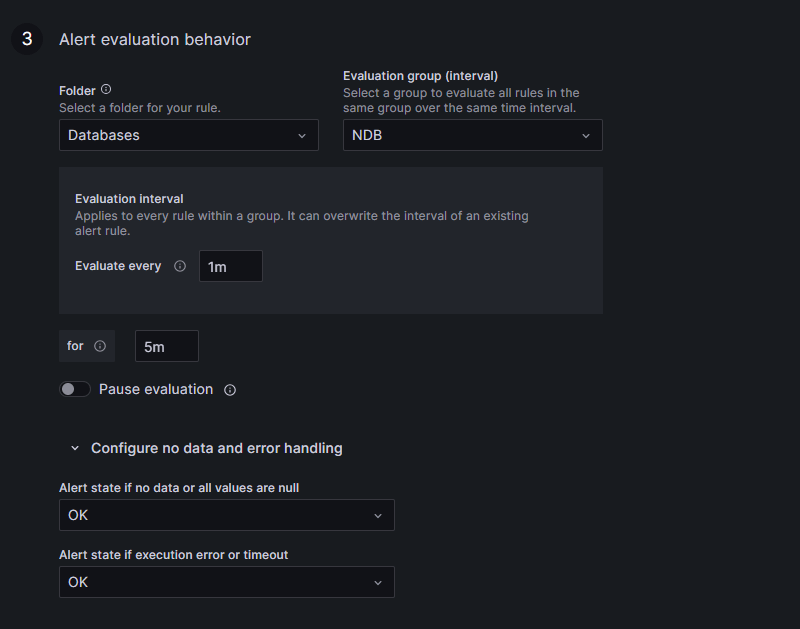
All clear for now. Now, set the alert behavior, per our requirements:
Add the labels and values from our query results into the message. The labels and values can be seen in the expressions:
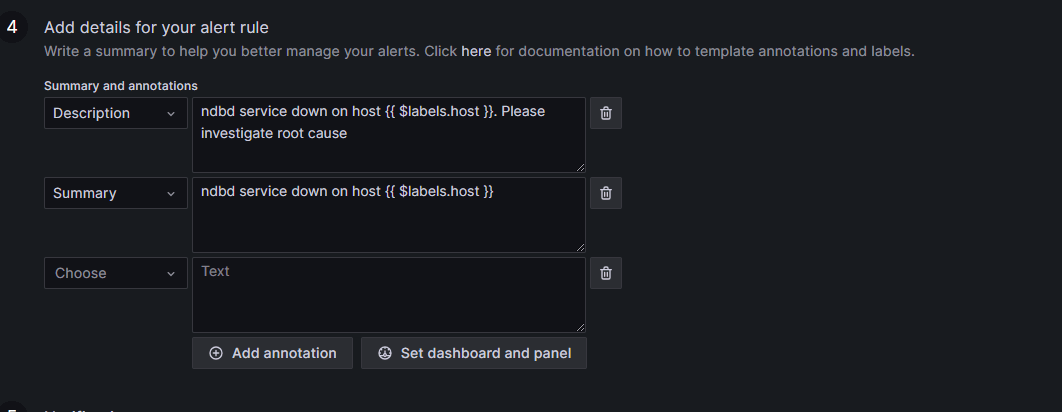
Then, add the custom labels and keys for where the notification goes and what it displays. We can use the Severity label to add a threshold level (critical/warning). In this case, the service not running is critical no matter what, but still use a threshold:
{{ if lt $values.B.Value 1.0 }}Critical{{ else }}Warning{{ end }}We add the Team, which in this case is DBAs:

When we save the alert, wait for the alarm to be polled. Whether or not the alarm is currently firing doesn’t matter. We want to check to see if the labels are working correctly:

Everything looks good. We can follow this same basic process to create alarms from other InfluxDB values that we’re polling for.
Next, we need to configure the Loki alarms. These are crucial for us to be notified on, as they will allow us to quickly adjust to a node being down or having to restore the whole database.
In this example, we’re testing on a log entry that should be there and not be an error condition: the backups. For our Loki query, use the following:
count(rate({job=”servercs01ndblogs”} |= `backup` [6h]))This is checking for a backup log entry within six hours. The backups run every four hours, so a log entry should be there. And the results show the job running:

Let’s write expressions to alarm if lower than 1. Add the same information for alarm messages and notification routing, and check the alarm polling to see if it works:

Here, we see all the labels present, and that the dynamic critical threshold is working. We also see that the labels within the message are working. Perfect!
Wrapping up and next steps
I hope this guide helps you monitor MySQL NDB more effectively. I know sometimes it can be a struggle to verify that all the components, services, and processes are working as they should, and that you aren’t left in the dark. One of the biggest challenges is simply knowing the errors that NDB produces and that can cause failures, most of which can be found here. The other big challenge is testing. In this scenario, we dropped the virtual NIC on the ndbd node and waited for a heartbeat failure alert.
For more information on MySQL NDB clustering, this MySQL documentation is a good place to start. For InfluxDB and Telegraf information, check out InfluxDB documentation and the Telegraf GitHub repository.
Lastly, you can learn more by reviewing documentation for both Grafana and Loki.
Want to share your Grafana best practices, story, or dashboards with the community? Drop us a note at stories@grafana.com.


