How to create alert rules to monitor sensor data with Grafana and Raspberry Pi
When monitoring sensor data, such as data from a weather station, a home security system, or a home automation assistant, it’s useful to have an alerting system in place, as well. By setting up alerts for sensor data, you can automatically receive notifications when any significant event occurs.
It’s also possible to receive these alerts through various communication channels, such as email, SMS, or a webhook endpoint.
In this blog post, we demonstrate this process. Specifically, we walk through how to use Grafana Alerting to send notifications related to temperature and humidity levels to a webhook endpoint.
Before you begin
This post builds off of the Monitor temperature and humidity with Grafana and Raspberry Pi tutorial, in which we install a temperature and humidity sensor, use a Python app to export the sensor data, Prometheus to collect and store it, and Grafana to visualize the data. If you are already familiar with pulling sensor data with Prometheus and Grafana, and you are only interested in building an alert for it, continue reading on! Otherwise, it might be helpful to pause, reference that previous tutorial, and then revisit this one.
Set up the Grafana stack
To demonstrate the observation of data using the Grafana stack, download and run the following files. Find detailed instructions on how to run this project in the repository below.
- Clone the tutorial environment repository:
git clone https://github.com/tonypowa/sensor-data-monitoring-grafana- Change to the directory where you cloned the repository:
cd sensor-data-monitoring-grafana- Run the Grafana stack:
docker compose build- Bring up the containers:
docker compose up -dGrafana Alerting to monitor sensor data
With Grafana-managed alert rules, you query the data source, transform the returned data, and then set a condition under which the alert should trigger. As a result, you receive notifications when the alert triggers or resolves. If you link the alert to a visualization, you can also observe the alerted event in the form of an annotation.
In addition to creating an alert rule, we need to create a contact point to send the notifications to.
Now that we’ve reviewed some of these key concepts related to Grafana Alerting, let’s create an alert rule to query our database and create an alert rule for the sensor data.
Alerting on sensor data: a practical use case
To illustrate how alert rule rules work, let’s look at a real-life situation in which it would be useful to have alert notifications for temperature and humidity sensors.
Let’s say we want to receive an alert notification if the temperature and humidity in a room is greater or less than a certain level. With Grafana, we can not only visualize in a graph when, how long, and how often the temperature and humidity levels are above or below a particular point, but also be notified whenever the alert rule gets triggered. This notification would allow us to take certain measures, such as turning up the heat or turning on a humidifier, to ensure the room is comfortable.
Metrics can be queried and measured separately with Prometheus. And, since we want to trigger alert rules when the data is outside of different ranges for temperature and humidity, we should create separate alert rules for each metric and range.
Add a contact point
Before we create an alert rule, let’s define where our notifications are sent. For this example, we add a webhook endpoint as a contact point:
- In another tab, go to Webhook.site.
- Copy your unique URL.
- Return to Grafana. In Grafana’s sidebar, hover over the Alerting (bell) icon and then click Contact points.
- Click + Create contact point.
- In Name, write Webhook.
- From Integration, select Webhook.
- In URL, paste the endpoint to your webhook endpoint.
- Click Test to check that the integration works. You should receive a test notification.
- Click Save contact point.
Create an alert rule
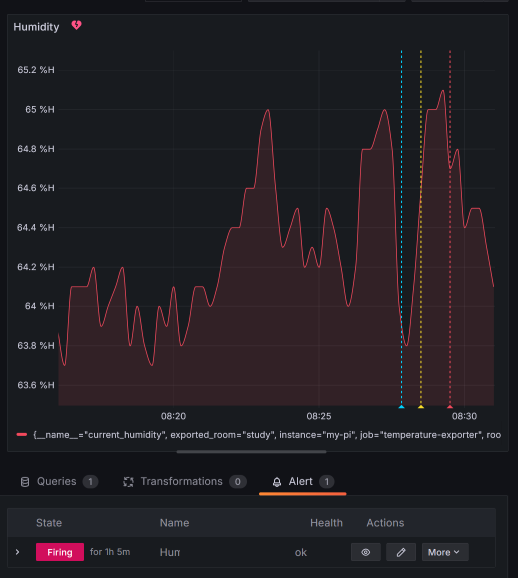
There are two ways to create alert rules; from the Alerting menu, and from a supported visualization. In this case, we create an alert rule from a time-series panel where we measure sensor data. Moreover, linking a visualization to an alert rule adds an annotation to the panel when the status of your alert rules change.

Alert rule to monitor temperature
For the demonstration of this practical use case, you can import a sample dashboard by using its ID.
- In Grafana, go to Home > Dashboards > Import, enter the ID
22406, and click Load. Note: The dashboard was made to work with a DHT temperature and humidity sensor. You can check how to set it up in the Monitor temperature and humidity with Grafana and Raspberry Pi tutorial. - In the dashboard, edit the Temperature panel (hover over the panel and press “e” on your keyboard”).
- Click on the Alert tab underneath the graph.
- Click New alert rule.
Notice the name of the panel, query, and time interval have been imported.
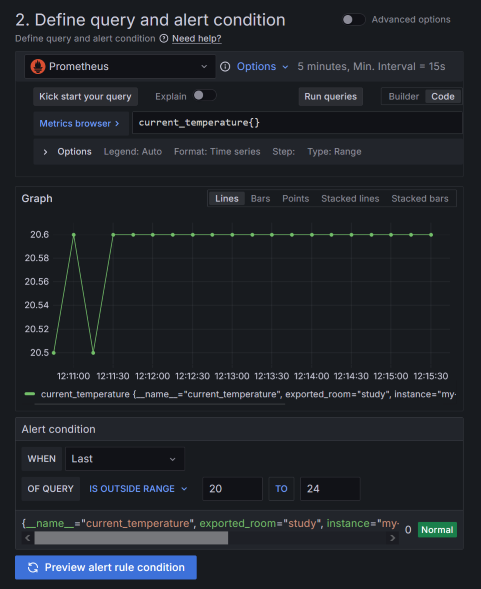
Define query and alert rule condition
- Under Alert condition, select
WHENLastIS OUTSIDE RANGE (20 to 24). This means the alert rule should only trigger if the temperature is less than 20C or greater than 24C. - Click Preview alert rule condition.

At this point, our alert instance should be working (it should be either in Firing or Normal state). If it returns an error, follow the instructions in the error message. If it returns “No data,” reselect the metrics from the Metrics browser. If you still get stuck, you are very welcome to submit an issue to the repo.
Set evaluation behavior
- In Folder, click + New folder and enter a name. For example: sensor-alerts. This folder contains our alert rules.
- In the Evaluation group, repeat the above step to create a new evaluation group. Name it room-sensor-group.
- Choose an Evaluation interval (how often the alert rule is evaluated). For example, every
1m(1 minute). - Set the pending period (aka, the “for” period). This is the time that a condition has to be met until the alert instance enters into a Firing state and a notification is sent. Set the pending period to,
0s(zero seconds), so the alert rule fires the moment the condition is met.
Configure labels and notifications
Choose the contact point where you want to receive your alert notifications.
Under Contact point, select Webhook from the drop-down menu.
Configure notification message
In this section, we can add a short summary of what happened and why to an alert notification. A summary annotation can combine plain text and template code that is evaluated when an alert rule is fired. We achieve this by using templates.
Here’s an example of a Summary using labels and values to interpolate the actual details of our alert rule:
- Paste in the following template into the Summary field.
the temperature in the room is {{ index $values "B" }}That’s it for our first alert rule. Click Save rule and exit.
Alert rule to monitor humidity
For our second alert, you basically repeat the steps above, except for the following differences:
- From the dashboard, edit the Humidity panel.
- Navigate to the Alert tab and click New alert rule.
- Under Alert condition, select
WHENLastIS OUTSIDE RANGE (40 to 65). This means the alert should only trigger if the humidity is less than 40% or greater than 65%. - Paste in the following template into the Summary field:
the humidity in the room is {{ index $values "B" }}- Click Save rule and exit.
You’ve finished creating both alert rules from their respective panels.
Receiving an alert notification
Once the alert rule condition is met, you should receive an alert notification. Notice that the actual value of the current temperature has been dynamically added to the summary annotation.

The alert notification comes with additional information besides the annotation summary we wrote, such as links to perform actions like silencing your alert rule or visiting the panel to which the alert rule is linked.
Once the alert rule is “Resolved,” a notification is sent with the update.
That’s it! Kudos on successfully creating and configuring your alert rule.
Learn more about Grafana Alerting
To learn more about this topic, please check out our Get started with Grafana Alerting - Part 2 tutorial, which dives deeper into alert instances and notification routing.
Grafana Alerting is available for Grafana OSS, Grafana Enterprise, or Grafana Cloud. The easiest way to get started is with Grafana Cloud’s generous forever-free tier. Sign up for free now!


