Do you need an OpenTelemetry Collector?
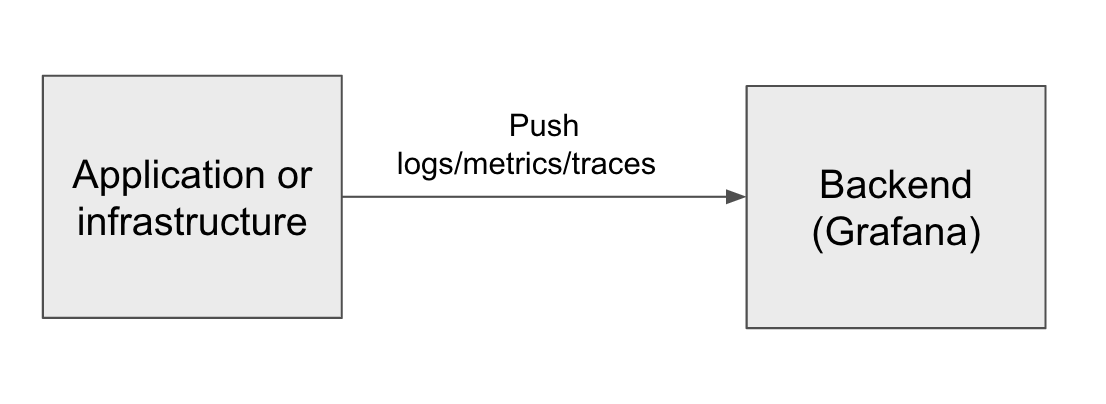
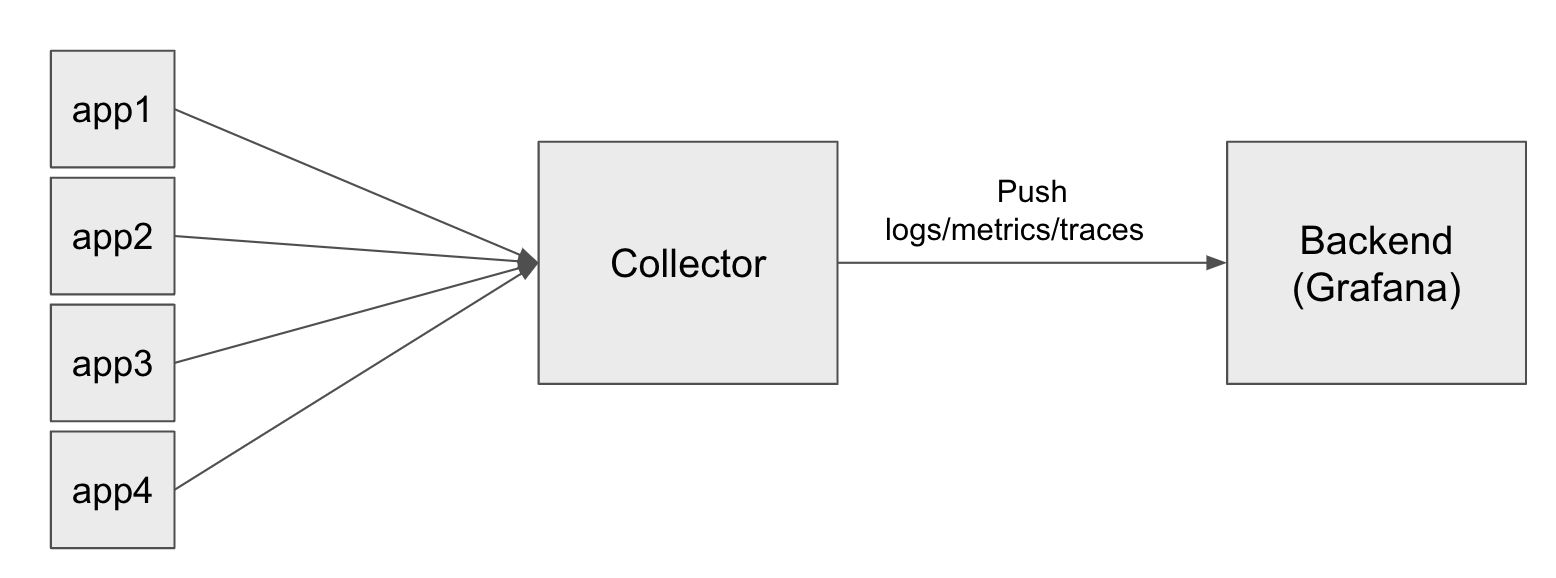
When you use OpenTelemetry SDKs to collect logs, metrics, and traces from infrastructure or an application, you’ll find many references to people using Grafana Agent and OpenTelemetry Collector. They start with an application or infrastructure that sends telemetry, and that data is sent to a collector, which then sends it to a backend like Grafana that may perform many functions, including visualization. The architecture looks like this:

The purpose of this article is to discuss why these intermediate collectors are so popular — and, ultimately, recommended. And don’t worry, I won’t make you wait for the punchline: if you want to collect any amount of telemetry with any frequency, you should use a collector. Now, let’s get into exactly why that is.
What’s a collector, and do I need one?
The telemetry “Collector” in the middle of the diagram above is a tool that can connect to various sources to gather telemetry (logs, metrics, and traces). These collectors serve as intermediaries, scraping and collecting data from different places and then transmitting it to a storage backend, abstracting away the complexities of data collection and storage. This collector model is common in the telemetry world; Prometheus is also used as intermediate software, for example, to gather metrics from applications like NGINX and send them to Grafana.
But if the application is already pushing telemetry, why have yet another software component to manage when we could just send the telemetry directly to the backend? After all, it is possible to send data directly to Grafana’s OpenTelemetry Protocol (OTLP) endpoint, without a collector or agent, by configuring your OTel SDK with an environment like this:
OTEL_EXPORTER_OTLP_PROTOCOL=http/protobuf
OTEL_EXPORTER_OTLP_ENDPOINT=https://otlp-gateway-prod-us-east-0.grafana.net/otlp
HEADER="Basic $(echo -n $GRAFANA_INSTANCE_ID:$TOKEN | base64)"
OTEL_EXPORTER_OTLP_HEADERS="Authorization=$HEADER"
OTEL_TRACES_EXPORTER=otlp
OTEL_METRICS_EXPORTER=otlp
OTEL_LOGS_EXPORTER=otlp
OTEL_SERVICE_NAME="my-cool-service"
This configuration works for testing setups. However, in real deployments we will run into many reasons why we want a collector in the middle.
The case for a collector: filtering sensitive data
Here’s a common situation: You’re capturing telemetry from a service that you didn’t write, and this service happens to log its own API tokens; or it logs certain kinds of user input, and users can input sensitive values like national identifiers, credit card numbers, and so on. Of course, it would be better if the application were written in a way to avoid this, but it’s a common scenario people find themselves in.
If telemetry is written straight from the infrastructure or application directly to a backend like Grafana Loki, you have a potential problem: Anyone with access to your Grafana system may be able to see user PII, not just the owners of the infrastructure that sent it.

Without a collector, this is hard to address; with one, it is pretty straightforward.
In the documentation, the OTel Collector has these topics under “transforming telemetry.” You could configure a processor to redact information, which might go like this: A processor is created, and then inserted into the logs pipeline.
processors:
  transform/redact_info:
    error_mode: ignore
    log_statements:
    - context: log
      statements:
      - replace_all_matches(attributes, "secret_value", "********")

service:
  pipelines:
    logs:
      receivers: [...]
      processors: [transform/redact_info, abc]
      exporters: [...]
In Grafana Agent, you can do the same with the wrapped otelcol.processor.transform component, using Flow configuration:
otelcol.processor.transform "redact_info" {
  error_mode = "ignore"

  log_statements {
    context = "log"
    statements = [
      "replace_all_matches(attributes, \"secret_value\", \"********\")",
    ]
  }
}
The case for a collector: managing cost
A second use case for a collector: helping to manage your bills by scrubbing and filtering telemetry data before you send it. Because Grafana charges by the gigabyte of data that is ingested, you can use a collector to drop things you know won’t get used, or that are particularly heavy. To put it another way: How much you send is how much you spend.
The recently announced Adaptive Metrics feature for Grafana Cloud has made big strides in permitting cost decisions to be made at the backend, but many organizations still want control on how much is sent in the first place. And if you’re running Grafana OSS or Grafana Enterprise, the volume of data you send still ends up on disk somewhere, charged by volume.

“Spray and pray” with telemetry data can be risky for both cost and privacy/governance reasons. The controls for what is sent at the application layer typically involves changing the app’s code. And while Grafana allows some control at the backend layer with Adaptive Metrics, the collector in the middle is the most powerful way to gate what is sent.
The case for a collector: decoupling
Reporting telemetry directly to the backend looks like a convenient option when you first start out, or when you are in the process of developing a new service. You can observe that service as you go and catch sensitive information before it makes it into the process. If that’s the case, maybe you don’t need that scrubbing and filtering. Or maybe you manually instrumented your application, so it also isn’t over-reporting.
This will work! The trouble with doing it this way is that the service is now tightly coupled to a backend endpoint. If your service is on a private network and can’t access the public internet, this won’t work. And if you’re pointing to Grafana OSS or Grafana Enterprise, this could be trouble. When you need to do maintenance on your Grafana instance (and it may incur some small amount of downtime), the service won’t be able to report telemetry during that time period, and there is no “buffer” in between.
Even worse: If the endpoint changes, you might have to restart your service because its environment is configured the wrong way. These are the downsides of coupling the telemetry-reporting service directly to the backend.
This gets particularly intense if you have a large number of microservices, or hundreds of different Linux machines. It just makes more sense to configure all of those telemetry reporters to point to a single collector (or fleet) of collectors. These collectors allow for much greater operational flexibility because:
- They can all be managed in one place
- Your apps and infrastructure remain coupled to the collectors
- The collector is responsible for routing the information beyond that point

The final consideration is switching backends. If you are switching from another observability platform to Grafana, or migrating from Grafana Enterprise to Grafana Cloud, it’s much easier to do this by targeting and changing only the collector layer of the architecture, rather than modifying all of the apps.
So should you ever go without a collector?
It depends on who you are. If you want to work on a throw-away project or you’re early in the development of a service, you can probably do well without a collector.
But there are other people who need step-by-step guides to instrument production systems. For example, if you are an SRE that works on many different codebases, you have very different constraints. Sometimes you can directly modify the application or infrastructure, and sometimes you most definitely do not want to do that, because it isn’t yours, or it’s in production.
For those who are directly modifying the app or infrastructure, and who are aware of the limitations and considerations here, going without a collector can be OK. But for most people, a collector will be beneficial in almost all cases. For this reason, you’ll see most of the documentation coming from Grafana Labs pushing people in the direction of using collectors, to avoid the potential pitfalls (coupling issues, maintenance, data volumes, and governance issues) down the road that we can foresee from the start.
Grafana Cloud is the easiest way to get started with metrics, logs, traces, and dashboards. We recently added new features to our generous forever-free tier, including access to all Enterprise plugins for three users. Plus there are plans for every use case. Sign up for free now!


