What is CI/CD observability, and how are we paving the way for more observable pipelines?
Observability isn’t just about watching for errors or monitoring for basic health signals. Instead, it goes deeper so you can understand the “why” behind the behaviors within your system.
CI/CD observability plays a key part in that. It’s about gaining an in-depth view of the entire pipeline of your continuous integration and deployment systems — looking at every code check-in, every test, every build, and every deployment. When you combine all this data, you get a holistic picture of the entire software delivery process, revealing areas of efficiency, bottlenecks, and potential points of failure.
In this blog, we’ll go deeper on the importance of observability for CI/CD pipelines. We’ll also discuss our quest for heightened CI/CD observability at Grafana Labs, and how it led us to envision a solution — a project known internally as GraCIe — that has the potential to democratize CI/CD insights for all Grafana users in the years ahead.
Why you should care about CI/CD observability
As the name implies, CI/CD observability is a subset of observability that’s focused on the software development lifecycle. It helps ensure processes are reliable, relatable, and understandable in multiple ways:
- Proactive problem solving. Without observability we can only react to problems. With it we can foresee and address issues before they escalate, saving time and resources.
- Better decision making. By understanding the ins and outs of our CI/CD processes, teams can make more informed decisions about resource allocation, process change, and tool adoption.
- Build confidence. With clear insights into the CI/CD pipeline, developers, testers, and operations teams can have more confidence in the software they release. It reduces the “fear of deployment” and fosters a culture of continuous improvement.
- Accountability and transparency. Observability ensures that every step of the CI/CD process is traceable. This means that if something goes wrong, it can be traced back to its source, promoting accountability and helping to address the root cause, not just the symptoms.
Common issues
CI/CD systems don’t come without their own challenges. Three commonly encountered issues that disrupt the smooth operation of CI/CD pipelines are flakiness, performance regressions, and misconfigurations.
Flakiness
Flaky tests are the unpredictable variables in the CI/CD equation. A test is considered “flaky” when it produces varying outcomes (pass or fail) without any changes in the code. Flakiness usually happens for a few reasons:
- External dependencies and environment issues. Tests that rely on external services, databases, or specific environment setups can yield unpredictable results if these dependencies aren’t consistently available. This can also happen if the environment isn’t set up correctly or is torn down unexpectedly. In essence, remnants from previous tests or the unavailability of an external service can skew the outcomes, making them unreliable.
- Race conditions. These arise when the system’s behavior is dependent on the sequence or timing of uncontrollable events. In asynchronous operations, especially, the unpredictable nature of event sequences can lead to sporadic failures if not properly managed.
Performance regression
System performance can start to degrade as CI/CD processes evolve and become more complex. This regression might not be evident right away, but the cumulative effects over extended periods can hamper the efficiency of the CI/CD pipeline. Here are common contributors:
- Inefficient test execution. Some tests might run longer than necessary, either because of redundant operations, waiting times that are set too long, or inefficient queries. This becomes especially visible in integration and end-to-end tests.
- Code and test bloat. As we add more features and tests without addressing technical debt or making optimizations, our build times can increase. Some tests might be slow right from when they’re added. If you don’t tackle these issues, the whole build and test process can drag on longer than needed.
Misconfigurations
Even the most well-thought-out pipelines can be thrown off by misconfigurations. This can lead to:
- Sub-optimal test plans. The CI/CD pipeline follows a critical path where each step is dependent on the previous one. If steps aren’t set up to execute in the right order or are waiting on non-dependencies, it can lead to inefficiencies.
- Sub-optimal capacity planning. Not provisioning enough resources or planning poorly for the required workload can lead to bottlenecks in the pipeline. If the CI/CD process doesn’t have the necessary capacity at critical stages, it can slow down the entire workflow or cause interruptions and failures.
Understanding the importance of DORA metrics
The DORA metrics, derived from the research by the DevOps Research and Assessment (DORA) group, have become the gold standard for measuring the effectiveness and health of software delivery and operations. These metrics include:
- Deployment frequency (DF): How often an organization successfully releases to production
- Mean Lead time for changes (MLT): The time it takes from code commit to code running in production
- Mean time to recover (MTTR): How long it takes to restore service after a service incident or a defect
- Change failure rate (CFR): The percentage of changes that cause a failure
Like we’ve already discussed, missteps with your CI/CD process can have ripple effects on the effectiveness and efficiency of software delivery. It can lead to longer deployment times, increased service restoration durations, and heightened risks of unsuccessful changes. Thus, optimizing CI/CD pipelines isn’t just about streamlining operations; it’s also about positively influencing vital software delivery metrics.
How we started to optimize CI/CD observability
The path to optimized CI/CD observability at Grafana Labs began with a singular focus. The delivery team wanted a better understanding of our own build processes in our most trafficked repository: grafana/grafana — our open source GitHub repository for Grafana.
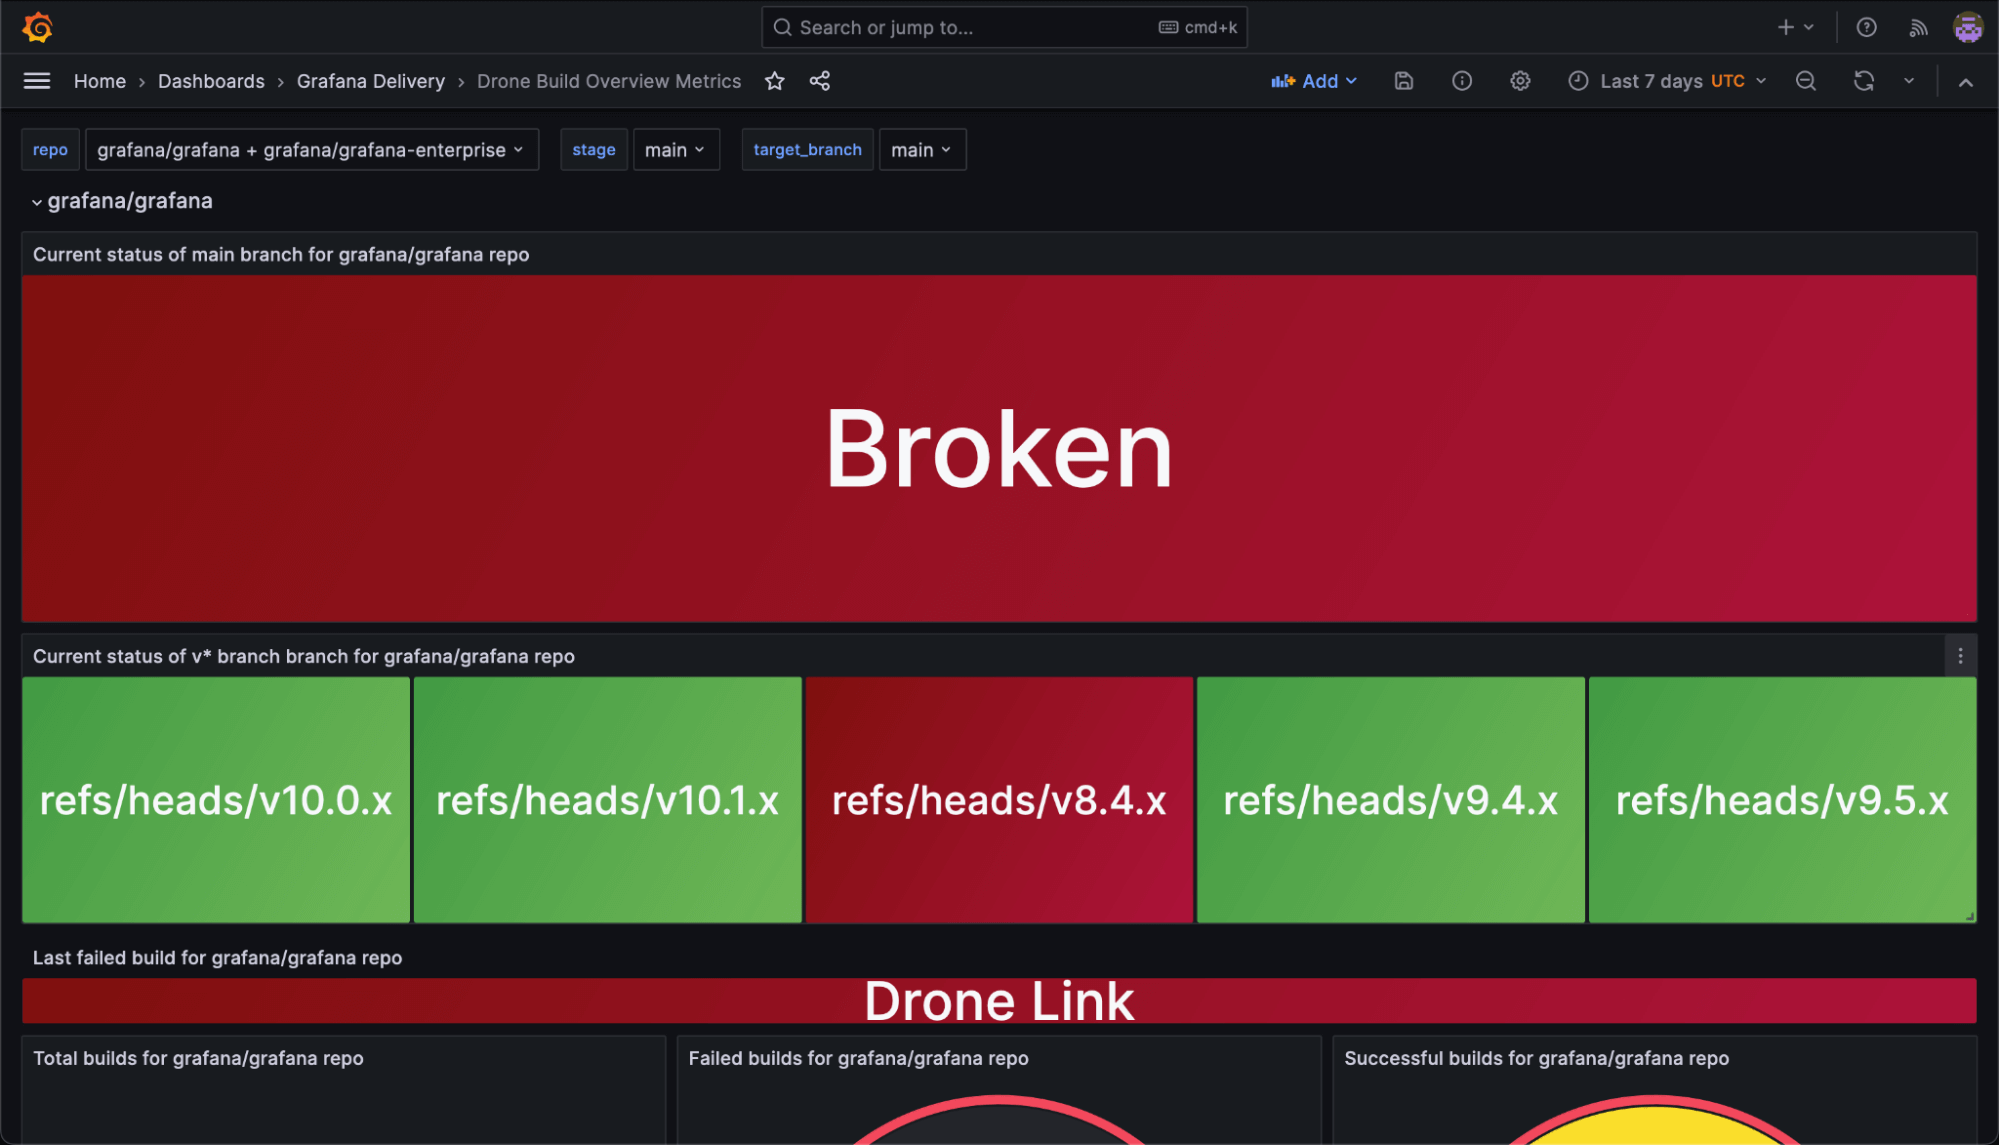
We were having issues with flaky tests, especially in Grafana OSS and Grafana Enterprise repos, which limited our ability to see if our main branches were broken. This, as a result, affected basically every repo in the Grafana Labs org. On top of that, we regularly had stuck runners in Drone, our CI tool, and we wanted to standardize how we displayed our CI/CD pipeline status.
We realized that while we had rich observability tools for our running software, our delivery process could benefit from a similar level of insight.
To bridge this gap, we originally created a custom Prometheus exporter, which armed us with a new influx of data. We designed dashboards to present the information in a visually intuitive manner so we could quickly get a grasp of our CI/CD health at a glance, accompanied by alerts for the things we cared about the most.
Here are a two examples of changes we made to ensure observability was part of our CI/CD process:
- We release Grafana from a set of protected branches. As such, Grafana must be buildable from those branches at any given time, so we added an alert to keep tabs on potential problems. When a build in one of those branches fails, the alert fires so we can fix the issue as soon as possible.
- We began keeping track of the number of restarts not triggered by any code change. We still have to understand exactly how to use this data effectively, but now, when we see an increase in this number, we assume it’s because of some sort of flakiness somewhere in the process. This may lead us to investigate further and prevent other contributors from experiencing the same issues.

Scaling our observability efforts
While our initial efforts were largely centered on the grafana/grafana repository, the success of our approach soon caught the attention of other teams within Grafana Labs. We recognized the potential to expand this observability to more repositories in our organization. However, we wanted to ensure that scaling up didn’t mean added overhead for these teams. Our vision was a seamless integration, where other teams could benefit without the hassle of setting everything up from scratch.
Moreover, we realized that the way we were observing our CI/CD pipelines on the grafana/grafana repo was highly opinionated, which also reflected in how we built these initial dashboards. The Grafana organization has tens — if not hundreds — of active repositories, each one with its own specific observability needs and processes.
Building with OpenTelemetry
To cater to our immediate needs, we are developing an OpenTelemetry receiver specifically tailored for Drone, our current CI tool. This not only addresses our own requirements but also sets the foundation for broader applications of our CI/CD observability solution.
But our vision goes far beyond our own environment. We anticipate a future where CI/CD vendors converge towards a common standard. A standard where telemetry data is universally accessible, regardless of the underlying CI/CD system.
Empowering CI/CD observability within Grafana
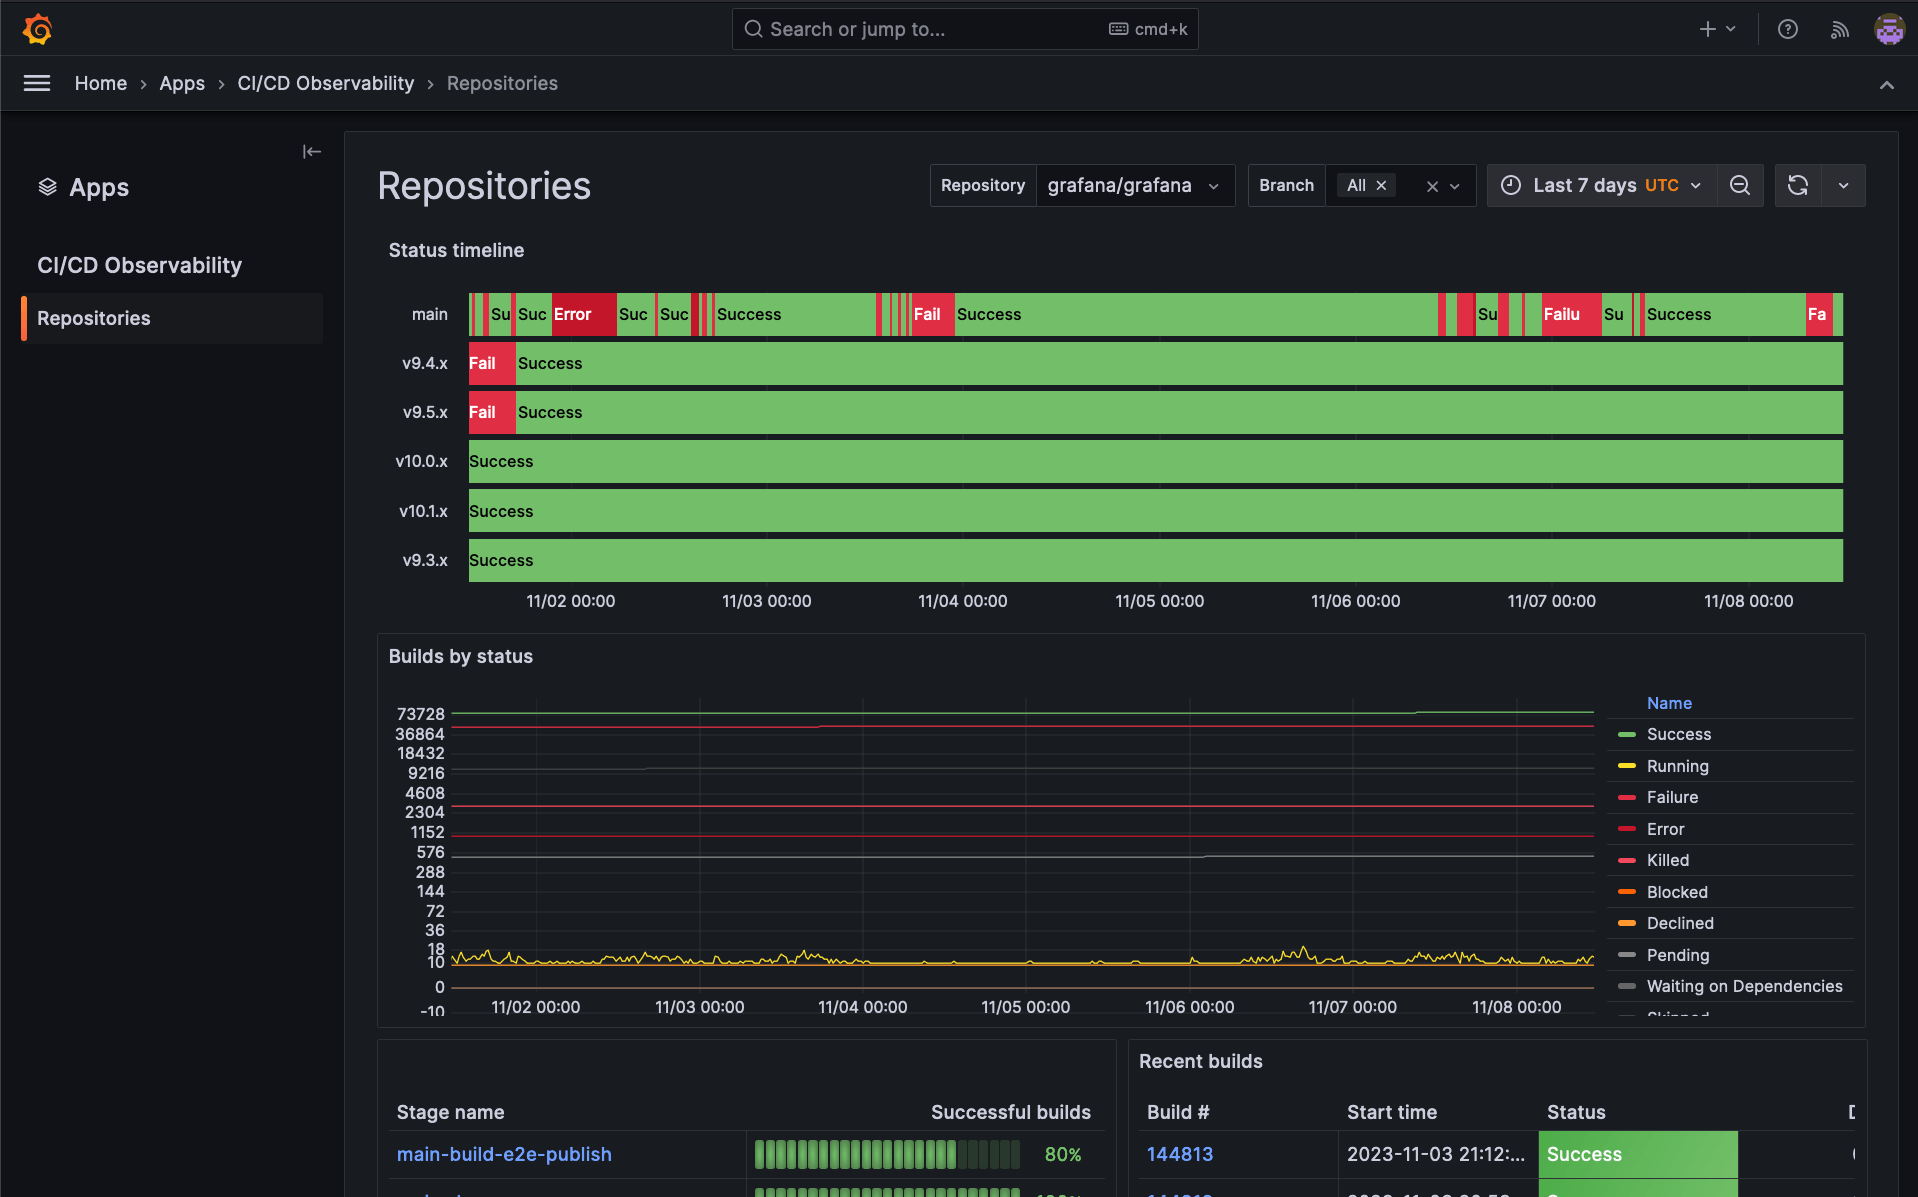
Taking into account everything above, we built GraCIe.
GraCIe is an opinionated Grafana application plugin we are building to provide users with an easy way to understand their CI/CD systems. It’s ideal for evaluating build performance, identifying inconsistencies in test results, and analyzing builds output. The application simplifies these processes, aiming to deliver insights about pipelines effortlessly.
By leveraging the power of Grafana Tempo, Grafana Loki, and Prometheus, we built an opinionated experience for a completely new domain, namely CI/CD observability, because it ultimately relies on the same telemetry signals used in more established observability use cases. Moreover, by relying on OpenTelemetry, GraCIe could seamlessly work with virtually any CI/CD platform, offering users the same unparalleled insights without the need for custom setups or configurations.


The future is interoperable
We’re just getting started with GraCIe. We’re not just looking to address today’s challenges — we’re actively looking to shape the future of CI/CD observability. We dream of a world where every Grafana user, irrespective of their CI/CD platform, has the tools and insights they need at their fingertips.
If you want to learn more about what we’re doing in this space, check out this OpenTelemetry proposal to add semantic conventions for CI/CD observability. And if you want to weigh in on the future of CI/CD observability, please share your feedback here.
Fellow Grafanistas Thanos Karachalios, Tobias Skarhed, and Haris Rozajac contributed to this blog post.


