
Announcing Application Observability in Grafana Cloud, with native support for OpenTelemetry and Prometheus
The Grafana LGTM Stack (Loki for logs, Grafana for visualization, Tempo for traces, and Mimir for metrics) offers the freedom and flexibility for monitoring application performance. But we’ve also heard from many of our users and customers that you need a solution that makes it easier and faster to get started with application monitoring.
During the opening keynote of ObservabilityCON 2023, we announced that we are delivering exactly that: We expanded Grafana Cloud’s capabilities to include Application Observability — an out-of-the box solution to minimize MTTR (mean time to resolution) and improve reliability across your applications.
Application Observability — which is now generally available for all Grafana Cloud users, including those in our generous free-forever tier — delivers a curated experience on top of the Grafana LGTM Stack, with preconfigured dashboards and workflows that makes implementing application monitoring easier and faster. You’ll also be able to set up alerts and SLOs, detect anomalies, and identify root causes.
Now with the addition of Application Observability to the fully managed Grafana Cloud platform, users can extend their observability stack to correlate between metrics, logs, and traces across frontend, application, and infrastructure layers — all in one place.
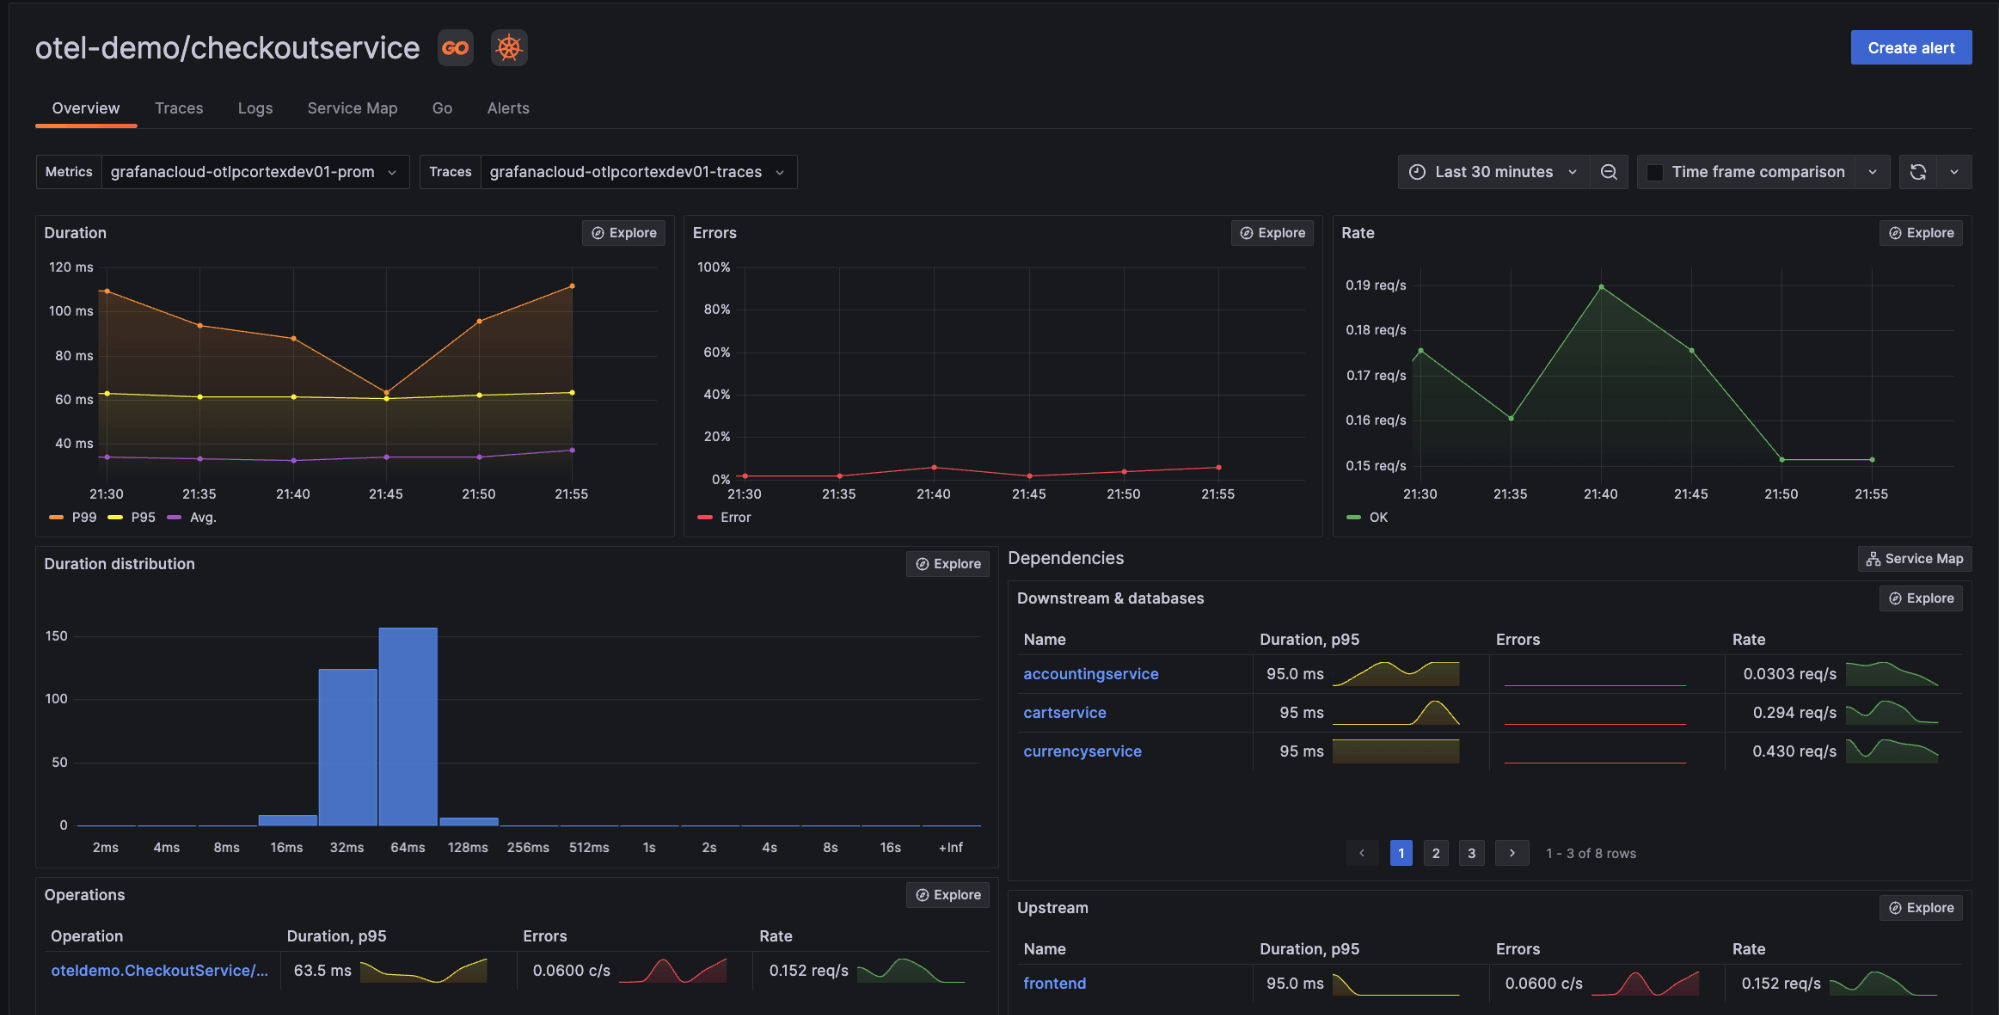
Application Observability with native support of both OpenTelemetry and Prometheus
As active participants in the OpenTelemetry open source community and the No. 1 company contributor to the Prometheus project, Grafana Labs is committed to improving the interoperability of OpenTelemetry and Prometheus.
This is why we built Application Observability with native support for both OpenTelemetry and Prometheus — to provide you with the flexibility to combine OpenTelemetry and Prometheus instrumentation as needed. (We recommend using OpenTelemetry auto-instrumentation agents and/or SDKs to instrument your applications, and we provide easy to use distributions for Java and .NET.)
Application Observability in Grafana Cloud also allows you to use PromQL-based query languages, such as LogQL and TraceQL, to interpret your data — even if it’s ingested in OpenTelemetry format.
With support for these open standards, Application Observability gives you the freedom to use the tools and platforms that best suit your observability stack, without vendor lock-in or proprietary auto instrumentation.
The diagram below illustrates our recommended architecture for Application Observability.
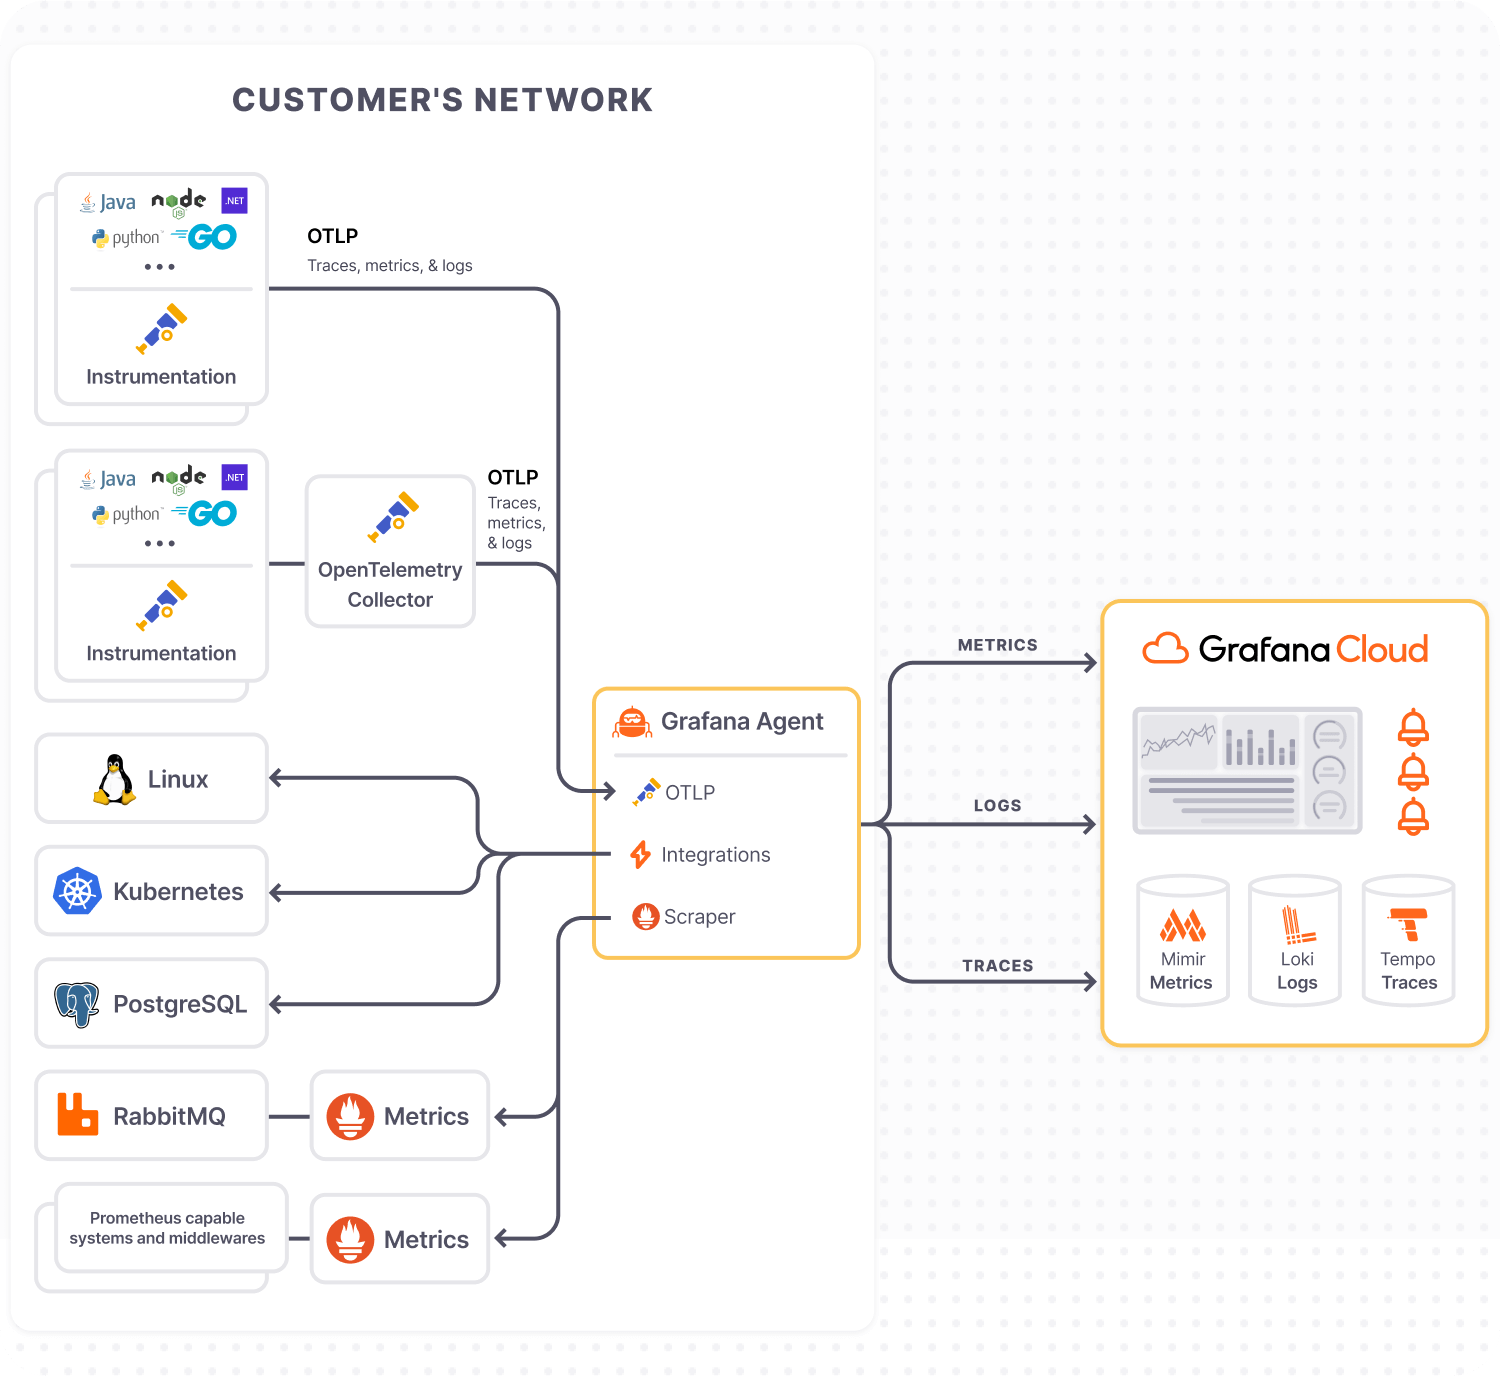
How Grafana Cloud Application Observability works with OpenTelemetry
Let’s walk through Application Observability in action.
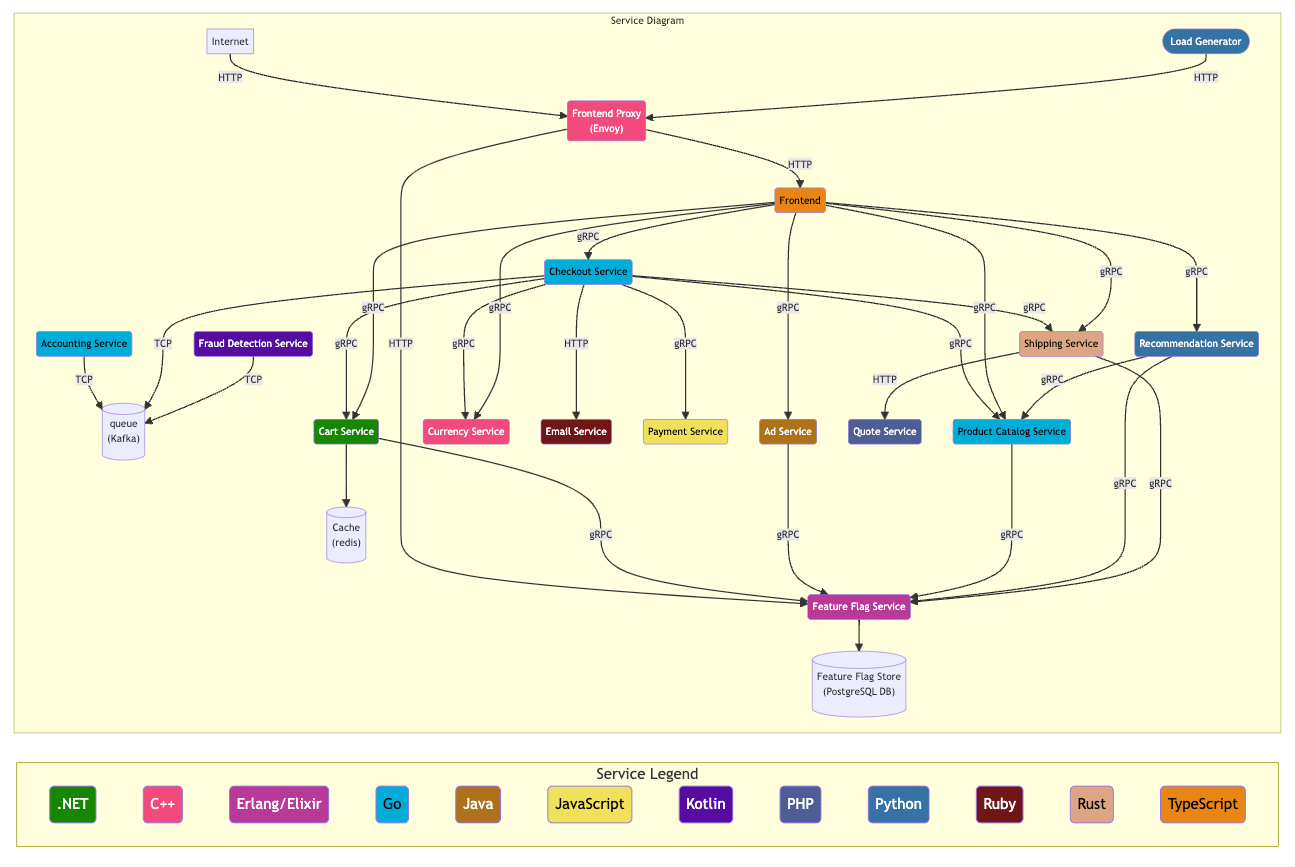
The OpenTelemetry Community Demo simulates an eCommerce store selling astronomy equipment. The app is composed of 14+ microservices that talk to each other over gRPC and HTTP. These microservices are written in different programming languages and instrumented using OpenTelemetry.
The diagram below shows the data flow and programming languages used.
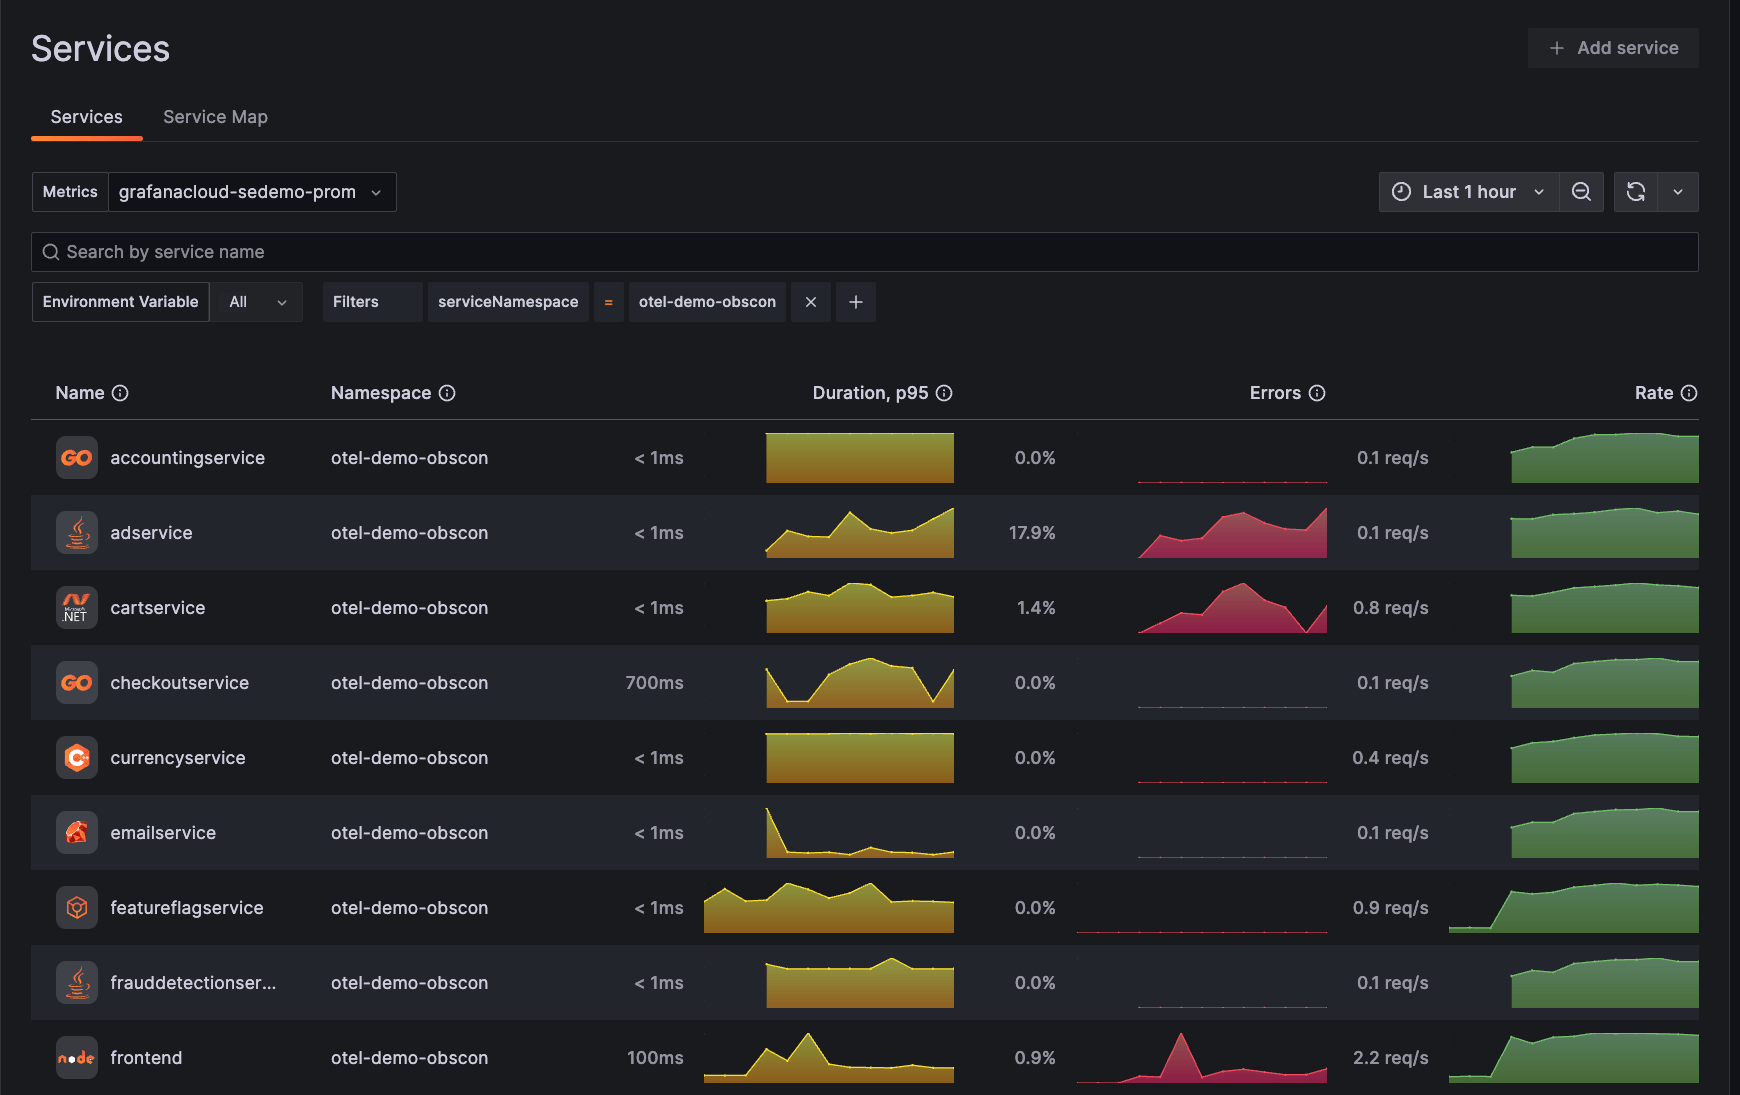
Let’s imagine that you get an alert from Grafana Cloud Application Observability that indicates an elevated error rate on the business-critical cart service. Following the alert message, you are seamlessly directed to the Service Inventory page, which provides an out-of-the box, top-down view showing the aggregated RED (request rate, error, duration) metrics of all services including the problematic cart service.
To get a better sense of the eCommerce app’s architecture and the cart service’s role within it, you open the Service Map view, presenting a dynamic visualization of the services and their activities.

As you confirm that the cart service is experiencing an abnormal error rate, you decide to take a close look at it to find out what might be happening. After drilling down into the cart service, you are presented with multiple tabs for Overview, Traces, Logs, Service Map, .NET, and Alerts. These signals are correlated behind the scenes and scoped to the cart service to preserve context for each and facilitate your troubleshooting.

The Service Overview page displays detailed RED metrics for the cart service, as well as for its upstream and downstream services that may be contributing to poor performance. The duration distribution graph helps you better visualize what percentage of end users are having a slow experience. Next to the service name, a set of technology icons is automatically displayed, including a .NET icon, indicating the programming language; a Kubernetes icon, as the service is using Kubernetes; and a Cloud icon, as the service is deployed on a cloud environment. As Application Observability automatically correlates application and infrastructure telemetry for you, you can hover over the Kubernetes icon to view the environment labels and navigate to Kubernetes Monitoring in Grafana Cloud.

The Operations panel in Service Overview gives you more granular RED metrics for the specific operations performed on the cart service. Here, you see the oteldemo.CartService/EmptyCart operation is experiencing both errors and elevated P99 latency.

Clicking into the oteldemo.CartService/EmptyCart operation and opening the Traces tab in the header allows you to immediately examine the distributed traces linked to the oteldemo.CartService/EmptyCart operation to understand what might be causing the issue.
You then filter the trace list for only those that contain an error and select the longest trace to investigate. Because this distributed trace contains a couple of error spans in both the checkout and cart service, you expand the CartService/EmptyCart span to see more detail.
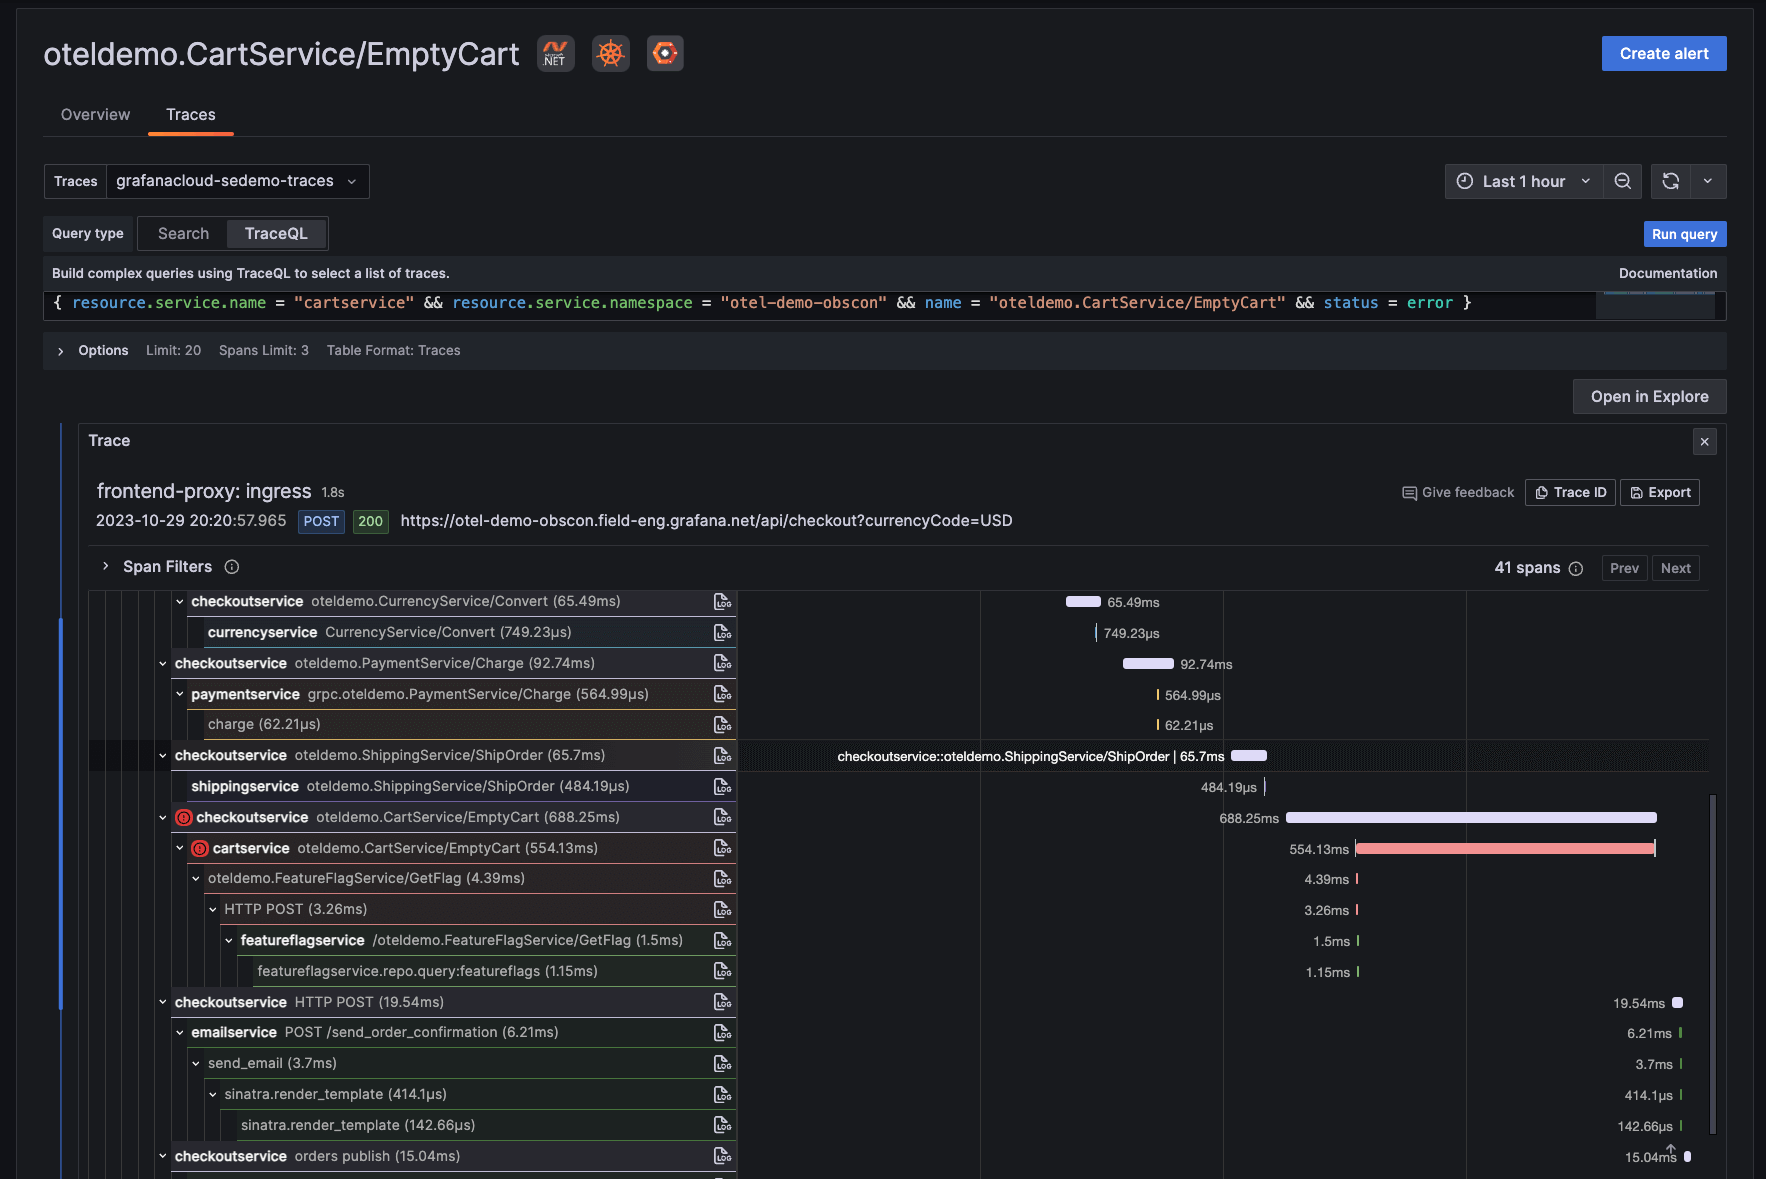
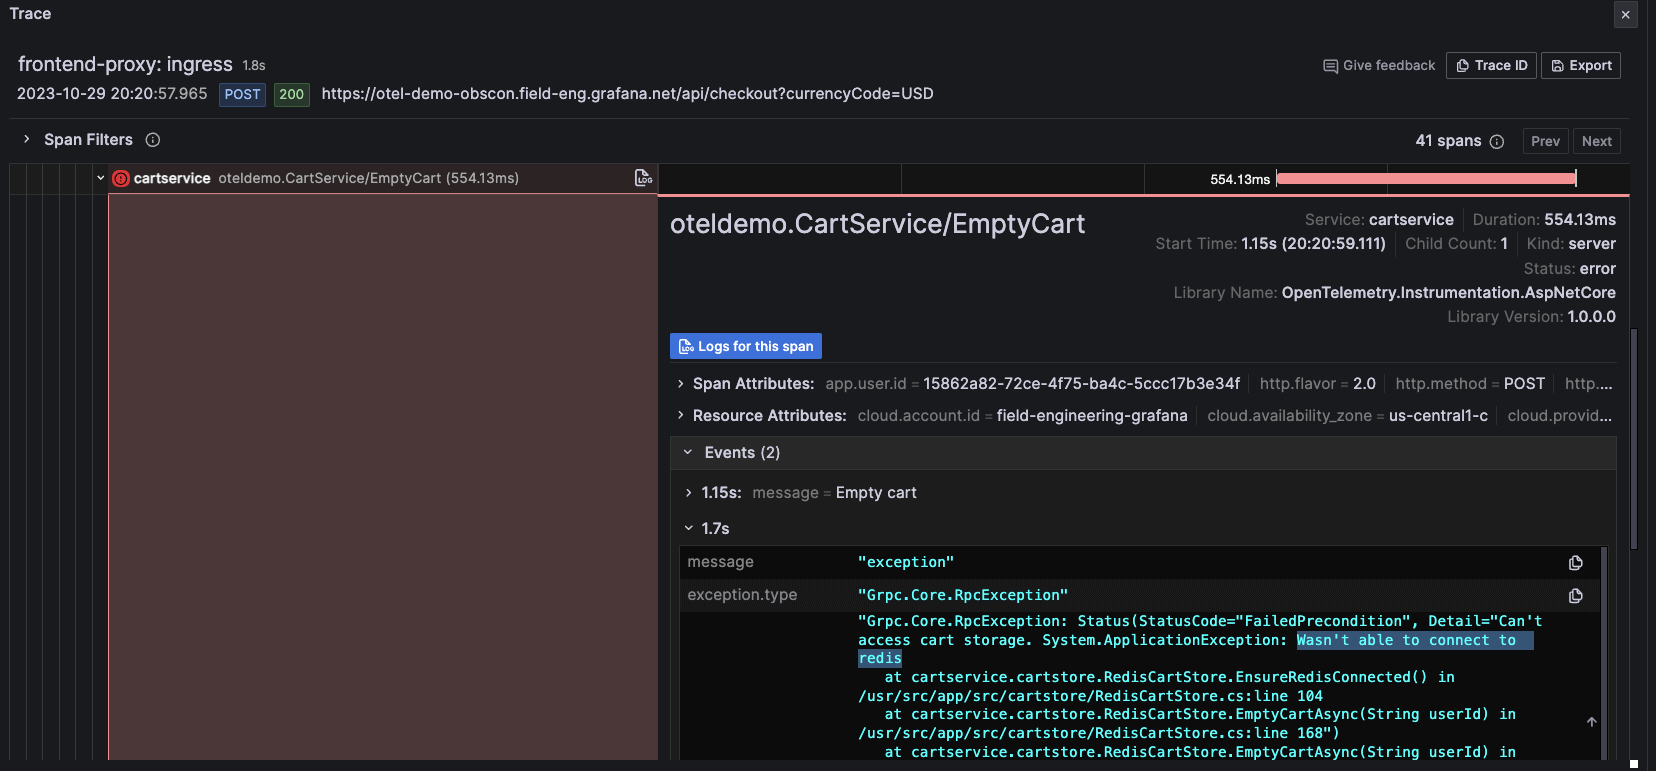
Within the distributed trace span view, you have a lot of useful metadata including Span Attributes, Resource Attributes, and Events. By examining the Events section, you discover that this specific call was unable to connect to Redis.
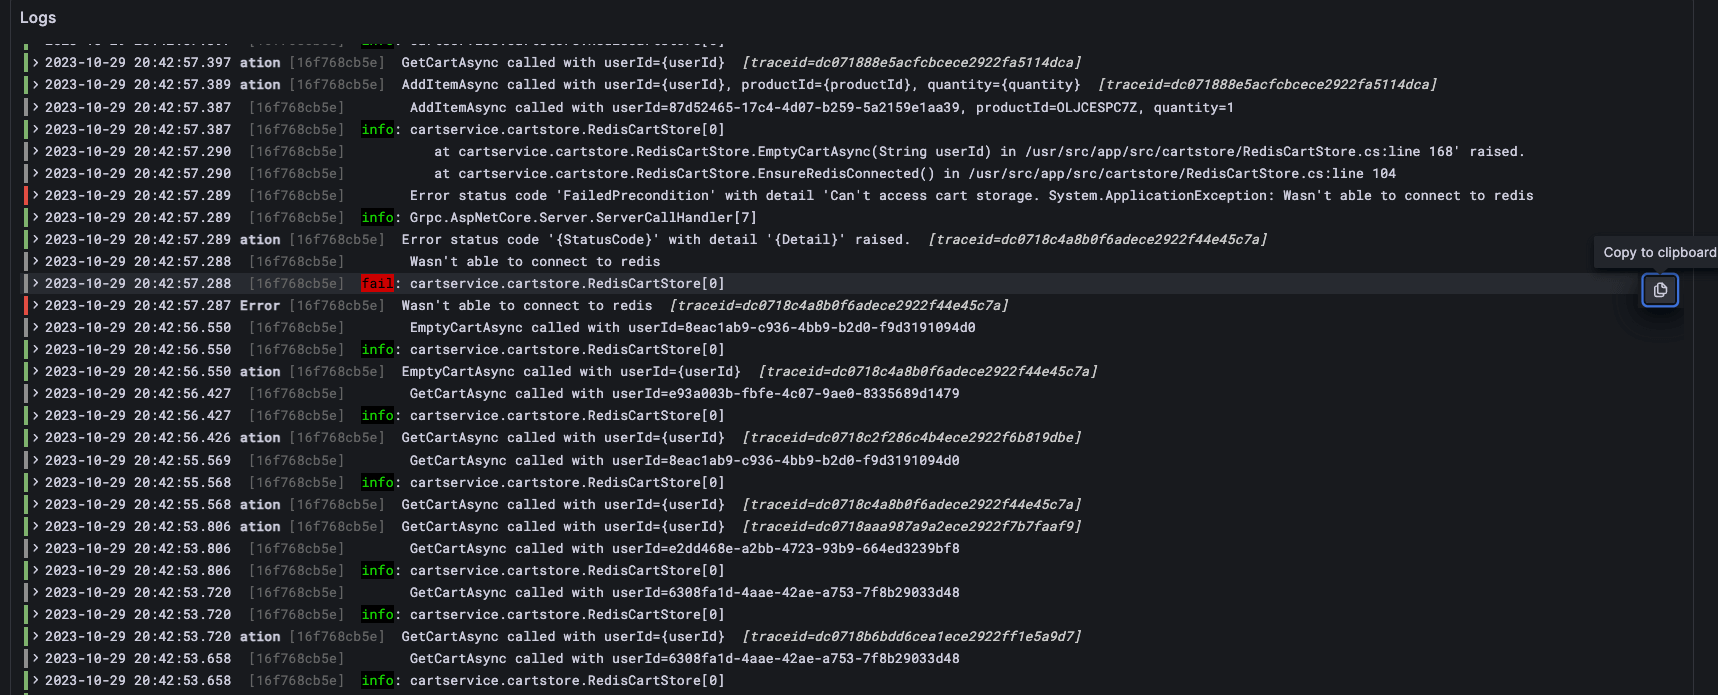
To validate this and see the sequence of events that led to this failure, you simply click the Logs for this span icon to view the logs associated with the specific span. Seeing the same error message in logs confirms that your application is having an issue connecting to Redis. Now that the root cause of the elevated error rate of your application has been identified, you can work with your team to quickly resolve it and prevent any negative impact on your customers and revenue.

Get started with Grafana Cloud Application Observability
Application Observability is now generally available for all Grafana Cloud users, including those in our generous free-forever tier.
How to set up Application Observability
- Opt in for Grafana Cloud metrics generation, if it is not already enabled.
- Instrument your application using OpenTelemetry.
- Use the Grafana Agent with the OpenTelemetry (OTLP) integration (recommended) or the OpenTelemetry Collector to send telemetry to Grafana Cloud.
For full implementation details and best practices, see our Application Observability documentation.
Grafana Cloud is the easiest way to get started with metrics, logs, traces, and dashboards. We recently added new features to our generous forever-free tier, including access to all Enterprise plugins for three users. Plus there are plans for every use case. Sign up for a free account today!


