How to integrate a Spring Boot app with Grafana using OpenTelemetry standards
Maciej Nawrocki, Senior Backend Developer at Bright Inventions, is a backend developer focused on DevOps and monitoring. Adam Waniak, Senior Backend Developer at Bright Inventions, is a backend developer with a keen interest in DevOps. Bright Inventions is a software consulting studio based in Gdansk, Poland, with expertise in mobile, web, blockchain, and IOT systems.
At Bright Inventions, we always prioritize app optimization when we develop software solutions for our clients. However, you can’t optimize things you do not measure. This is where tools like Grafana come into play, offering a powerful platform for visualizing and analyzing metrics in real-time.
Spring Boot is a widely known framework and we use it on a daily basis. It comes with its own set of metrics and monitoring capabilities. However, to truly harness the power of these metrics, integrating with a visualization tool like Grafana can be invaluable.

In this guide, we’ll show you how to integrate a Spring Boot application with Grafana using OpenTelemetry standards. We’ll also include several practical examples to help you follow along!
Integrating a Spring Boot application with Grafana for metrics, logs, and traces
To help you start monitoring your Spring Boot application with Grafana, we’ll show you how to set up Docker containers for the application and OpenTelemetry Collector; how to configure the necessary sidecars and collectors; and finally, how to deploy everything seamlessly on Amazon Elastic Container Service (Amazon ECS). Check out all five steps below.
Step 1: Integrate OpenTelemetry Java instrumentation
For Java applications, instrumentation is provided as a sidecar. This means it’s an application that runs alongside our main application.
First we create a Dockerfile that allows us to create an image for a Java application with OpenTelemetry instrumentation enabled, allowing the application to produce telemetry data (like traces and metrics) that can be collected and analyzed by OpenTelemetry-compatible tools.
The Dockerfile definition will be handy for AWS deployment; adding a Java agent to the running configuration simplifies local development.
FROM bellsoft/liberica-openjdk-alpine:17
ARG JAR_FILE=build/libs/\*.jar
COPY ${JAR_FILE} app.jar
ADD https://github.com/open-telemetry/opentelemetry-java-instrumentation/releases/download/v1.30.0/opentelemetry-javaagent.jar /opt/opentelemetry-agent.jar
ENTRYPOINT java -javaagent:/opt/opentelemetry-agent.jar \
    -Dotel.resource.attributes=service.instance.id=$HOSTNAME \
    -jar /app.jar
This Dockerfile describes the steps to create a Docker image for a Java application, with OpenTelemetry instrumentation enabled. Let’s break down each line.
FROM bellsoft/liberica-openjdk-alpine:17
- This line specifies the base image for the Docker container. In this case, it’s using the Liberica OpenJDK 17 image based on Alpine Linux. Liberica is a certified distribution of OpenJDK.
ARG JAR_FILE=build/libs/*.jar
- This line defines a build-time argument named JAR_FILE with a default value pointing to a JAR file located in the build/libs directory. This JAR file is presumably the compiled output of a Java application.
COPY ${JAR_FILE} app.jar
- This line copies the JAR file specified by the JAR_FILE argument into the Docker image and renames it to app.jar.
ADD https://github.com/open-telemetry/opentelemetry-java-instrumentation/releases/download/v1.30.0/opentelemetry-javaagent.jar /opt/opentelemetry-agent.jar
- This line downloads the OpenTelemetry Java agent (version 1.26.0) directly from the GitHub releases page and places it in the /opt directory of the Docker image with the name opentelemetry-agent.jar.
ENTRYPOINT java -javaagent:/opt/opentelemetry-agent.jar\ -Dotel.resource.attributes=service.instance.id=$HOSTNAME \ -jar /app.jar
- This line defines the command that will be executed when a container is started from this image. It runs the Java application with the OpenTelemetry Java agent enabled. The -javaagent flag specifies the path to the OpenTelemetry agent JAR.
- -Dotel.resource.attributes=service.instance.id=$HOSTNAME sets
service.instance.idfrom OpenTelemetry semantic conventions. This one needs to be set in Dockerfile, because HOSTNAME, which is the Docker container ID, is assigned dynamically when the container starts. - The
-jar /app.jarargument tells Java to run the application from the app.jar file that was copied into the image.
For local development you can download the OpenTelemetry Java agent and add it to the run configuration with required OTel settings.
Step 2: Prepare the OpenTelemetry Collector configuration
This configuration sets up an OpenTelemetry Collector to receive telemetry data via OpenTelemetry Protocol (OTLP), process it, and then export traces to an OTLP endpoint (with basic authentication) and metrics to a Prometheus remote write endpoint (also with basic authentication). It also adds specific attributes to the metrics data.
We start by creating a Dockerfile from OpenTelemetry Collector image with custom configuration.
FROM otel/opentelemetry-collector-contrib:0.77.0
COPY collector-config.yml /etc/otelcol-contrib/config.yaml
FROM otel/opentelemetry-collector-contrib:0.77.0
- This line specifies the base image for the Docker container. The base image is the OpenTelemetry Collector Contrib version 0.77.0. The “contrib” version of the OpenTelemetry Collector includes additional components and receivers that are not present in the core version, providing extended functionality.
COPY collector-config.yml /etc/otelcol-contrib/config.yaml
- This line copies a file named collector-config.yml from the host (or the build context) into the Docker image. The file is placed in the /etc/otelcol-contrib/ directory of the image and is renamed to config.yaml. This file is a custom configuration for the OpenTelemetry Collector.
When a container is started from this image, the OpenTelemetry Collector will run using the custom configuration provided in collector-config.yml. This allows users to define their own pipelines, receivers, processors, and exporters, tailoring the collector to their specific needs.
collector-config.yml:
extensions:
  basicauth/traces:
    client_auth:
      username: "${TEMPO_USERNAME}"
      password: "${TEMPO_PASSWORD}"
  basicauth/metrics:
    client_auth:
      username: "${PROM_USERNAME}"
      password: "${PROM_PASSWORD}"
  basicauth/logs:
    client_auth:
      username: "${LOKI_USERNAME}"
      password: "${LOKI_PASSWORD}"

receivers:
  otlp:
    protocols:
      grpc:
      http:

processors:
  batch:
  attributes/metrics:
    actions:
      - action: insert
        key: deployment.environment
        value: "${DEPLOY_ENV}"
      - key: "process_command_args"
        action: "delete"
  attributes/logs:
    actions:
      - action: insert
        key: loki.attribute.labels
        value: container
      - action: insert
        key: loki.format
        value: raw

exporters:
  otlp:
    endpoint: "${TEMPO_ENDPOINT}"
    auth:
      authenticator: basicauth/traces

  prometheusremotewrite:
    endpoint: "${PROM_ENDPOINT}"
    auth:
      authenticator: basicauth/metrics

  loki:
    endpoint: "${LOKI_ENDPOINT}"
    auth:
      authenticator: basicauth/logs

service:
  extensions: [ basicauth/traces, basicauth/metrics, basicauth/logs ]
  pipelines:
    traces:
      receivers: [ otlp ]
      processors: [ batch ]
      exporters: [ otlp ]

    metrics:
      receivers: [ otlp ]
      processors: [ batch,attributes/metrics ]
      exporters: [ prometheusremotewrite ]

    logs:
      receivers: [ otlp ]
      processors: [ batch,attributes/logs ]
      exporters: [ loki ]
This configuration defines the setup for an OpenTelemetry Collector. Let’s break it down section by section.
Extensions
- This section defines extensions that can be added to the collector. Extensions are optional components that can provide additional capabilities.
- Three basic authentication extensions are defined: one for traces (basicauth/traces), one for metrics (basicauth/metrics), and one for logs(basicauth/logs). These extensions will allow the collector to authenticate with external services using basic authentication.
- The usernames and passwords for these extensions are set using environment variables (${TEMPO_USERNAME}, ${TEMPO_PASSWORD}, ${PROM_USERNAME}, ${PROM_PASSWORD}, ${LOKI_USERNAME}, and ${LOKI_PASSWORD} ).
Receivers
- The OTLP Receiver is defined, which can receive telemetry data using OTLP.
- Two protocols are enabled for this receiver: gRPC and HTTP.
Processors
The batch processor is defined, which batches multiple telemetry data points into fewer, larger groupings to optimize transmission.
The attributes processor is defined to add or modify attributes of the telemetry data.
attributes/metricsare set to insertdeployment.environmentwith a value from the ${DEPLOY_ENV} environment variable and drop process_command_args metrics label, which is long and will not be used by us.attributes/logsare configured according to Grafana Labs’ recommendation.
Exporters
- The OTLP Exporter is defined to send trace data to an endpoint specified by the ${TEMPO_ENDPOINT} environment variable. It uses the basicauth/traces extension for authentication.
- The prometheusremotewrite exporter is defined to send metric data to an endpoint specified by the ${PROM_ENDPOINT} environment variable. It uses the basicauth/metrics extension for authentication.
- The Grafana Loki exporter is configured to send logs to Grafana Cloud Logs.
Service
This section defines which extensions, receivers, processors, and exporters are active.
Both basic authentication extensions (basicauth/traces and basicauth/metrics) are activated.
Three pipelines are defined:
- The traces pipeline receives data using the OTLP receiver, processes it with the batch processor, and exports it using the OTLP exporter.
- The metrics pipeline receives data using the OTLP receiver, processes it with both the batch and attributes processors, and exports it using the prometheusremotewrite exporter.
- The logs pipeline receives data using the OTLP receiver, processes it with the batch and attributes/logs processors, and exports it using the Loki exporter.
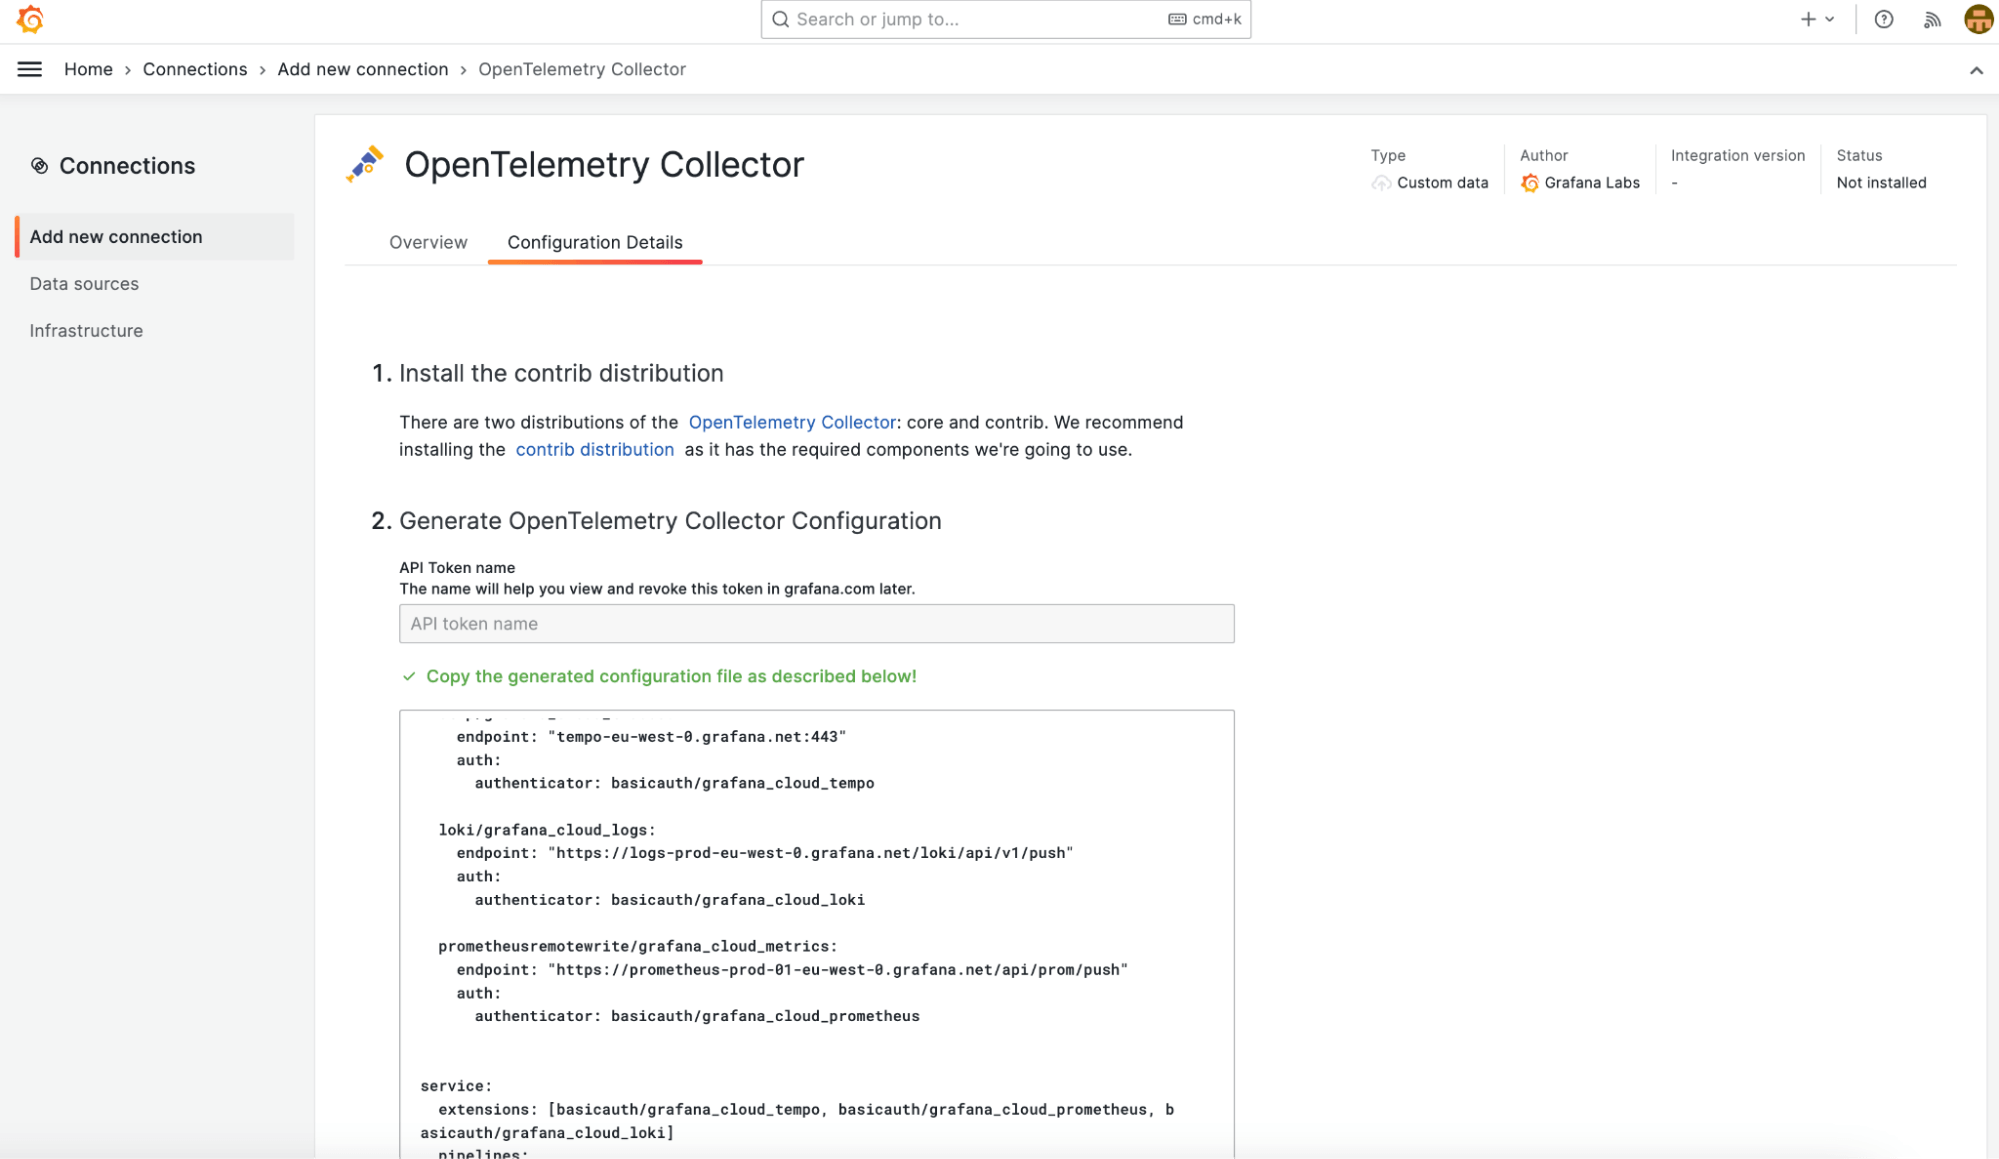
You can automatically generate a minimal configuration for the OpenTelemetry Collector within Grafana. To access this feature, navigate to: Home > Connections > Add New Connection > OpenTelemetry Collector or directly via the link: https://[yourname].grafana.net/connections/add-new-connection/collector-open-telemetry.

Please note that usernames, passwords, and endpoints are explicitly defined in the generated configuration. For security reasons, we recommend setting these as environment variables. Utilize this feature to swiftly retrieve credentials and endpoints for metrics (Prometheus), logs (Grafana Loki), and traces (Grafana Tempo).
The environment variables should be stored in the .env file:
LOKI_USERNAME=123456
LOKI_PASSWORD=eyXXXXXXXXXXXXXXXXXXXXXXXXXXXXXXXXXXXXXXXXXXX0=
LOKI_ENDPOINT=https://logs-prod-eu-west-0.grafana.net/api/prom/push

TEMPO_ENDPOINT=tempo-eu-west-0.grafana.net:443
TEMPO_USERNAME=234567
TEMPO_PASSWORD=glc_eyXXXXXXXXXXXXXXXXXXXXXXXXXXXXXXXXXXXXXXXXXXX0=

PROM_ENDPOINT=https://prometheus-prod-01-eu-west-0.grafana.net/api/prom/push
PROM_USERNAME=345678
PROM_PASSWORD=eyXXXXXXXXXXXXXXXXXXXXXXXXXXXXXXXXXXXXXXXXXXX0=
Step 3: Set up Docker Compose
Now we set up a docker-compose file with an application and an OpenTelemetry Collector. The application sends telemetry data to the collector, which can then process and export it to other systems. The setup ensures that the application and the collector can communicate over a shared network.
version: '3.8'
services:
  opentelemetry-collector:
    build:
      context: ./otel-collector
      dockerfile: Dockerfile
    ports:
      - "4317:4317"   # OTLP gRPC receiver
    environment:
      DEPLOY_ENV: local
    env_file:
      .env
    networks:
      - observability-example

  application:
    build:
      context: .
      dockerfile: Dockerfile
    ports:
      - "8080:8080"
    depends_on:
      - opentelemetry-collector
    environment:
      OTEL_TRACES_SAMPLER: always_on
      OTEL_TRACES_EXPORTER: otlp
      OTEL_METRICS_EXPORTER: otlp
      OTEL_LOGS_EXPORTER: otlp
      OTEL_EXPORTER_OTLP_PROTOCOL: grpc
      OTEL_SERVICE_NAME: observability-example
      OTEL_EXPORTER_OTLP_ENDPOINT: http://opentelemetry-collector:4317
      OTEL_PROPAGATORS: tracecontext,baggage,

    networks:
      - observability-example

networks:
  observability-example:
This docker-compose file defines a multi-container application setup using Docker Compose. Let’s break it down:
opentelemetry-collector
- This service builds an image using the Dockerfile located in the ./otel-collector directory.
- It exposes Port 4317, which corresponds to the OTLP gRPC receiver. This means that other services or applications can send telemetry data to this collector on this port.
- The service uses an environment file named .env to set environment variables.
- It’s connected to a network named “observability-example.”
application
This service builds an image using the Dockerfile located in the current directory (.).
It exposes Port 8080.
The depends_on directive indicates that this service should start only after the opentelemetry-collector service has started.
The environment section sets environment variables for the application. These variables configure the application’s OpenTelemetry instrumentation:
- OTEL_EXPORTER_OTLP_ENDPOINT: Specifies the endpoint for the OTLP exporter. The application will send telemetry data to the opentelemetry-collector service on port 4317.
- OTEL_PROPAGATORS: Configures the propagators used for context propagation. In this case, it uses tracecontext and baggage.
- OTEL_METRICS_EXPORTER/OTEL_TRACES_EXPORTER/OTEL_LOGS_EXPORTER: Specifies the metrics exporter to use, which is “otlp” in this case.
- It’s also connected to the observability-example network.
Running the provided docker-compose file sets up an environment where an application can be instrumented and monitored using the OpenTelemetry Collector.
Step 4: Deploy Spring Boot app and OpenTelemetry Collector on AWS ECS (optional)
Now that we have Docker definitions for both the Spring application and the OpenTelemetry Collector, let’s move on to deploying them on Amazon ECS.
We use ECS in our example because we mainly rely on AWS as our cloud provider at Bright Inventions. However, it’s worth noting alternatives like Kubernetes, Docker Swarm, or any other cloud provider could be equally considered, depending on your specific infrastructure requirements and preferences.
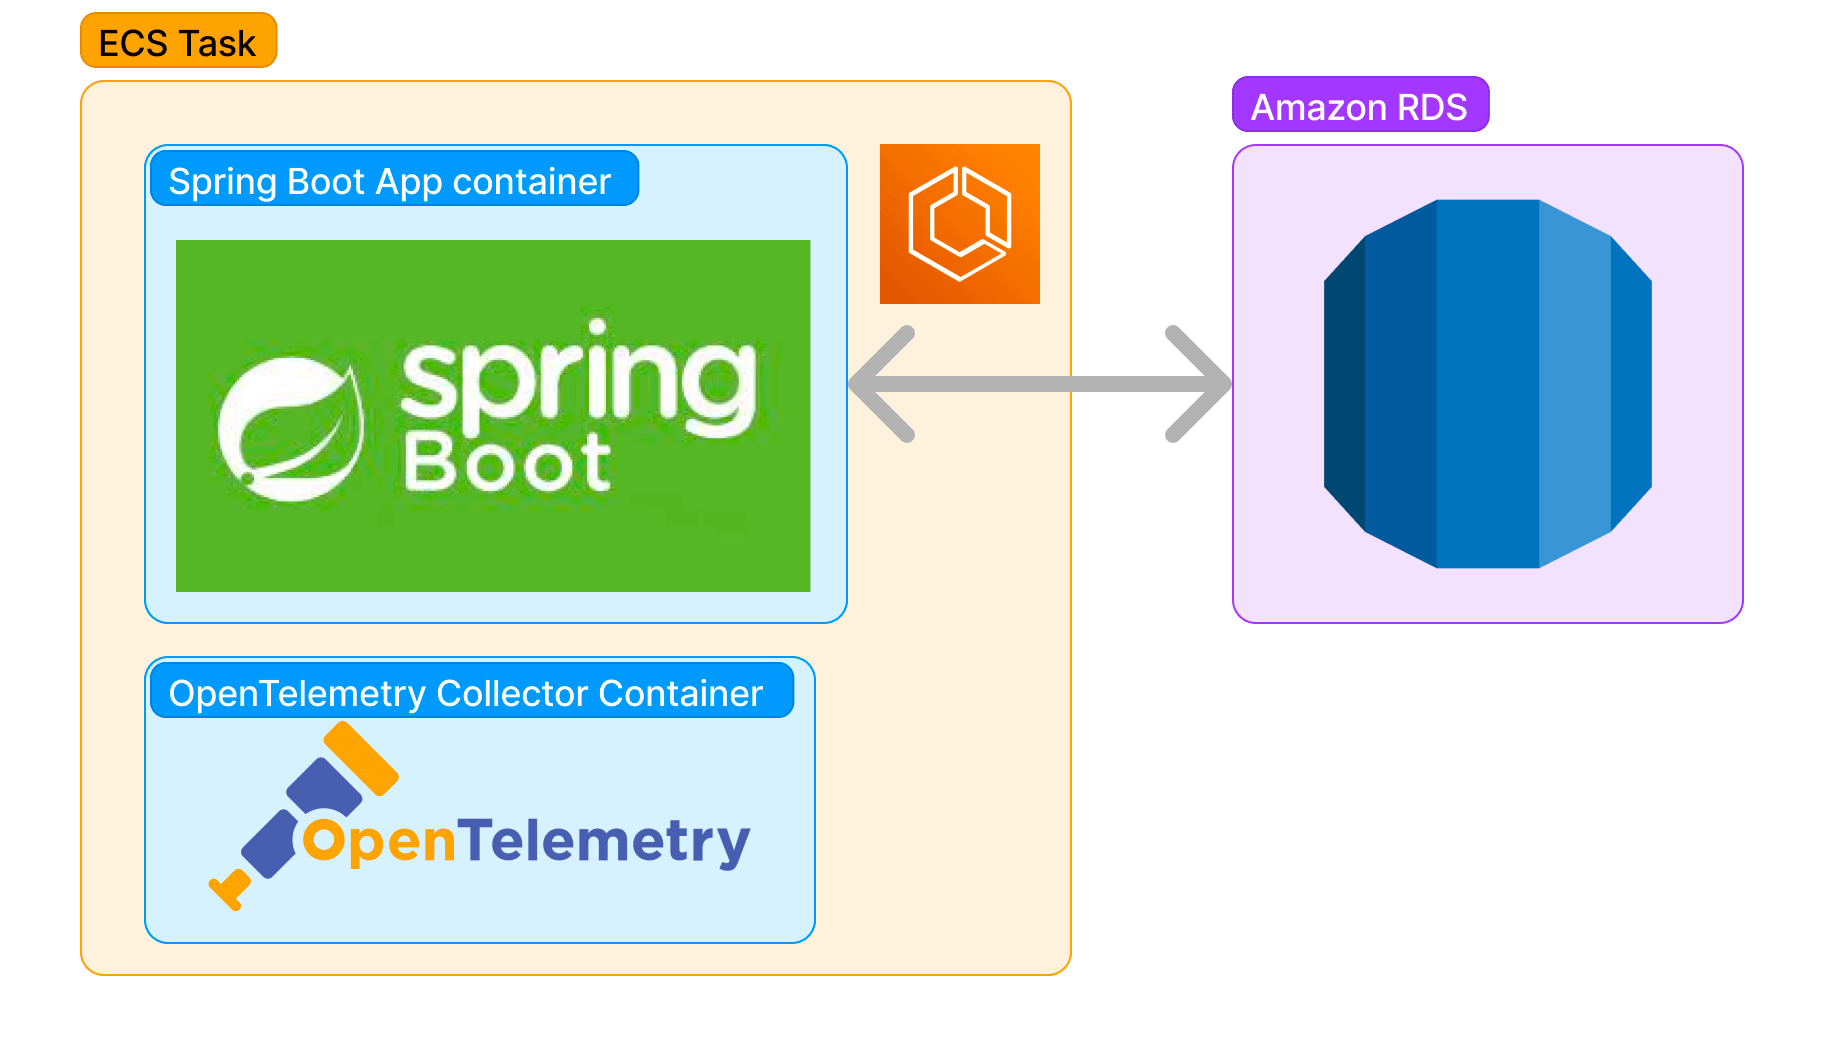
Instead of combining both components into one container, we’ll deploy them as separate entities within the same ECS task. This approach ensures individual lifecycles for each component while allowing seamless communication, thanks to their shared network namespace.
The steps to do that are as follows:
- Create Elastic Container Registry (ECR) repositories — for app and otel-collector
- Build and push your Docker images to ECR
- Create an ECS task definition that includes both the application and the collector
- Deploy them together as a service on ECS
An example project with the specified process is available in our GitLab repository. The act of building and pushing Docker images as well as the deployment itself are handled through the GitLab CI/CD pipeline. Task definitions are located within the AWS CDK.
Make sure to migrate any secrets stored in your .env file to AWS Systems Manager Parameter Store. This ensures a secure and centralized management of configuration data. This step is demonstrated in the example GitLab repository.
If you want to build the CI/CD pipeline for your Spring Boot app, check out our other article on the subject.

Step 5: Utilize produced data in Grafana
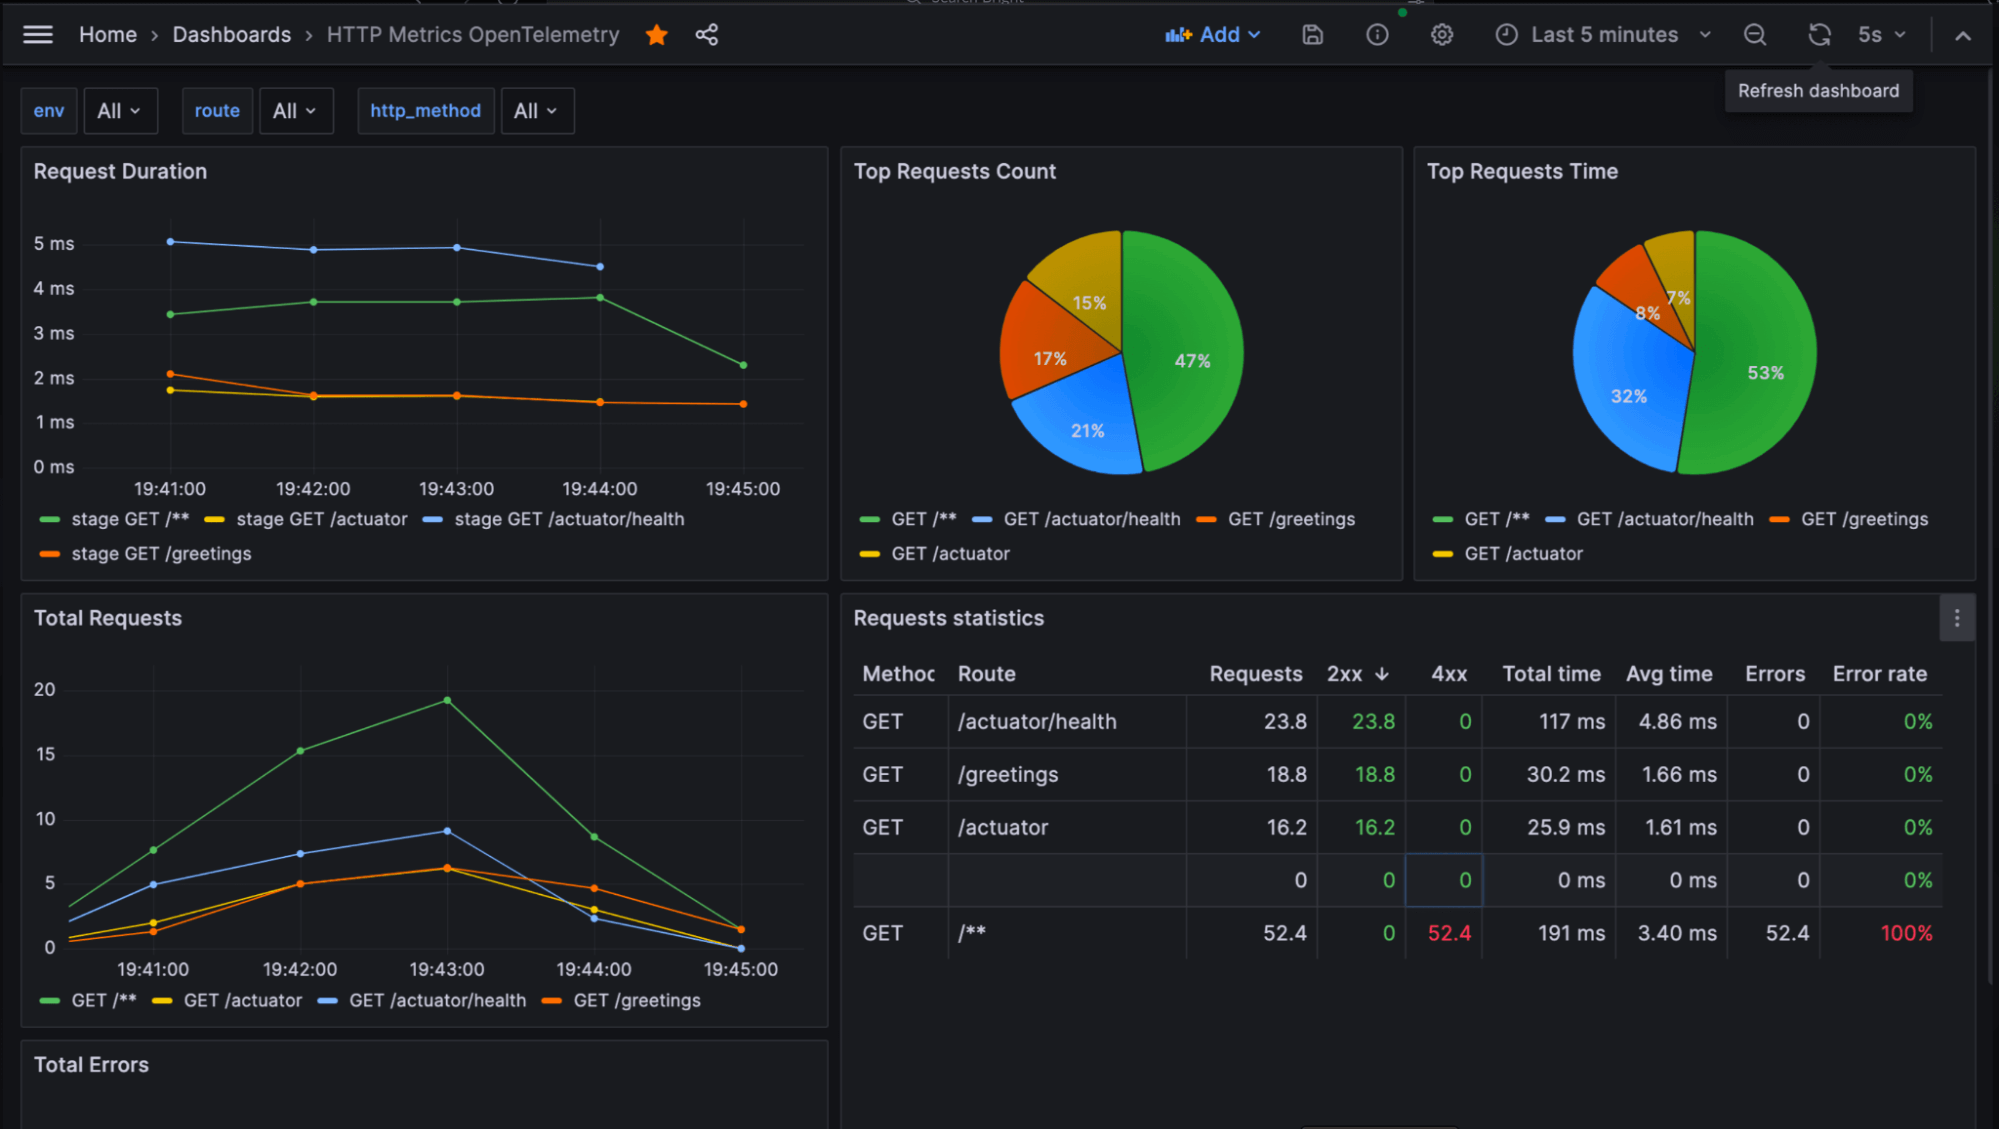
Now you can use data produced and provided to Tempo, Loki, and Prometheus to build your first dashboard or import existing dashboard.
We recommend using the dashboard prepared by us exclusively for this example.

And when it comes to reviewing tracing and logs, the Grafana Explore function seems really handy.
Ready to start optimizing?
These five steps will help you move your monitoring to the next level. You’ll be able to measure app performance and improve it when necessary. We hope you’ll find this tutorial helpful! If you have any questions, just contact us (you’ll find us on LinkedIn). Let us know if you want to read more tutorials like that!
Happy analyzing!
Want to share your Grafana story and dashboards with the community? Drop us a note at stories@grafana.com.


