The benefits of web performance testing with Grafana k6 browser and Grafana Faro
Performance tests created with the Grafana k6 browser module use lab data collected from pre-defined environments, devices, and network settings. Lab data allows you to repeatedly reproduce performance results, making it useful for detecting and fixing performance issues early.
Lab data, however, doesn’t account for one very important testing component: real user experience. Field data, collected from real users under various conditions, reflects how your application is used in the real world.
This is why, to achieve a holistic approach to web performance testing, it’s best to complement lab data with field data from real user monitoring (RUM) solutions. One way to do this is by using Grafana k6 browser alongside Grafana Faro.
In this blog post, we will:
- Differentiate lab and field data
- Explain when to use lab and field data
- Explore how combining Grafana Faro and the Grafana k6 browser module leads to more holistic web performance testing
The difference between lab data and field data
It’s important to know the difference between lab and field data to understand why both are essential for web performance testing. Let’s look at an analogy that can help illustrate the difference.
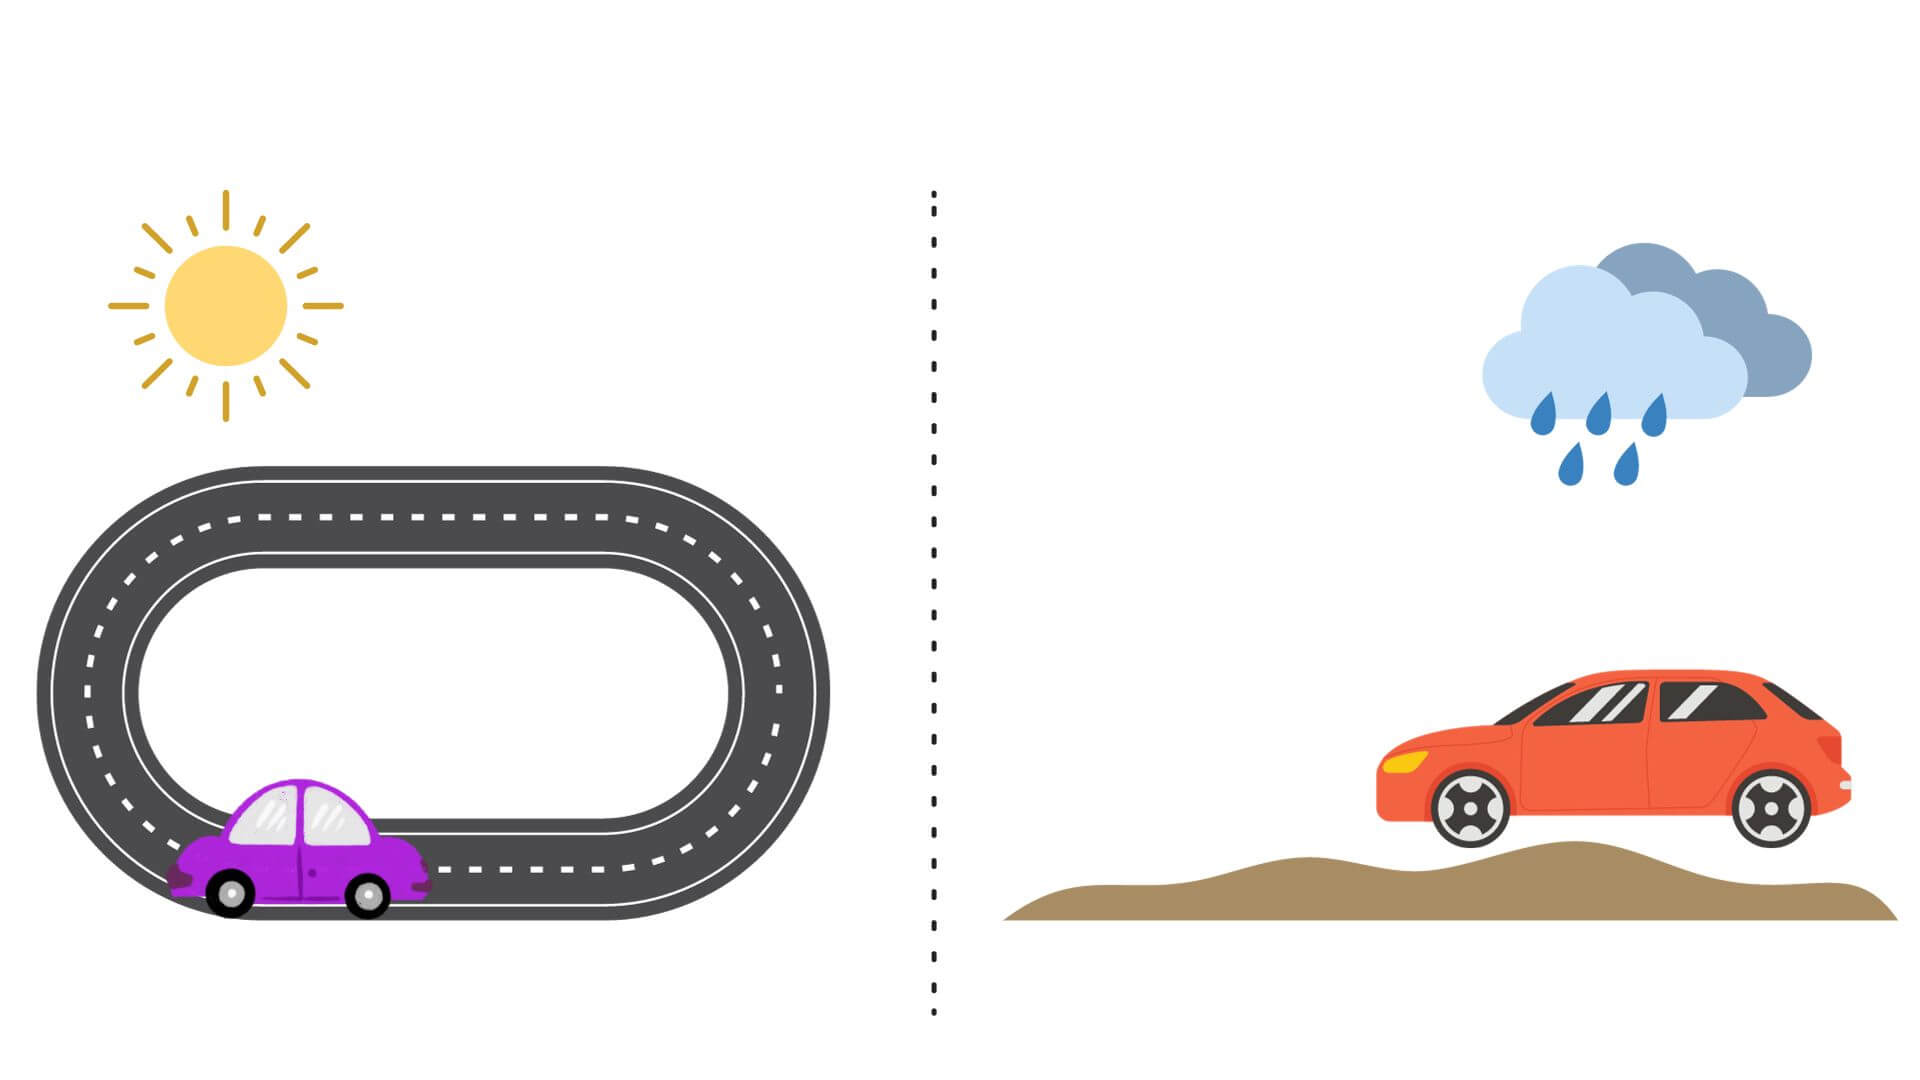
Imagine you’re testing the speed of a new car in a controlled environment. You have a stopwatch, and you measure how quickly the car accelerates, brakes, and takes turns. You record these measurements consistently with no traffic, perfect road conditions, and a skilled driver behind the wheel.
Performance testing with lab data, also called synthetic data, is similar. This data is collected in a controlled setting, often with specialized scripts or tools, such as the Grafana k6 browser, that simulate user interactions on a website. You measure web performance metrics like Largest Contentful Paint (LCP) or Cumulative Layout Shift (CLS) under idealized conditions.
Field data, associated with RUM, is collected from real users under various real-world conditions. To revisit our analogy, field data is like testing a car’s performance on real roads, like a busy city street or highway. The road conditions and traffic patterns will inevitably vary, and different drivers may handle the car differently.

Field data reflects how users access a site from different devices and locations, and under different network conditions. These users might have various browsers and connection speeds, just as real drivers on real roads have different skills and behaviors. Field data is collected by injecting a script or a library into your application. Grafana Faro is a Web SDK that you can configure to automatically collect all relevant logs, errors, and performance metrics for your application.
When you work with tools that use lab data, the web performance metrics could differ from those generated by tools that use field data or RUM. Your web performance score might be great with lab data but not with field data — and vice versa. This occurs because of the differences in testing environments and user behaviors, and because you aren’t accounting for real-world conditions if you rely exclusively on lab data.
For example, when you run a web performance test in a lab setting, you normally just include the base URL of the web application you are testing. However, different users will access a website with different query parameters or text fragments, which can impact the performance metrics.

Let’s take a closer look at the differences between lab data and field data in web performance testing.
User behavior
As mentioned earlier, real users interact with websites in diverse ways. They may visit different pages, use various features, and have unique navigation patterns. This variability in user behavior can impact a website’s performance, as certain actions or content may take longer to load or render.
In a lab setting, such as those with scripted or automated tests, a test follows predefined instructions to interact with the website.
For example, here is a code snippet used in Grafana k6 browser to automate a simple logging flow into an application:
export default async function () {
  const page = browser.newPage();

  try {
  /// 1. Go to the application
    await page.goto('https://test.k6.io/my_messages.php');

  /// 2. Type login credentials and click the submit button
    page.locator('input[name="login"]').type('admin');
    page.locator('input[name="password"]').type('123');

    const submitButton = page.locator('input[type="submit"]');

    await Promise.all([page.waitForNavigation(), submitButton.click()]);

  /// 3. Verify that the login was successful
    check(page, {
      'header': p => p.locator('h2').textContent() == 'Welcome, admin!',
    });
  } finally {
    page.close();
  }
}
While this is a valid scenario, users might follow a different flow in the real world, especially if they forget their password or have a session already saved. Real users may also load a website with cached and uncached resources. Cached resources can lead to faster load times for returning visitors. Field data would account for these differences, while lab data would default to uncached resources.
Network conditions and devices
In a lab setting, tests often run on standardized hardware configurations, which may not represent real users’ full spectrum of devices.
For example, we can extend the test script above to run it on a specific device, the iPhone X:
export default async function () {
 /// 1. Setup device capabilities
 const iPhoneX = devices['iPhone X'];
 const context = browser.newContext(iPhoneX);
 const page = context.newPage();

 ...
}
However, real users access websites using various devices, from desktop computers to smartphones. A website’s performance can vary depending on the device’s processing power, memory, and screen size.
In addition, network latency and bandwidth variations can also significantly influence web performance. Network conditions are usually optimized for consistency and speed in a lab setting.
When to use field data vs. lab data
Both types of data are valuable for different purposes. Lab data excels when used during the early development and testing stages. Because of the controlled environment, performance issues can be detected and fixed earlier. For example, suppose you want to understand your performance metrics in specific settings, such as a particular screen size. In that case, you’d be able to set this up in a controlled manner without worrying about external factors.
On the other hand, field data provides an overall picture of how a website performs in the wild. When your website is public, you need ongoing monitoring to detect performance issues in your live environment.
How Grafana Faro and k6 browser complement each other
k6 browser — and the Grafana k6 reliability testing tool, as a whole — supports proactive monitoring because it can prevent performance issues from slipping into production. This approach is also cost-effective, as a defect becomes exponentially more expensive to address when detected at a later stage.
Grafana Faro, meanwhile, completes this picture by collecting field data from users, including errors and performance metrics related to the frontend application. This provides a live health status of the user experience.

For these reasons, we see the pairing of Grafana Faro and k6 browser as a match made in heaven.
Let’s take an example using QuickPizza, a demo web application that generates new and exciting pizza combinations. Upon integrating Grafana Faro using the Web SDK, you notice that a JavaScript error is thrown when one of the inputs needed for pizza generation is incorrect, as seen in the image below. However, this error is not handled properly by the frontend application.

Since this error is happening in production, you need to be able to reproduce this error consistently in your pre-production environment to verify that the bug fix works and prevent the issue from happening again.
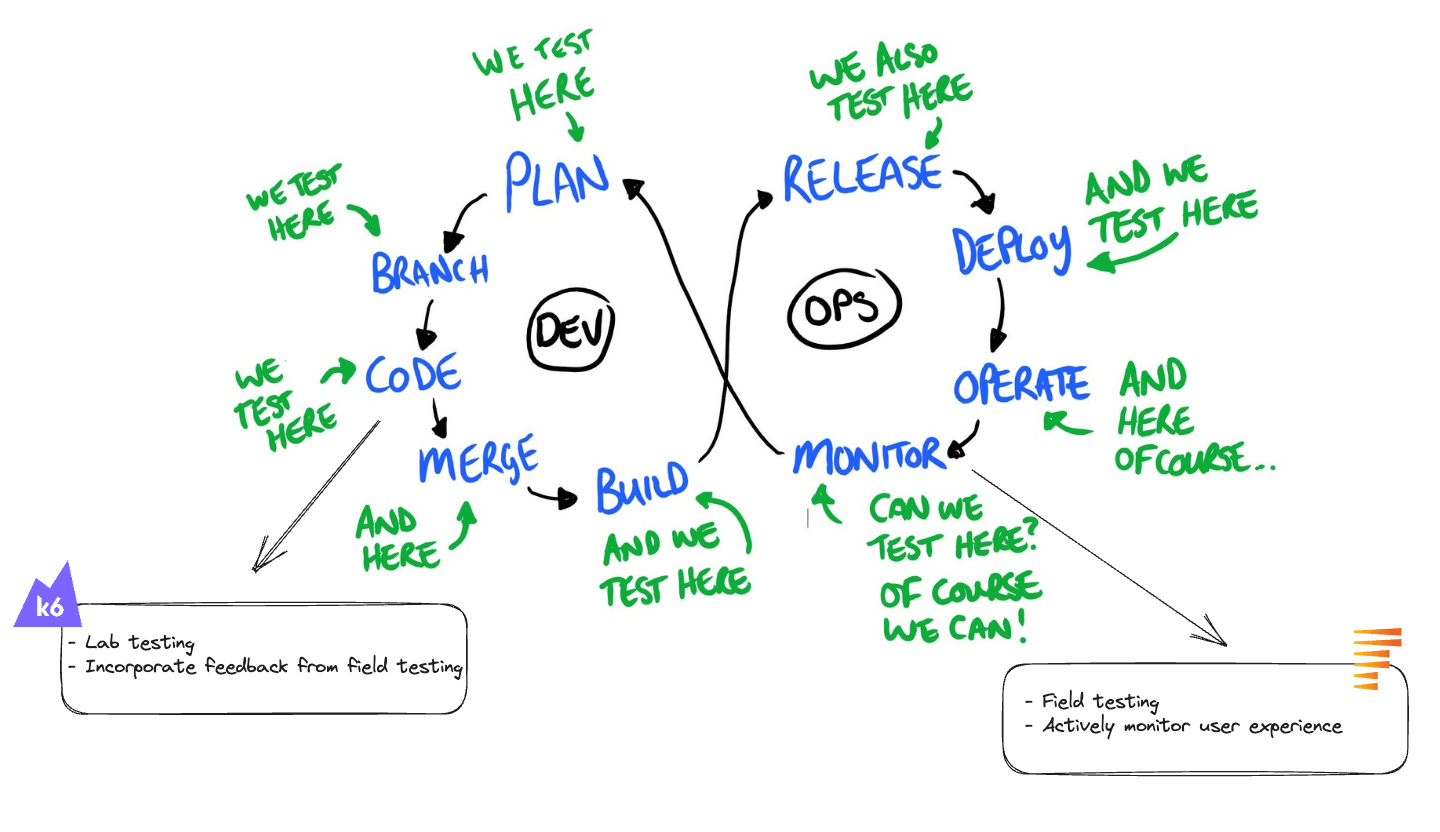
With a continuous performance testing approach, lab testing can improve continuously by incorporating feedback from field testing. (Note: the image below is based on the “continuous testing in DevOps” diagram created by software tester Dan Ashby).

Ideally, the frontend application must throw an error message to the user if any fields have incorrect inputs. Using k6 browser, you can simulate the browser actions for this scenario, provide an invalid input, and verify that the error message is visible on the page, with a sample code snippet:
const page = browser.newPage()
await page.goto('http://localhost:3333');

page.locator('.ml-3.text-xs').check() page.locator('(//*[@id="floating_filled"])[1]').type('-1234567890')

check(page, {
    "error element visible": page => page.isVisible('#errorBox') === true
})

page.close()
Once the bug fix works, you can continuously monitor your application to see if JavaScript errors have reduced when any of your users provide invalid inputs to the application.
Next steps
To learn more about how you can measure your application’s web performance using lab and field data, check out our Grafana k6 browser module documentation and Grafana Faro documentation. You can also watch k6 Office Hours #75 on YouTube for more information about using Faro alongside k6 browser.
The easiest way to get started with k6 is through Grafana Cloud k6. The free-forever tier includes 500 virtual user hours/month for k6 testing and more. You can also use our free tier to get started with Grafana Cloud Frontend Observability, our hosted service for real user monitoring that’s powered by Grafana Faro. Sign up for free now!


