An inside look at the Grafana open source community and what’s next
Open source communities are important to us here at Grafana Labs, and we want to better understand how they function in order to support them. We also value a culture of transparency, and strive to talk about open source communities publicly the same way we talk about them internally.
That’s why, in this post, I’d like to describe how Grafana Labs views and measures its own open source community, as well as provide a mini “state of the community” overview.
First, though, we have to state our opinion about how a community works to provide clarity on what, exactly, we’re trying to measure or improve. Community is, in part, a growing process of people working with software while “learning in public,” and contributing those learnings back to enable others to do the same. When you pair that dynamic with a particular set of technologies (such as Grafana, Prometheus, and Kubernetes), you get the kind of community we’re trying to understand and improve.
Building an OSS community: A series
This blog post is part of a series of posts we’ve written on OSS communities and what makes them thrive. Check out these other posts to learn more:
What makes a good open source community?
Why “good reply game” matters in open source communities
Learning in public: How to speed up your learning and benefit the OSS community, too
A model to capture our OSS community
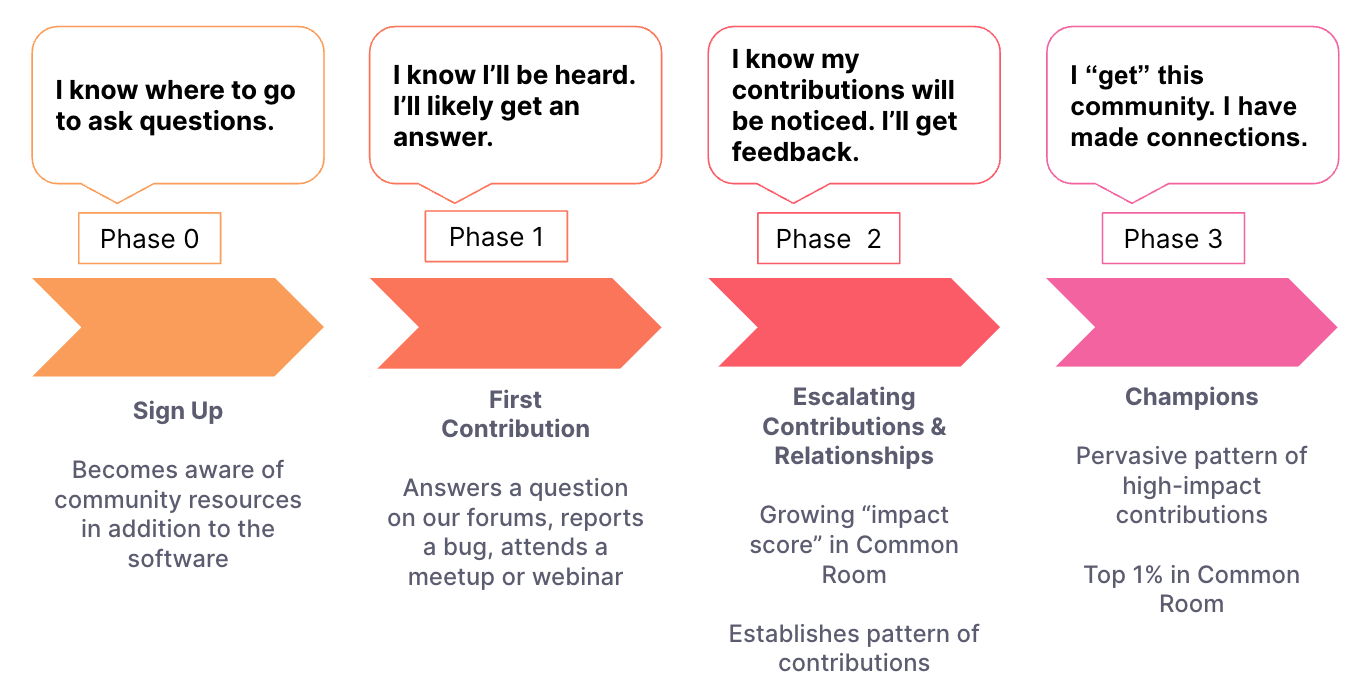
We built a model in an attempt to capture what a good community looks like from a member’s perspective, with a focus on the outcomes we want to see: productive collaboration.
This model, shown below, is divided into 4 phases that represent escalating participation levels within the community. We chose the 90/9/1 rule as a benchmark, of sorts, to let us know how we are doing. This rule states that there is participation inequality within most communities, with 90% of members being passive, 9% being intermittent contributors, and 1% being heavy contributors.
Because the model we built for our specific community has 4 stages, but the benchmark model only has 3, we lumped the middle 2 phases together; both phase 1 and phase 2, combined, are expected to be 9%.
Our developer advocacy team measures these numbers using a community intelligence tool called Common Room. The Grafana community gathers in a number of different locations — our Community site primarily, but also our Community Slack channel and many other places, such as Twitter, Reddit, and Stackoverflow. Common Room lets us keep track of what’s happening in all of these channels and get an overall sense of what the community is discussing. Every time someone makes a post or a reply, they get a certain number of impact points. We can then use these impact points to roughly measure how much each individual (including the developer advocacy team and all other Grafana Labs employees) contributes to the community. Impact points don’t really mean anything by themselves; since not all posts are created equal, they are just a general signal of overall activity.

This model reflects our opinion that most community members will start by asking questions and trying to get help, and only later (when they have built something that solves their need) become equipped to give back and be part of the solution to someone else’s technical challenge.
Measurement approach
We place individuals in one of the 4 phases above based on thresholds of impact points, with the higher levels requiring more activity. The thresholds are somewhat arbitrary, but we try to follow the “escalating involvement” model: if a member has contributed once, it’s uncertain whether they’ll post again, but if they’ve posted 30 times, it’s likely they’ll contribute a 31st time, because they’ve made a pattern of it.
We limit this to only people who have been active in the community in the past year; so, if you haven’t posted anything in a year, you are not included in these numbers. Also, these numbers do not include all Grafana users; they only include those who engage with the OSS community.
We realize our approach isn’t perfect: there are many wonderful forms of community engagement — like hosting a meetup, speaking at a conference, or attending in-person events — that this number does not fully capture. Directionally, however, we think this model shows the right scale of the community within a few percentage points of its true overall size, and gives us a decent signal on which way the community is going.
State of our community
With that, here’s what the Grafana community looks like as of October 1, 2023:

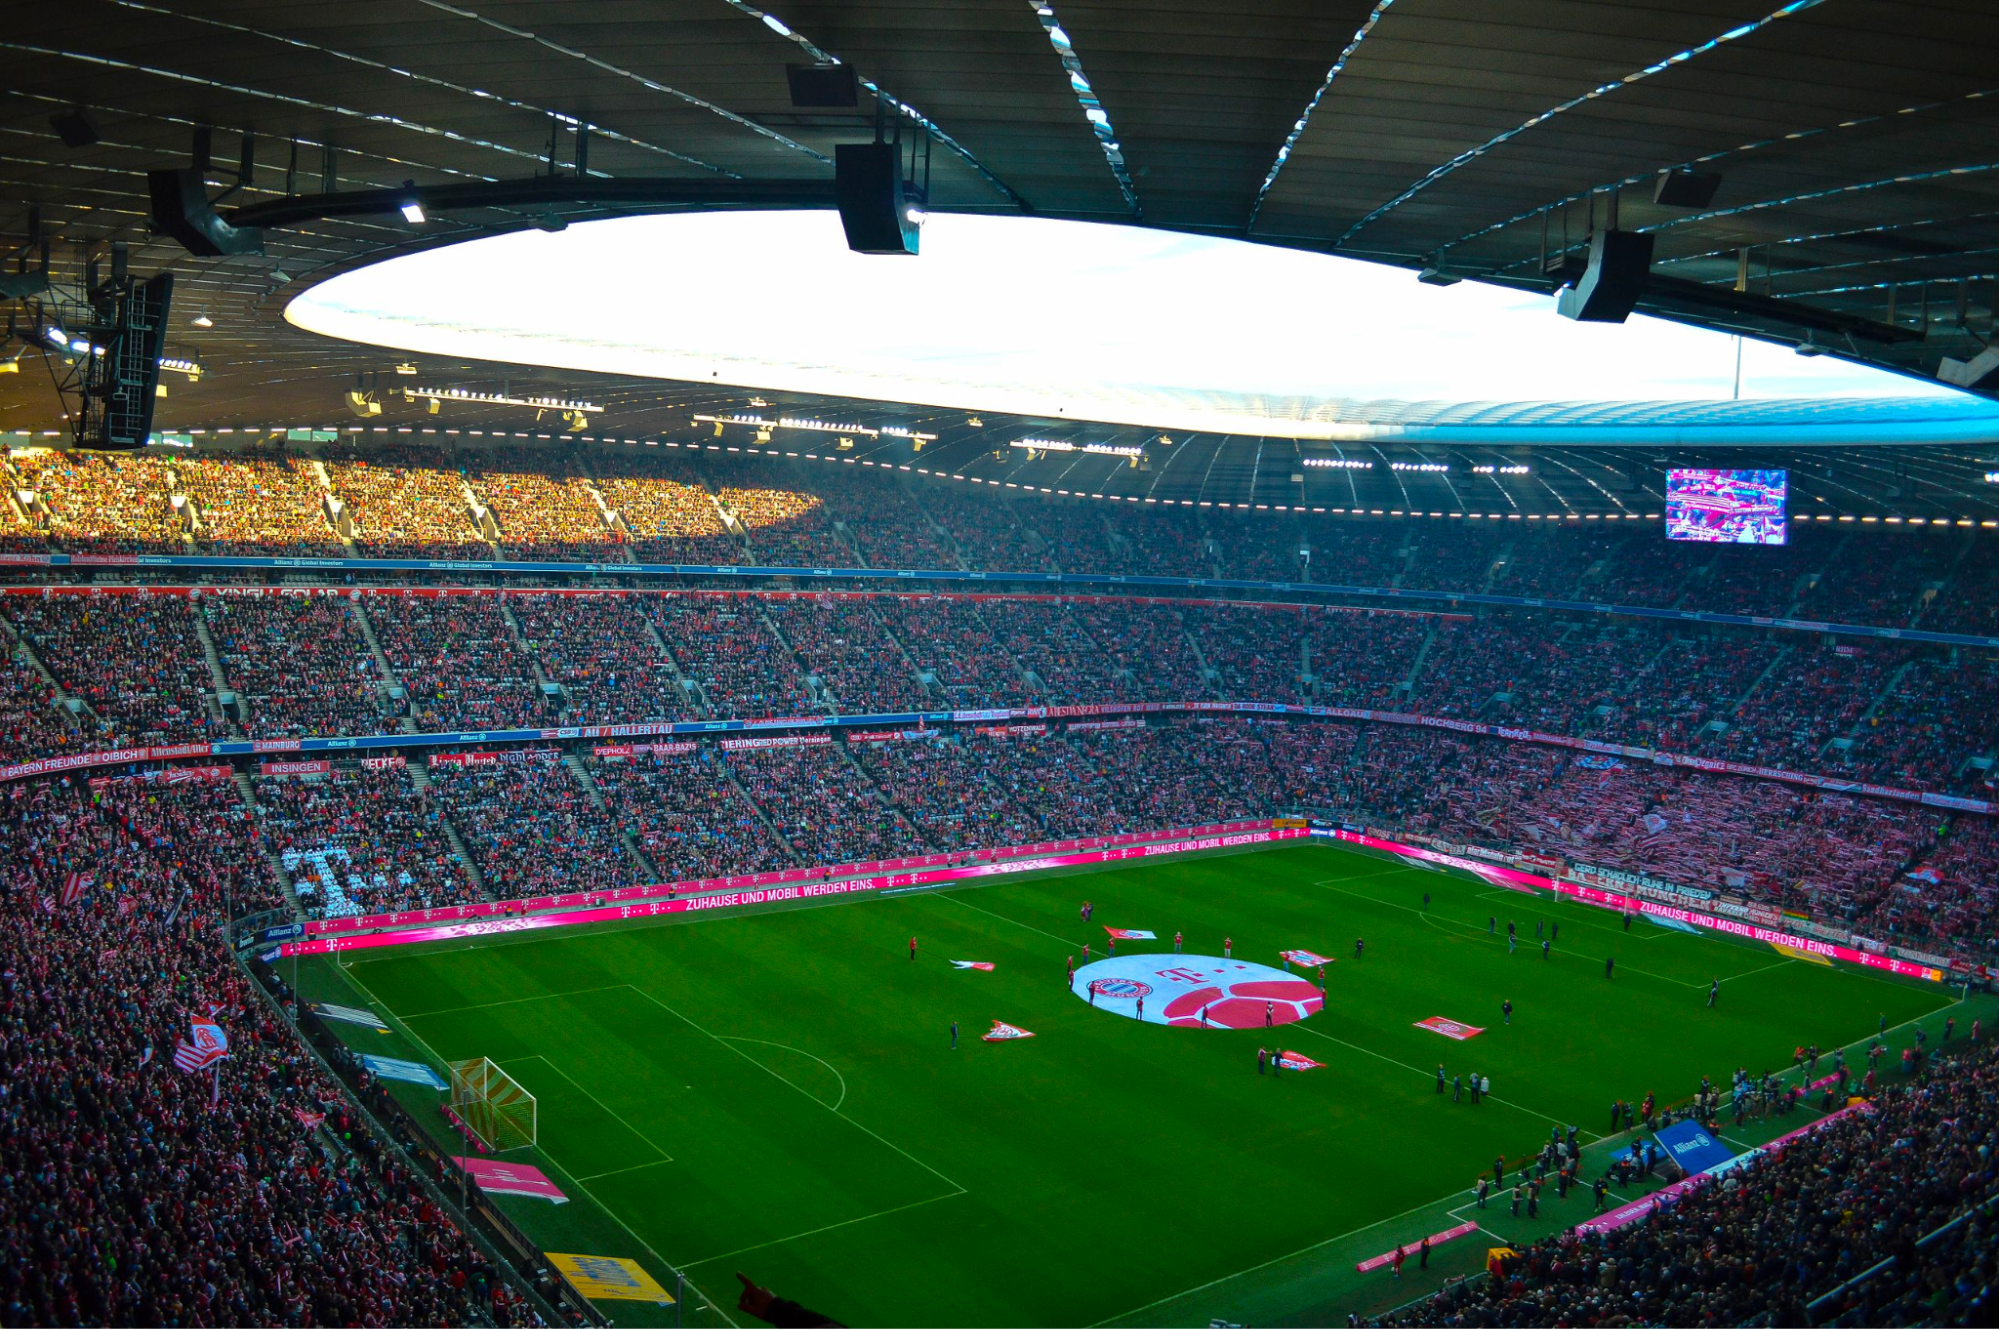
Our active community is 71,366 users who have engaged with some of Grafana’s OSS community forums and offerings. That’s the size of a respectable town, and enough people to fill the Allianz Arena football stadium in Munich. This is roughly what 70,000 people looks like:

It’s impressive and inspiring to see how many people are achieving great things within Grafana’s big tent, but we’re not done yet. You will notice that we aren’t hitting the 90/9/1 kind of ratio that we’re looking for. There are more beginners than we’d ideally like to see, and fewer people than we’d like are getting to Phase 3 and qualifying to apply as a Grafana Champion. We’ve got our work cut out for us.
So what are we going to do about it? Here are 3 steps that we’re taking right now:
- We think more people will succeed with better documentation, tutorials, and reference materials, so we are putting our backs into making those things easier. If a person who is new to the observability space gets frustrated or confused and doesn’t keep going, they’ll never become a great community member.
- We launched a Champions Program specifically to recognize and encourage some of the best contributors in our space. This program is populated with people you’ve probably already seen if you’ve spent any time in our community. They are a key part of what makes the whole thing tick. We plan to do more in terms of highlighting contributions.
- We will be changing some aspects of our web presence in the coming months. We want to provide a more focused set of options for where the community can gather and give/receive support. As it stands, the community is divided among many different channels, which spreads people out and increases the likelihood of you asking a question that nobody sees. We want to get people to the right place, which is to each other.
The principles behind these initiatives are simple: first, OSS communities are founded on the success people have when they use a technology to get stuff done, so community improvement starts with Grafana improvement. And second, recognition and egoboo is important. When people do awesome work, they deserve to hear about it. We believe it’s important to focus time and attention on the things that you want to see more of.
We want your feedback!
We want to make the Grafana community as good as it can be for everybody, regardless of background, ability, experience, or anything else. We care about this a lot because the largest part of Grafana’s success comes from the community, and we try to treat it well. We were born in the open source community and intend to stay there.
But, of course, we’re not perfect. If you have thoughts or comments about how the Grafana community runs or how we can make it better, we most definitely want to hear from you. Head over to our Grafana community forum to get started — and feel free to tag me, @davidallen5, to discuss any ideas you have about this post or OSS communities.
This post also reflects some of our core values here at Grafana Labs — namely, helping each other to thrive, sharing openly and transparently by default, and keeping OSS in our DNA.
If these values resonate with you, we’re hiring! Check out our careers page to learn more about working at Grafana Labs, including how we approach remote work and some of the perks of being a Grafanista. You can also peruse our open positions to see if there’s an opening for you.


