Troubleshoot failed performance tests faster with Distributed Tracing in Grafana Cloud k6
Performance testing plays a critical role in application reliability. It enables developers and engineering teams to catch issues before they reach production or impact the end-user experience.
Understanding performance test results and acting on them, however, has always been a challenge. This is due to the visibility gap between the black-box data from performance testing and the internal white-box data of the system being tested.
Today, we are excited to announce the general availability of Distributed Tracing in Grafana Cloud k6. This is a native integration of Grafana Cloud Traces (our highly scalable, hosted tracing backend powered by Grafana Tempo) with Grafana Cloud k6 (our fully managed performance testing platform powered by Grafana k6). With Distributed Tracing in Grafana Cloud k6, you can correlate performance test results with server-side tracing data to debug failed performance tests faster than ever — and, in turn, proactively improve application reliability.
There’s supposed to be a video here, but for some reason there isn’t. Either we entered the id wrong (oops!), or Vimeo is down. If it’s the latter, we’d expect they’ll be back up and running soon. In the meantime, check out our blog!
The challenge of debugging failed performance tests
Engineering teams often spend a lot of time trying to make sense of their performance test results and troubleshooting failed tests. This is often because they don’t have complete visibility into the systems being tested.
With traditional load testing solutions, teams conduct a type of black-box testing — meaning, they take some test cases as input and then output high-level performance metrics. These metrics may surface a performance issue, but engineers still need to look inside the application and infrastructure to find and resolve the root cause. This requires pivoting between multiple monitoring and testing tools to find the source of the problem, leading to a high MTTR.

Fill the visibility gap with Distributed Tracing in Grafana Cloud k6
This challenge is exactly why we built Distributed Tracing in Grafana Cloud k6. Now, engineering teams can bridge the gap between black-box and white-box data and minimize troubleshooting time for slow and failed performance tests.
Distributed Tracing in Grafana Cloud k6 works by having k6 automatically inject tracing metadata into the requests it sends to users’ backend services when they run a test. Currently, we support two major propagators: W3C (OpenTelemetry) and Jaeger. The tracing data is then correlated with k6 test run data (e.g., test ID, test scenario, test group, and http request), so users can understand how their services and operations behaved during the whole test run. The collected tracing data is aggregated to generate real-time metrics, such as frequency of calls, error rates, and percentile latencies, that help users narrow their search space and quickly spot anomalies.
Finally, users can jump from the metrics to a relevant trace using exemplars to perform a root cause analysis and quickly resolve issues.
How distributed tracing and performance testing work together in Grafana Cloud
Let’s imagine you have a taxi service application called Hot R.O.D. that lets users request cars to arrive at four different locations. To ensure a great customer experience, you run a k6 performance test against the application that mimics different types of loads and combines multiple requests and scenarios.

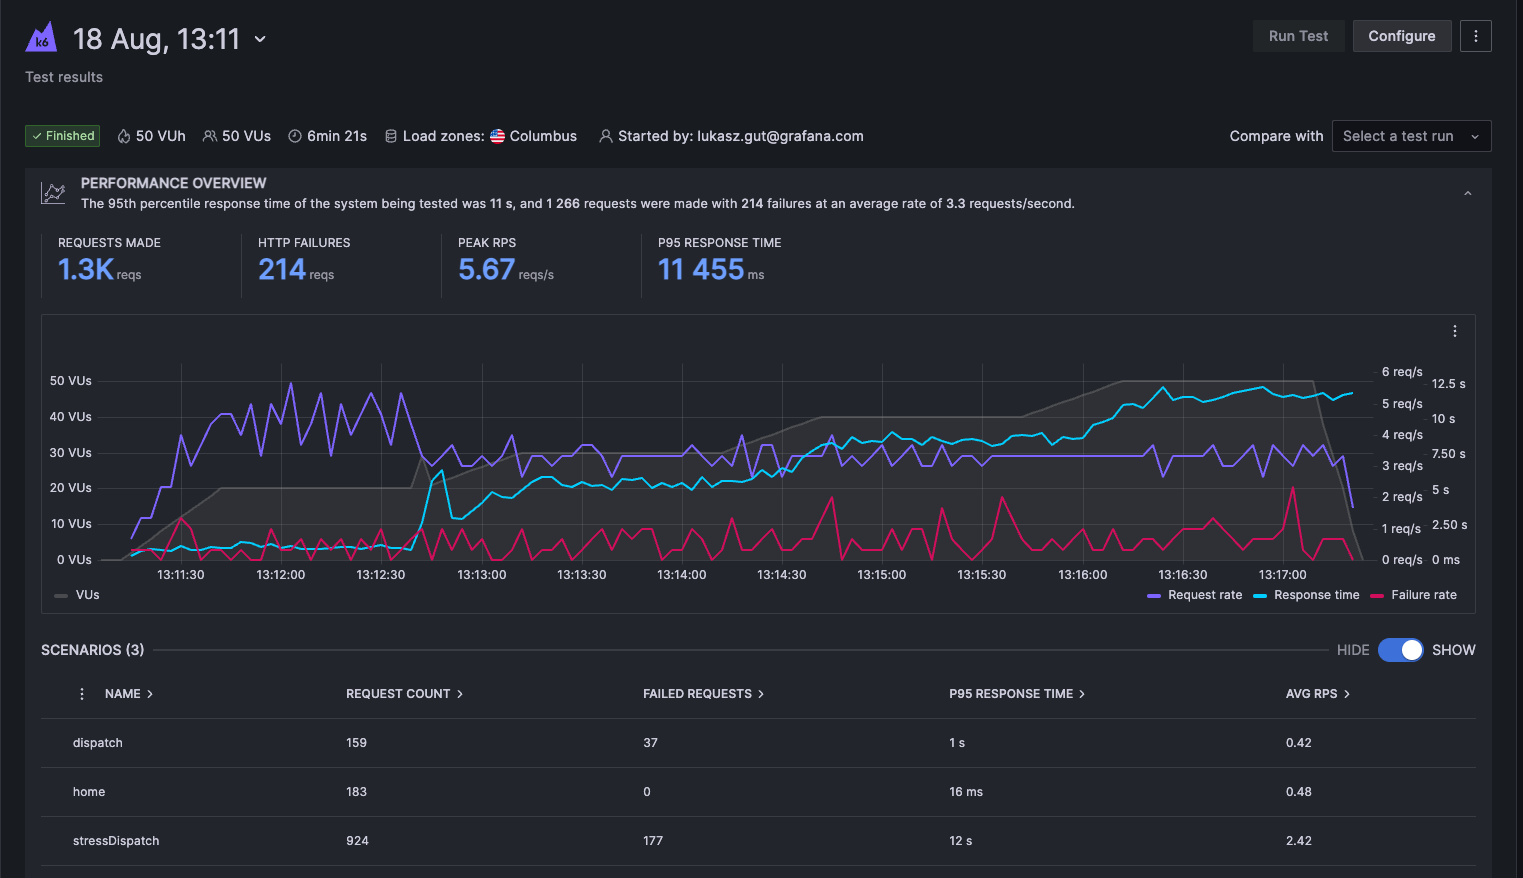
Your test includes a dispatch scenario where you have up to 10 virtual users request cars over 1.5 minutes, followed by a stressDispatch scenario where you have up to 50 virtual users make requests over 4.5 minutes.
Grafana Cloud k6 automatically displays high-level performance metrics for your test (e.g., P95 response time, request rate, and failure rate), as well as specific data sets for the HTTP requests made, organized into scenarios (e.g., status code, request count, and response time percentiles). This allows you to discover that the response time of the requests increases significantly in the stressDispatch scenario, when there is more load on the system, with a max response time of 12 seconds.
While the performance testing results indicate the application has a latency issue under load, you have no idea what actually caused the latency, as you don’t have visibility into the system being tested. This is where Distributed Tracing in Grafana Cloud k6 comes into play.

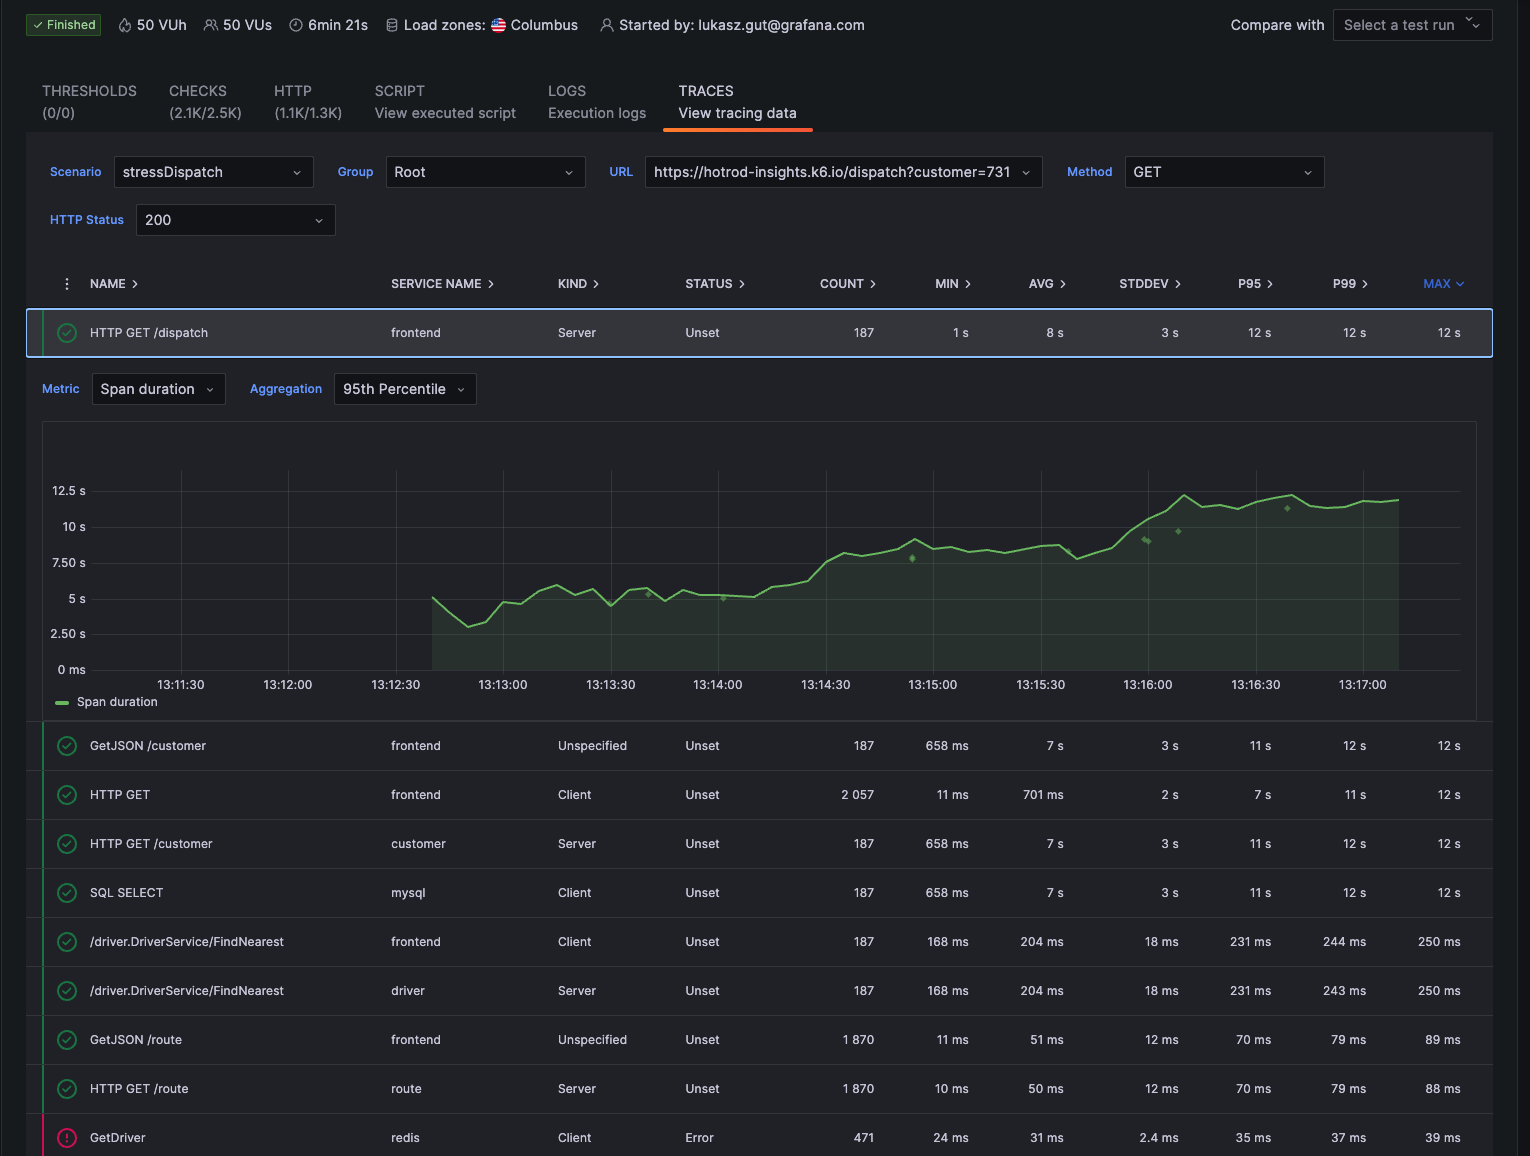
With Distributed Tracing in Grafana Cloud k6, you can now view and investigate the server-side traces generated by the k6 requests in the stressDispatch scenario to identify the root cause right in Grafana Cloud k6. This new integration with Grafana Cloud Traces brings a new Traces tab, providing a summary view of all the spans generated while the system was under test. This allows you to quickly identify the services that make up your distributed system and the operations these services performed. You can also track how each of the operations performed, in terms of count and duration, both in aggregate and over time. By sorting the operations by duration, you find that the HTTP GET /dispatch operation took the longest, therefore narrowing your search.

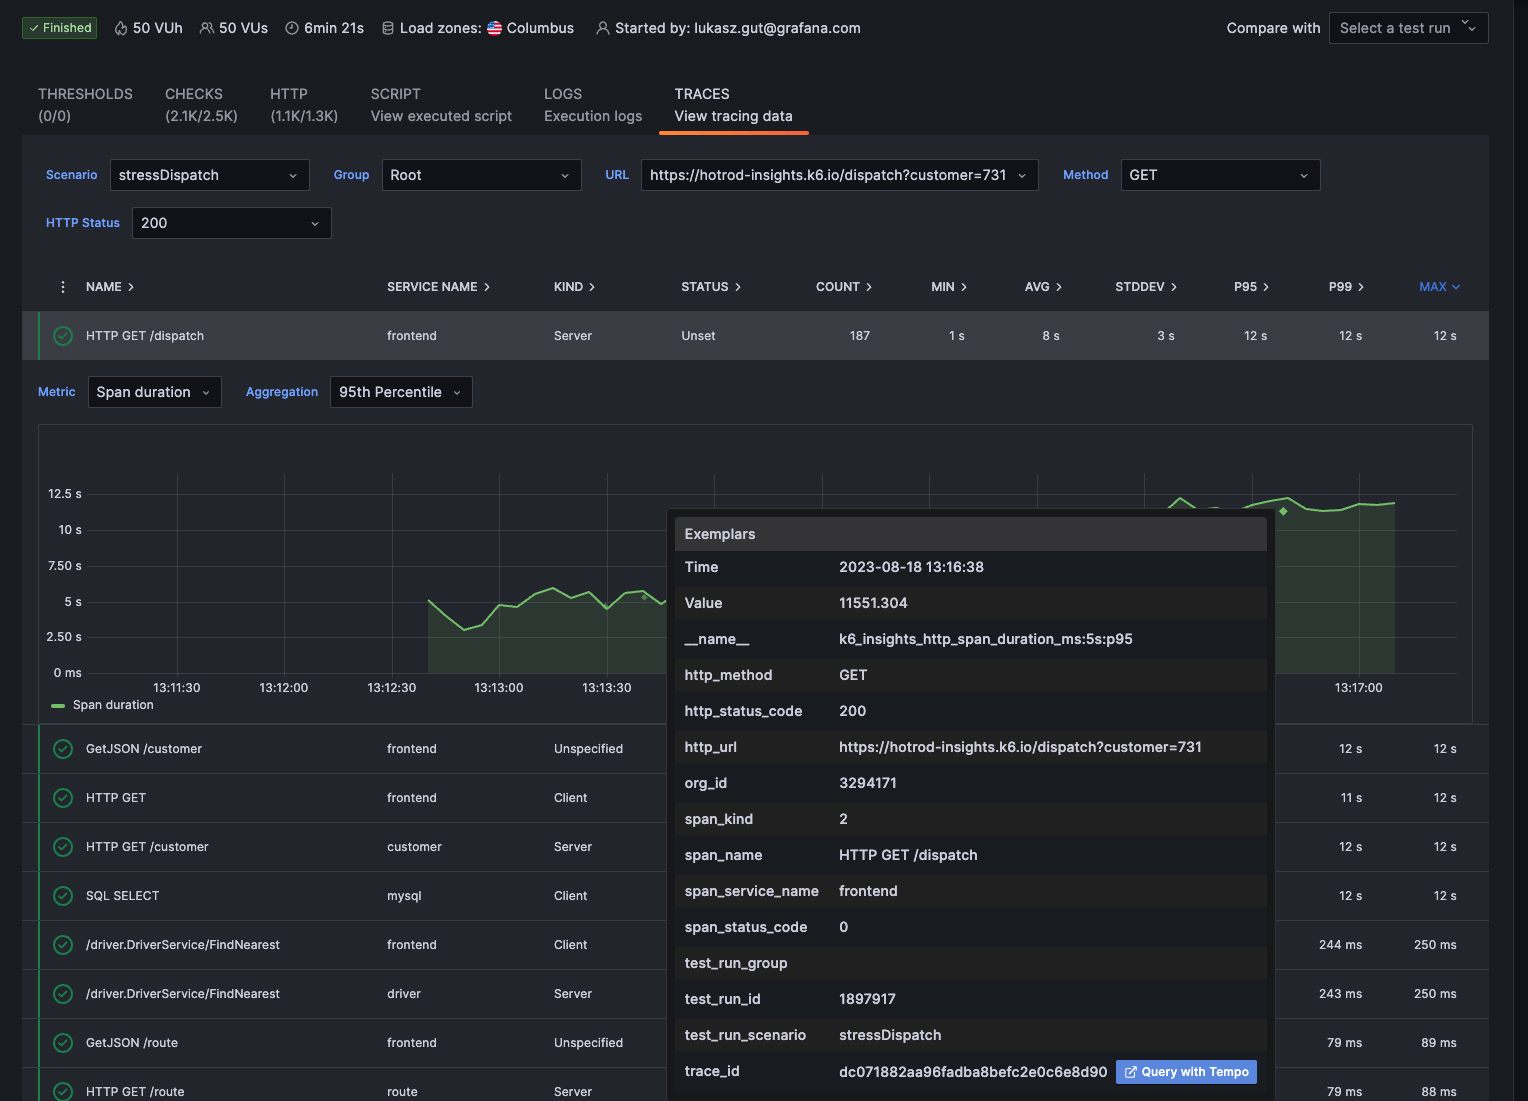
Further, as the metrics chart for the HTTP GET /dispatch operation has exemplars attached (i.e., small green dots that represent individual requests), you can simply click the Query with Tempo button and quickly jump from the aggregations to an individual trace in Explore to dig deeper.

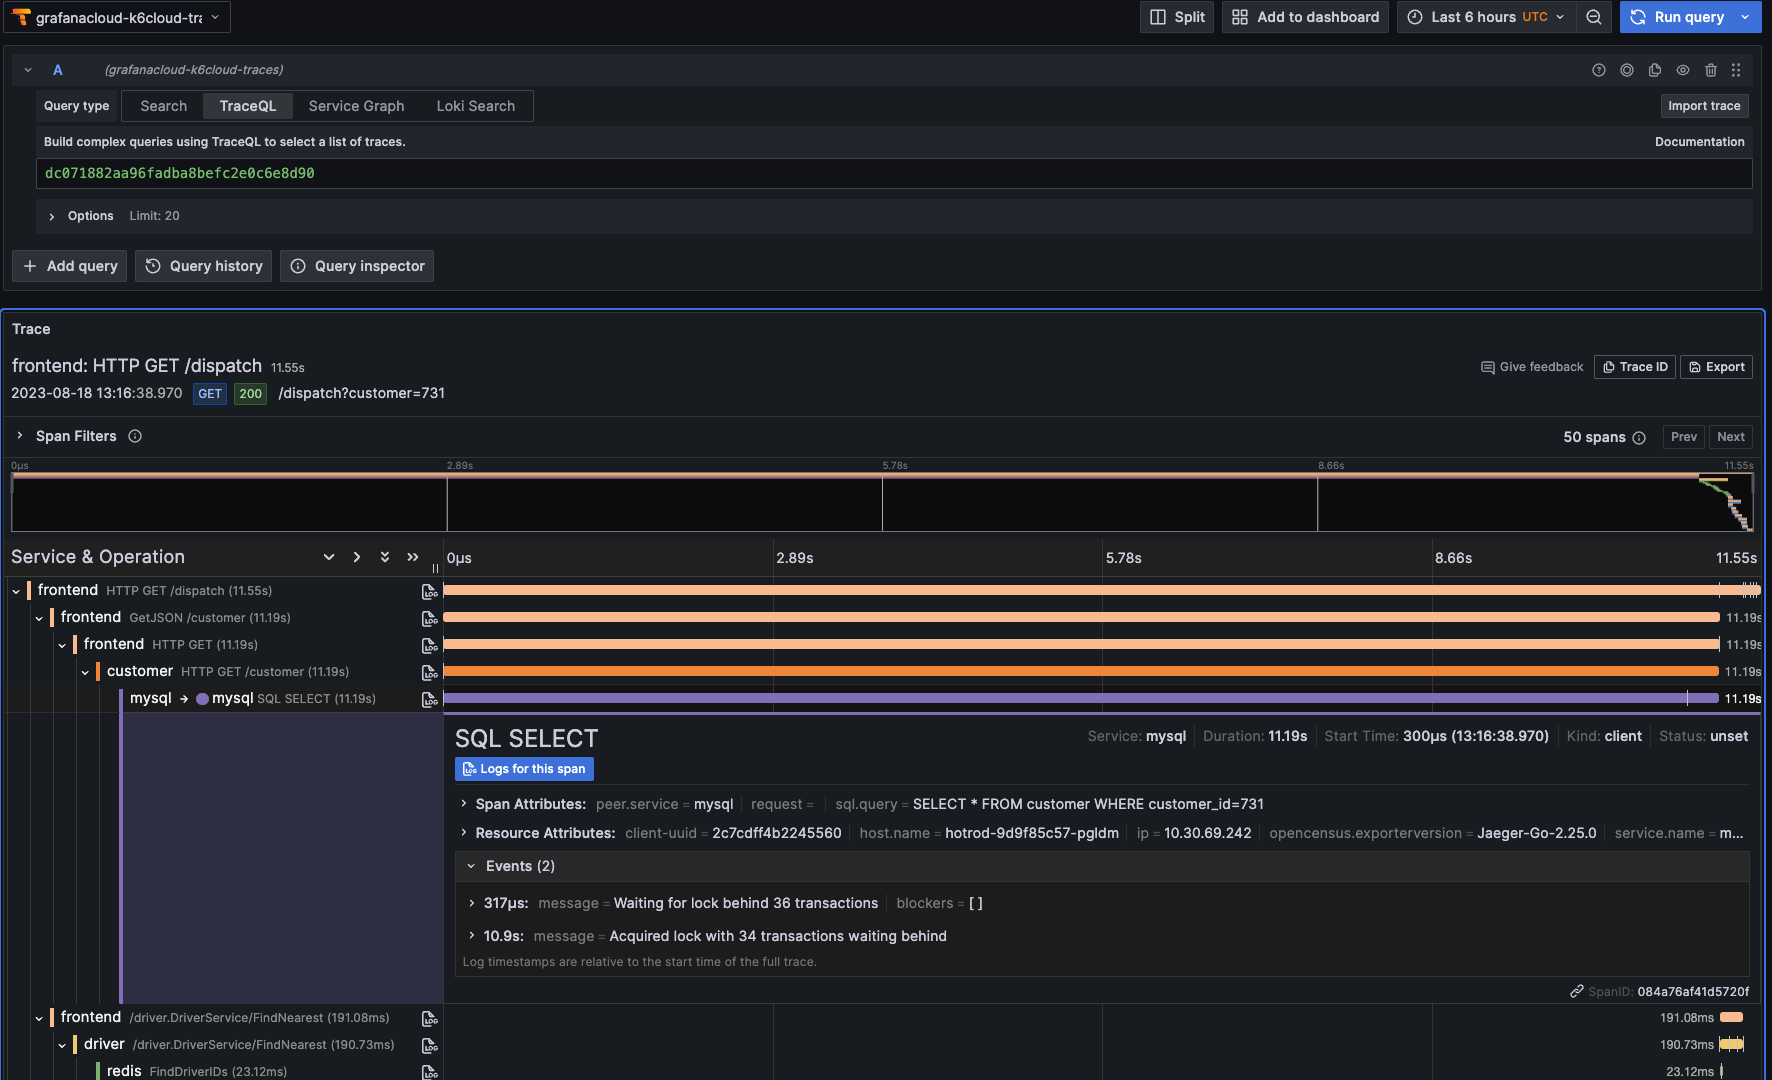
Finally, by examining the specific trace, you can find out why the HTTP GET /dispatch operation takes so long: the downstream mysql operation took 11 seconds to process. The events attached to the mysql span reveal more details, including these messages: “Waiting for lock behind 36 transactions” and “Acquired lock with 34 transactions waiting behind.”
All of these details point to the root cause of the application latency: There is a locking issue in MySQL that delayed all the upstream operations. With this insight, you can then work with your team to fix the problem quickly before it impacts your customers and revenue.

Get started with Distributed Tracing in Grafana Cloud k6
Distributed Tracing in Grafana Cloud k6 is now generally available for any Grafana Cloud user, including those in our generous free-forever tier.
To start using this integration, there are two steps you need to take:
- Send your services tracing data to Grafana Cloud Traces
- Enable the tracing feature in your Grafana Cloud k6 test
For full implementation details and best practices, see our Integration with Grafana Cloud Traces Documentation.
Not a Grafana Cloud user yet? Sign up for a free account that includes 500 k6 virtual user hours (VUh) per month and 50GB traces, or contact us here.


