A better Grafana OnCall: Delivering on features for users at scale
Enterprise IT is just a different animal. Whether it’s operating at scale, undertaking massive migrations, working across scores of teams, or addressing tight security requirements, engineers at these organizations can face different obstacles than their counterparts at smaller organizations and startups.
Enterprises need tools and features that cater to these different demands, and this is especially true in the realm of incident response management (IRM). Just think of the logistics of it all: You’re working on-call and you get an alert about an incident, but what team is it tied to? And who has permission to make changes in those systems? If you don’t have the right tooling and processes in place, this type of analysis can be a complete nightmare.
We’ve been working closely with our large customers to deliver a number of key features to enable them to adopt Grafana OnCall at scale. In this blog, which is a continuation of a series of posts on recent improvements, we’ll focus on what we’ve done to support users at scale with our on-call management tool.
RBAC
With role-based access control (RBAC) for Grafana OnCall, you can control access to things like who can edit a schedule, an integration, or escalation chain. This provides peace of mind that you can reduce the risk of misconfigurations but still let team members get their core tasks done through more granular access controls.

There’s supposed to be a video here, but for some reason there isn’t. Either we entered the id wrong (oops!), or Vimeo is down. If it’s the latter, we’d expect they’ll be back up and running soon. In the meantime, check out our blog!
Cross-team linking within Grafana OnCall
Grafana OnCall uses a “teams” concept as a key organizational unit. For example, configurations for alerts, integrations, and escalation chains are all scoped to a team. However, larger customers have been frustrated by this model because they couldn’t link between different teams’ schedules, escalation chains, and more.
So, we recently added the ability to easily link between different team objects throughout the UI. This is a much more flexible approach and addresses common use cases where you’d like to automate escalations to a different team than yours. For example, let’s say you’re on the App team and there’s an SRE team that manages the infrastructure your apps run on. In this scenario, you’d presumably like to include the SRE team in any alerts related to your Kubernetes cluster. Now, even if they have a separate schedule managed within their team view in Oncall, you can easily select it in your own escalation chains, easily setting up cross-team escalation chains.

PagerDuty migrator
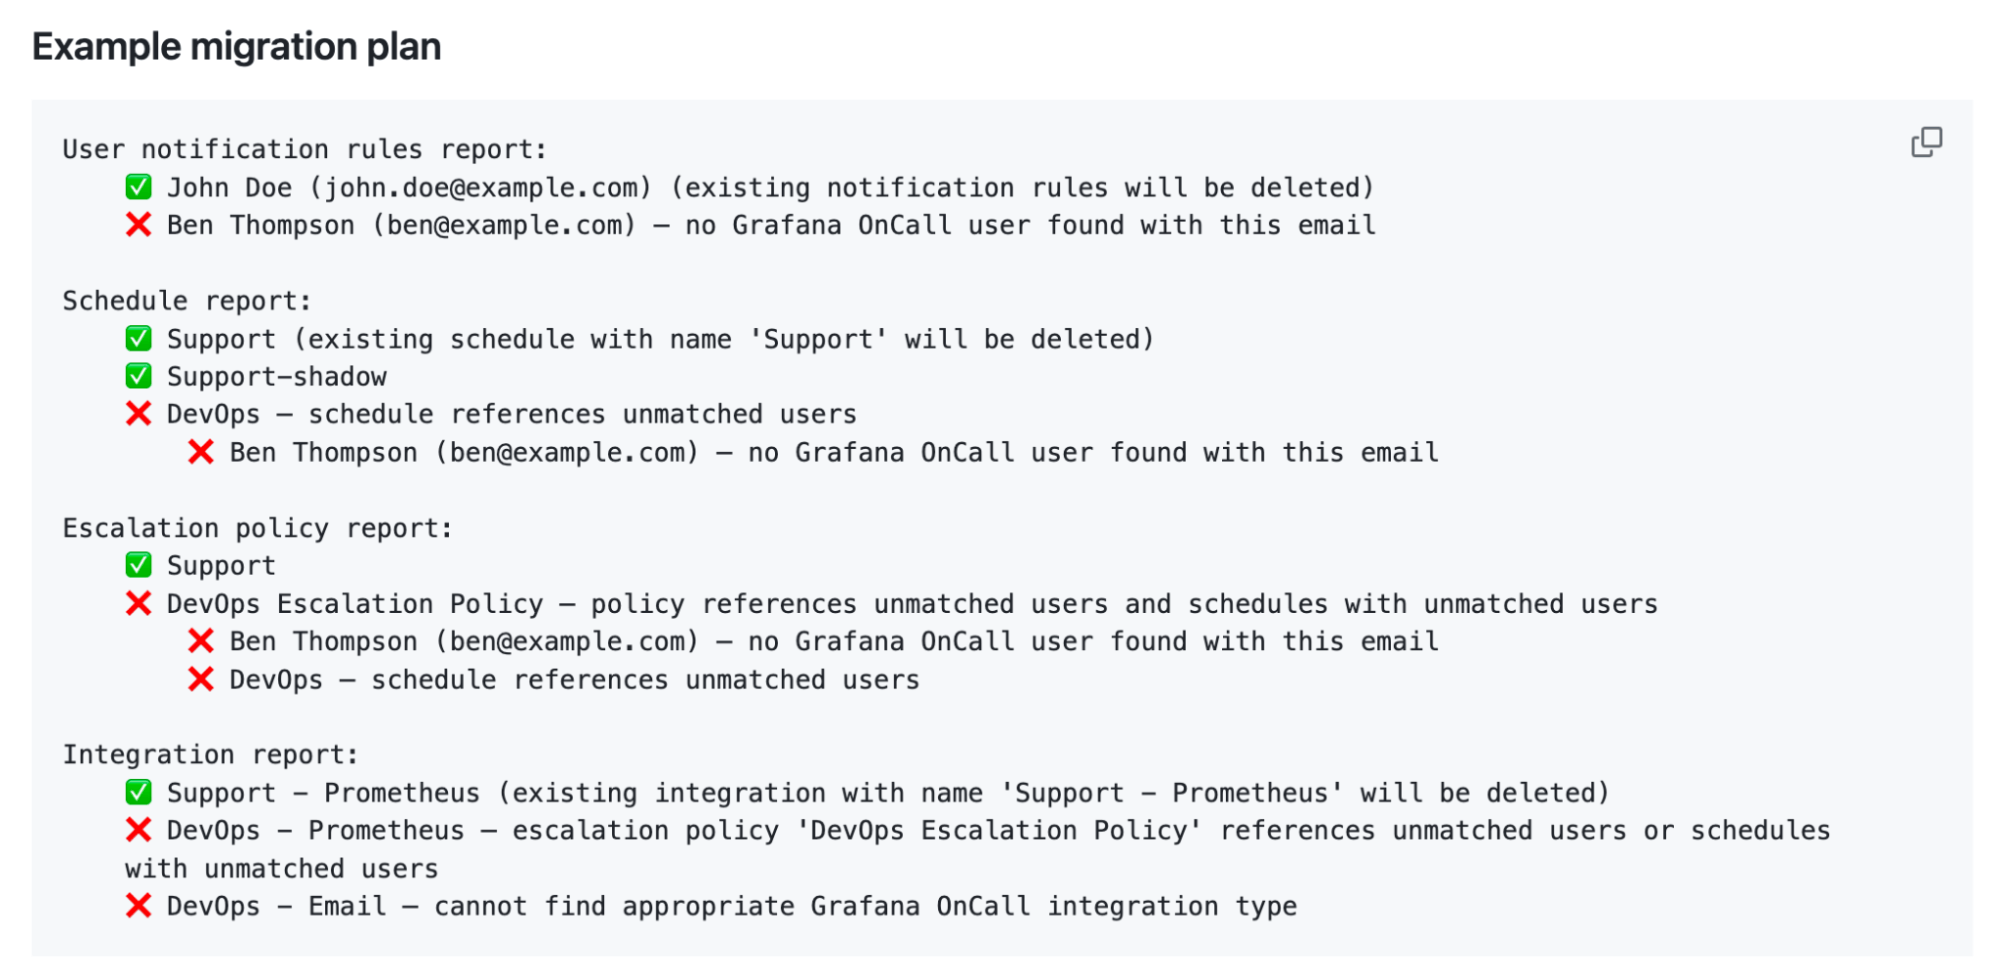
For customers that are switching to Grafana OnCall from PagerDuty, we’re making this switch as painless as possible. Our migration tool can automatically transfer user notification rules, on-call schedules, escalation policies, and services (integrations).
Before the actual move, the tool provides simple reports about the planned migration, thoughtfully explaining how and what will be migrated. Since we launched the tool earlier this year, we’ve successfully migrated multiple large-scale organizations, improving our tool with each migration.

Grafana OnCall Insights Logs and Metrics
Logs and metrics are integral to a solid observability strategy, and Grafana OnCall Insights Logs and Grafana OnCall Insights Logs provide you with predefined parameters for tracking telemetry data tailored for IRM.
Metrics
Grafana OnCall Insights Metrics help you understand what’s happening across your on-call and alerting setup, which is important for organizations as they manage on-call load and look to improve the health of their overall on-call culture.
It’s available to Grafana Cloud users automatically, without any setup. You can use the dashboard to answer questions like, “What is the recent alert volume within Grafana Oncall?” or, “What is the mean time to take action on an alert group?” You can also easily filter to a specific team or alerting integration.

Logs
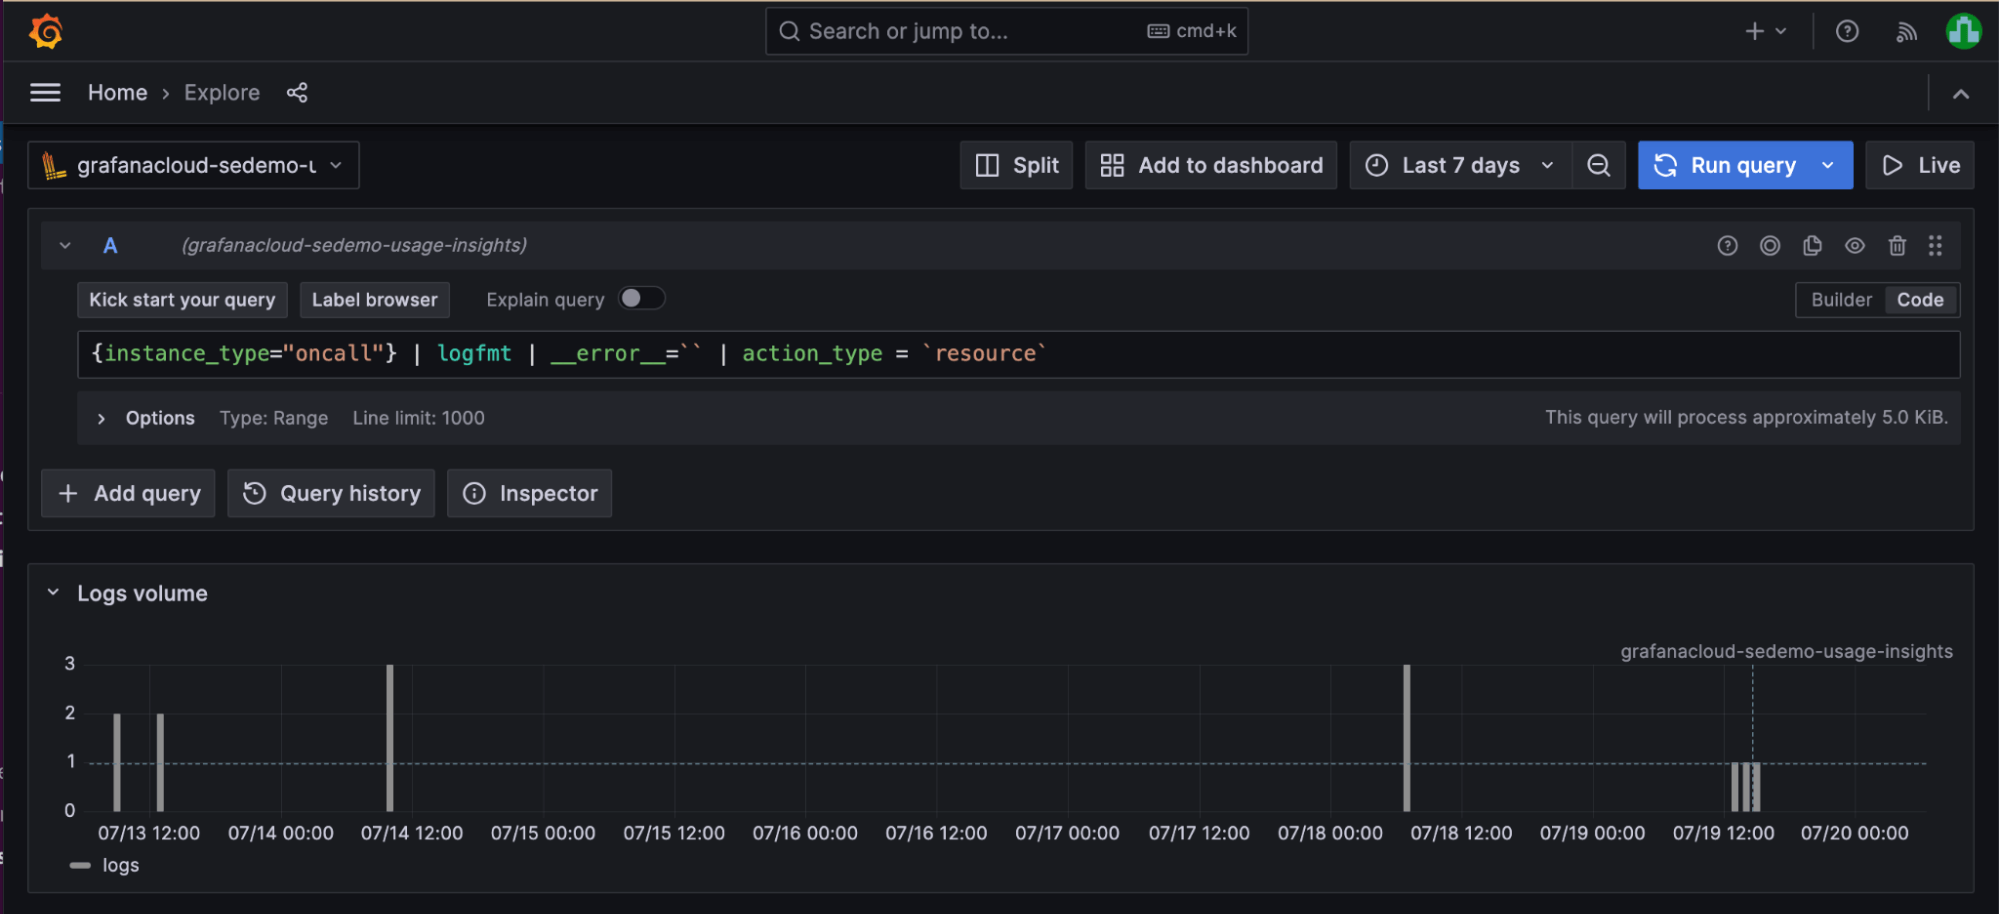
With Grafana OnCall Insights Logs, you can easily find logs for events associated with your users’ actions with Grafana OnCall, which can be really helpful for audit purposes, such as when you need to know if changes have been made to schedules. Logs that are automatically created include log events for when a user updates a resource, such as:
- Changes to a schedule within Grafana OnCall
- Maintenance mode start and end times for a specific OnCall integration
- Changes to a ChatOps integration.
Please note: This is currently only available in Grafana Cloud.

Advanced webhook functionality, including easy ServiceNow integration
We’ve improved the flexibility of our incoming and outgoing webhooks so enterprises can deeply integrate OnCall with their existing tool chain. This includes the addition of more discrete events that trigger a webhook, e.g., you can now trigger a webhook on an acknowledged, resolved, or silenced event on an alert group.
We’ve also added more fields and metadata that can be included in an outgoing webhook payload. This simplifies integrations with common ticketing and workflow platforms such as ServiceNow, which is a key piece of software for most enterprises.
So now, Grafana OnCall can automatically create, assign, and resolve incidents directly in ServiceNow via outgoing webhooks. Check out this guide for example webhook configurations for common use cases, as well as information on how to set up a user in ServiceNow to be used by Grafana OnCall.
Learn more about Grafana OnCall
These are just a few of the recent releases from Grafana OnCall. Check out our other recent post that talks about our addition of web-based scheduling, a mobile app, and email support.
Grafana OnCall is now part of our broader Grafana IRM offering, which includes Grafana Incident. Check out our docs for more info, and watch this webinar to learn more about OnCall and the broader Grafana IRM offering.
Grafana Cloud is the easiest way to get started with metrics, logs, traces, and dashboards. We recently added new features to our generous forever-free tier, including access to all Enterprise plugins for three users. Plus there are plans for every use case. Sign up for free now!


