New in Grafana 10: Better log context for better log analysis
It’s a common (and cumbersome) scenario: There’s an incident to troubleshoot or an issue with your application, and you find yourself manually sifting through your logs to track down the culprit, using grep -c commands for patterns that give counts without offering context or connections.
To cut down on manual log correlation, we’ve rolled out an upgrade to the log context feature in Grafana 10. Log context allows you to see additional lines of context around a log entry that matches your search query, so you have a more detailed view of what led to a specific log error and what ensued. (After all, what’s the saddest log line in the multiverse? A log line without context, or so says Grafana Labs software engineer and Grafana Loki Tech Lead Ed Welch on the Grafana Labs Big Tent podcast.)
There’s supposed to be a video here, but for some reason there isn’t. Either we entered the id wrong (oops!), or Vimeo is down. If it’s the latter, we’d expect they’ll be back up and running soon. In the meantime, check out our blog!
In this blog post, we’ll walk through the redesigned UI as well as a new tool for log querying. With the latest improvements to log context in Grafana, you’re no longer limited to viewing a traceID or headers associated with a single log line. Instead, you can identify patterns and correlations across multiple log lines surrounding the original log line in question — ultimately gaining a more holistic view of the situation.
New & improved log context experience in Grafana
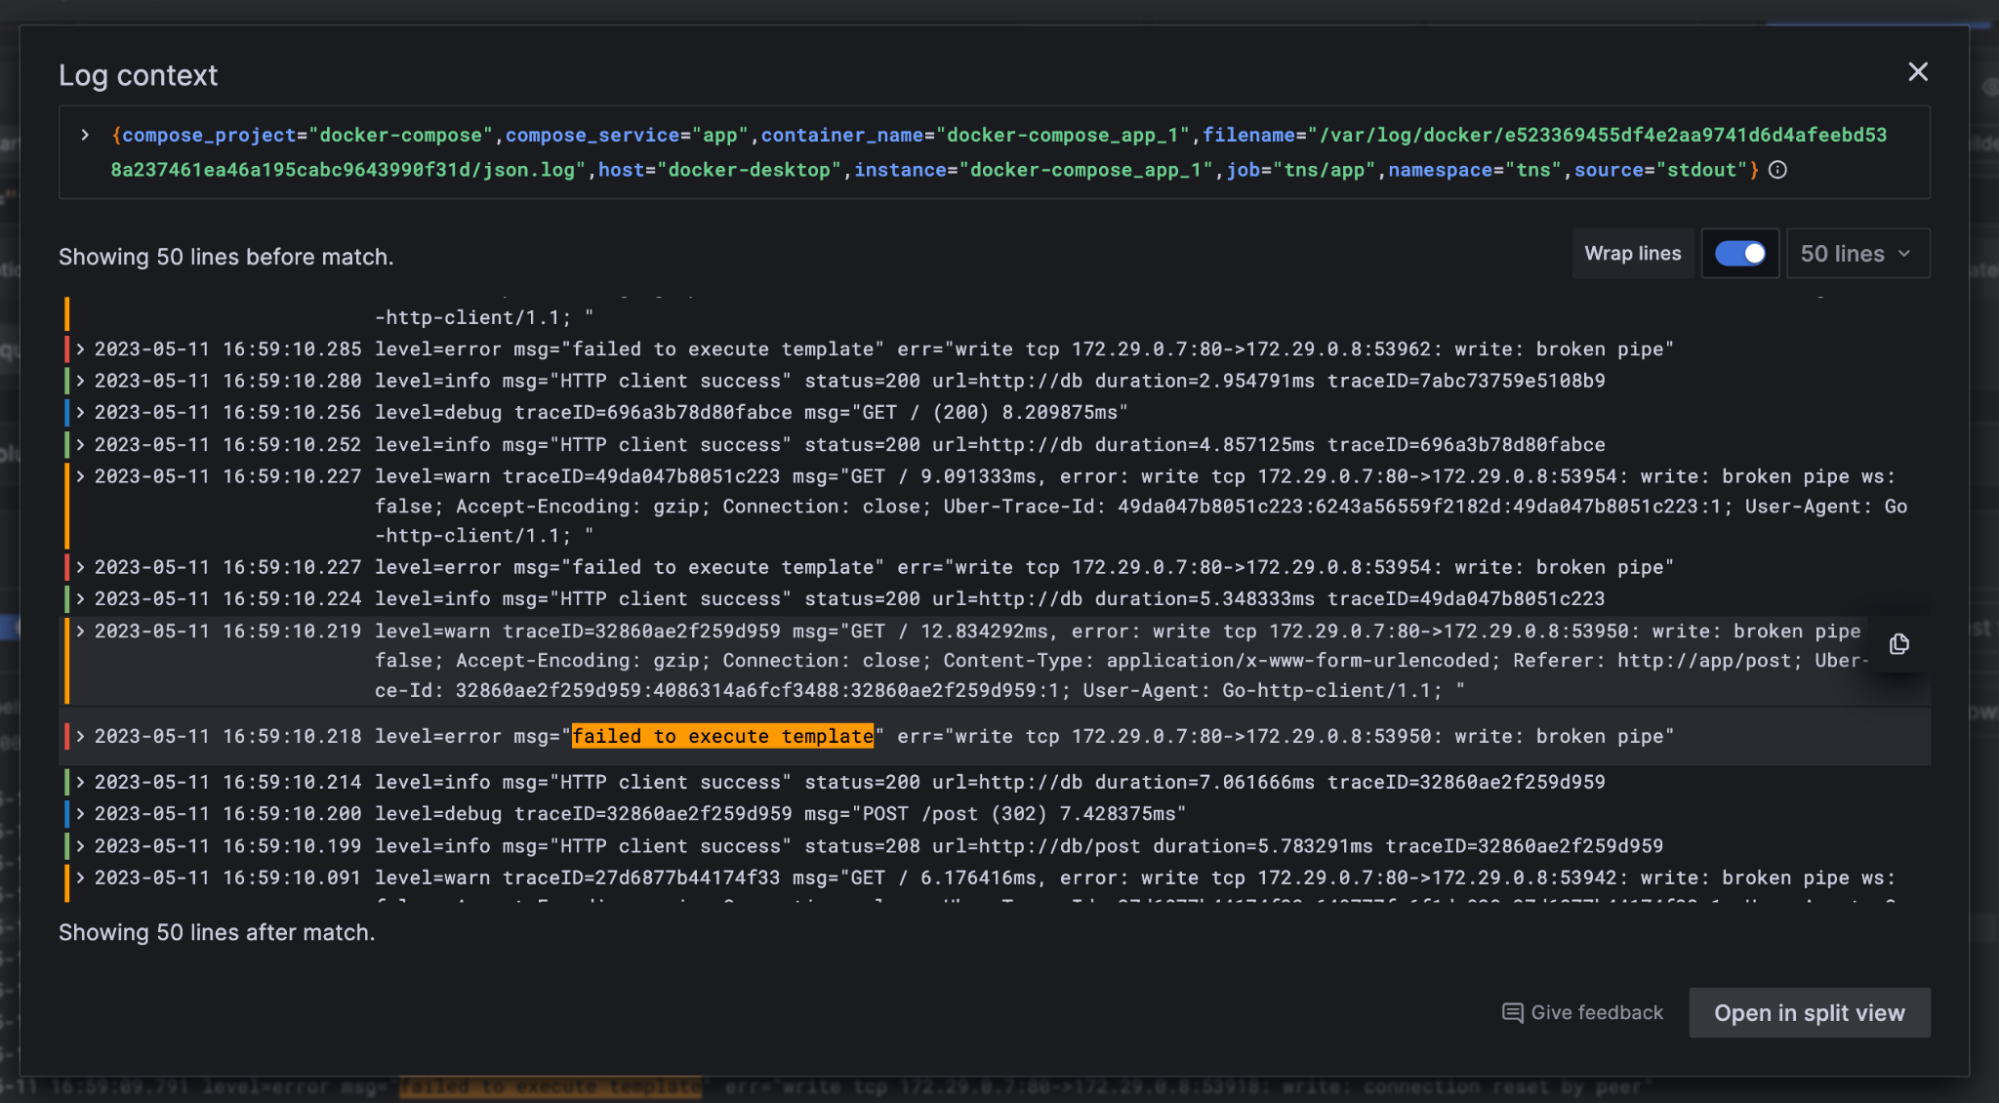
With the enhanced log context feature in Grafana 10, you’ll experience better navigation and a user interface that’s more consistent with logs visualization in Explore. We’ve color-coded log lines and integrated timestamps into each log entry, so you can click on individual log lines to access detailed information, and even selectively display certain labels to drill down on what truly matters.

Moreover, the transition to a modal view for log context offers a more focused environment for your log analysis. If you click on the Show context button that pops up as you hover on the right-hand side of each log line, you can place your log line in the center of the screen and display log entries that happened before and after that line, highlighting the actions that led to your specific log event.

The original log line stays sticky within the scrollable modal, ensuring you always have your reference point. And instead of displaying only 10 lines before and after the matched log entry, a dropdown menu now allows you to view up to 50 lines, offering a more expansive view of your log stream in the context of your query.
We’re also now displaying the executed context query right above your log lines, eliminating any potential confusion about the query being run. This ensures you’re always clear on the specific context in which you’re operating.
Introducing the Loki log context query editor
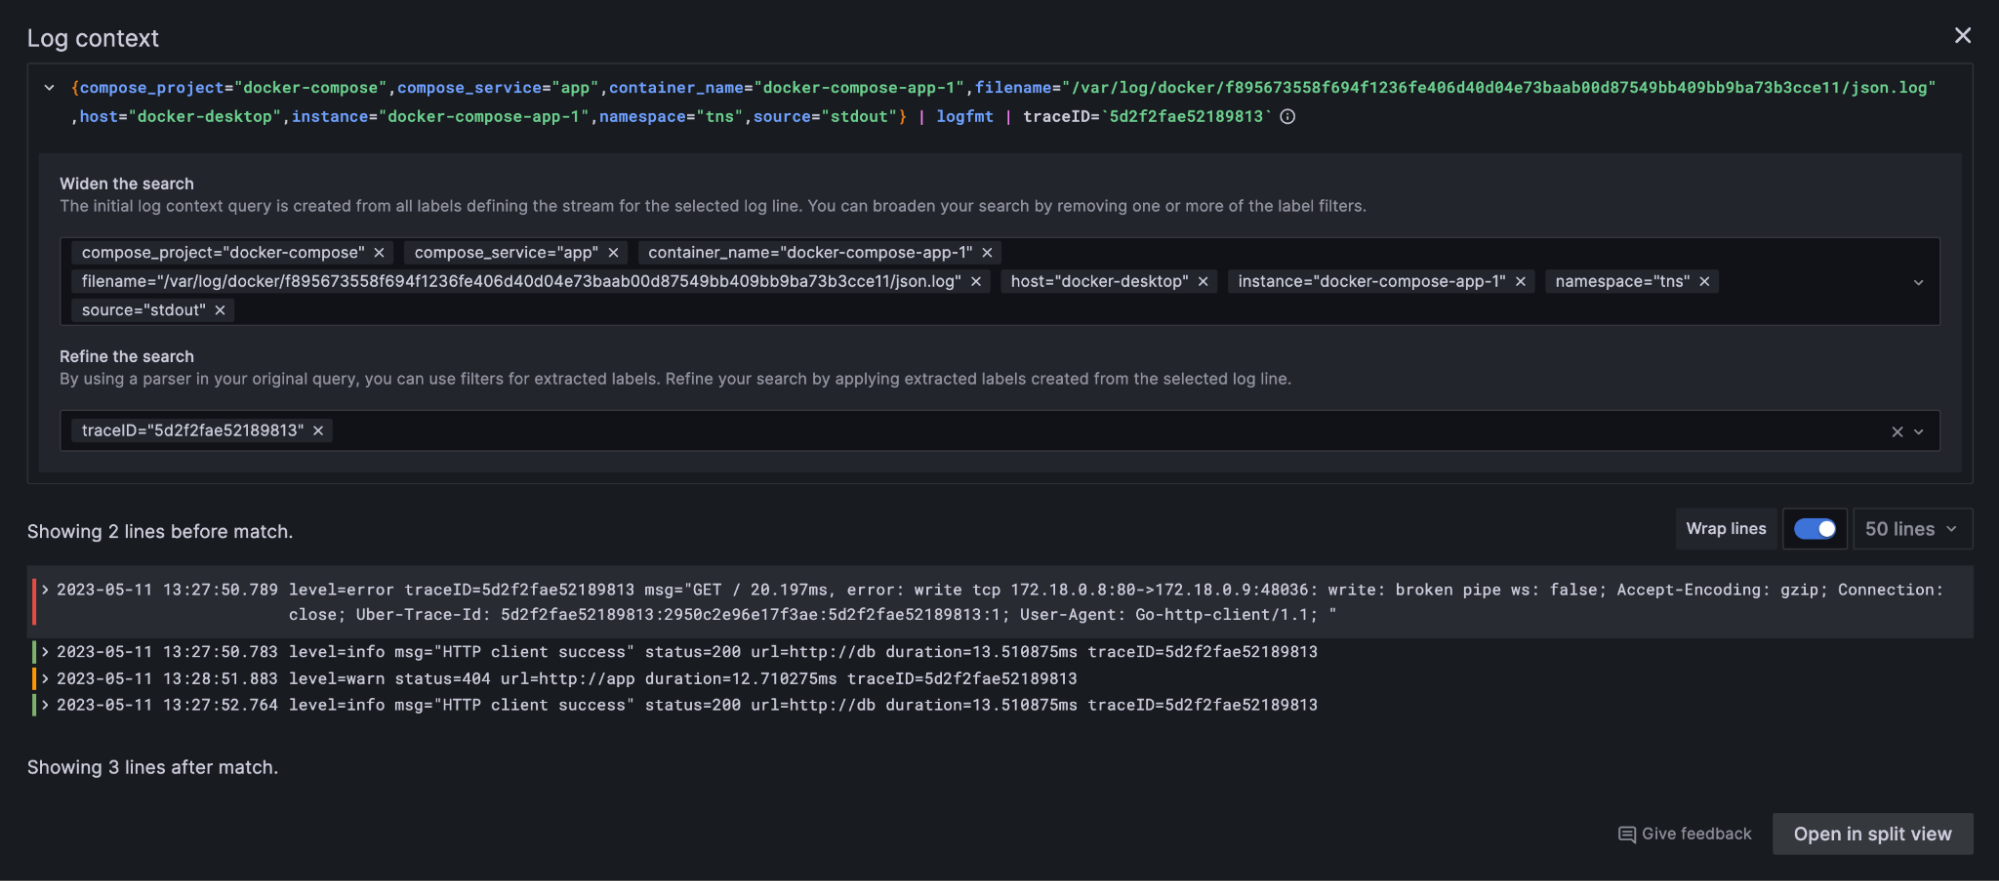
To modify your log context queries, we’ve introduced a powerful new tool — the Loki log context query editor. You can activate this editor by clicking on the log context query preview. Within it, you have the option to modify your search by removing one or more label filters from the log stream. If your original query used a parser, you can refine your search by leveraging extracted label filters.

Imagine you stumble upon an error log line containing a traceId and you want to view other log lines sharing the same traceId. This is where the log context query editor is helpful: For structured logs, if your original query used a parser, for example, {compose_project="docker-compose"} | logfmt, you can refine your search by selecting the traceID to view logs lines sharing that traceID.
Additionally, the Widen the search option enables you to remove label filters such as job or host. This allows you to look for logs with the specified traceID across all jobs and all hosts, granting you the control and flexibility to tailor your log analysis to your unique needs.
What’s next for log context in Grafana
Though we’re thrilled with the improvements we’ve brought to log context in Grafana 10, we’re not stopping here. We’re already looking ahead at how we can make your log analysis process even more efficient and intuitive.
In our pipeline, we’re exploring the idea of enabling log context to remember selected and removed labels in context view. This way, you won’t need to repeat the same selections each time you launch a new query.
Also, we’re looking at introducing an infinite scroll feature, which would make browsing through log lines more seamless.
Finally, we’re considering integrating log context into Grafana dashboards to provide you with a comprehensive view of your logs in one place.
We’d love to hear what you think of the log context improvements and what you would like to see next in Grafana. Please check out Grafana on GitHub or you can reach out to the team in the #grafana channel in the Grafana Labs Community Slack.
The easiest way to get started with Grafana is with Grafana Cloud. We have a generous forever-free tier plus plans for every use case. Sign up for free now!


