Monitoring machine learning models in production with Grafana and ClearML
Victor Sonck is a Developer Advocate for ClearML, an open source platform for Machine Learning Operations (MLOps). MLOps platforms facilitate the deployment and management of machine learning models in production.
As most machine learning engineers can attest, ML model serving in production is hard. But one way to make it easier is to connect your model serving engine with the rest of your MLOps stack, and then use Grafana to monitor model predictions and speed.
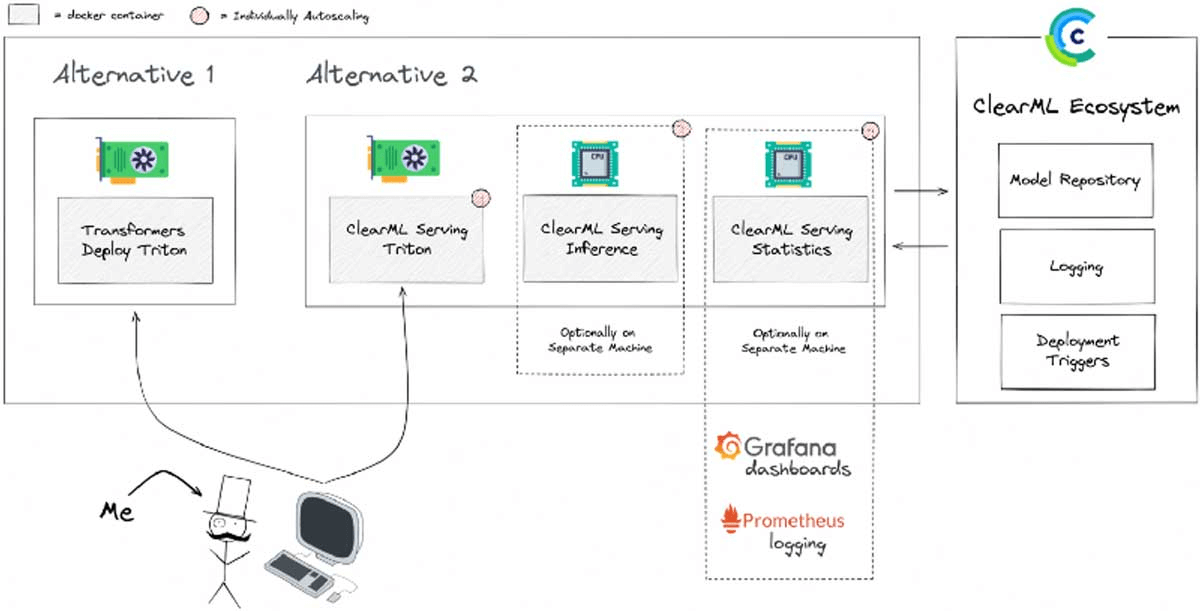
ClearML is essentially a toolbox of modules that help data scientists move machine learning models into production more quickly. One of the tools in that toolbox is called ClearML Serving. Also open source, it’s a ClearML module built on top of the popular NVIDIA Triton Inference Server and, crucially, adds several features to make it a more integrated part of your MLOps stack.
Grafana, together with its best buddy Prometheus, is used as part of ClearML Serving to provide the all-important monitoring component in model serving. ClearML supports both Grafana OSS and Grafana Enterprise.
In this blog post, you’ll learn how Grafana is used inside ClearML Serving to provide users with insights into their running models, alert them when those models misbehave, and allow them to analyze abnormal model output (also called model drift).
Production environment demands for MLOps
Deploying models to a production environment entails more than a simple launch — and subsequent maintenance — of an inference engine instance. Additional services are crucial to log and monitor service behavior, both in real time and for historic analysis, as well as to automate the release and deployment pipeline.
Providing any production service must include measures for scalability, with each stack component having distinct scaling considerations and requirements.

Key features of ClearML Serving
With ClearML Serving, an inference server is connected to a model repository, so you can easily deploy new versions of models and automate the process, if required. It also supports canary deployments, so you can split traffic gradually from an old model to a new model.
Logging is also a big part of serving, well, anything in production. ClearML Serving gathers all logs while serving a model and sends them to a central server where they can be viewed and easily searched. All of the original model-training logs and deployment-procedure logs are in the same place, so it’s easier to perform a deep analysis when something goes wrong.
Finally, it’s possible to set up additional automated deployment triggers. For example, when a new version of the dataset comes in, ClearML Serving can automatically start a model-training job on this new data, run some checks, and deploy the new model to production using an A/B rollout completely automatically.
Model monitoring using Grafana
Model monitoring is a crucial part of any good serving stack.
In essence, serving metrics are captured by the ClearML Serving Inference wrapper. This wrapper sends its data through an Apache Kafka service to a custom ClearML Serving Statistics service, which can (pre-)(post-)process the metrics, collect them into time windows, and report them to Prometheus. Once the data is in Prometheus, Grafana can be used to visualize and analyze the results.

Network and model latency metrics are gathered by default, but ClearML also supports logging custom metrics to Prometheus. This can be done simply through CLI commands, even while the models run. The most common use case for this is to track the incoming data distribution and watch out for data drift, as shown in the following screenshot.

The idea is to grab all incoming features for a given time window and turn them into a distribution. Each column in the heatmap plot is a feature distribution of that time window, with the colors denoting the value of each bin. This creates a sort of “rolling distribution plot” that quickly visualizes when incoming data does not fit the distribution of the history data or even the training data. In the screenshot above, we can see that, in the middle — meaning, the center of the over-time histogram graph — the data distribution shifted quite drastically.
Production alerting with Grafana
Creating custom dashboards is only part of the story. With Grafana, you can also configure custom alerts.

Set alerts related to latency, data distribution, and drift detection all from within the Grafana interface. When your production models start drifting or producing less accurate results, you’ll receive an alert, such as a Slack message or a phone notification, so you can jump in immediately and resolve the issue.
Next steps
Learn more about Grafana’s exciting alerting feature. And, if you’re interested in checking out ClearML, go to our GitHub repository and give it a spin! If you need help, feel free to join our Slack channel and our community will be glad to offer support.


