How Worldline uses Grafana Enterprise and Grafana Mimir to run its platform-as-a-service at a global scale
According to the World Bank, two-thirds of adults around the globe currently make or receive digital payments. Businesses have come to expect quick, reliable processing, and one company at the forefront of that is Worldline.
The global payment service provider (PSP) is a leading payment processor and payment provider in Europe, with about 3.4 billion e-commerce transactions made in 2022. Worldline, which deals with mostly business-to-business customers, processes online payments, payments in stores, and also works directly with banks.
The company’s main goal may be to make sure that money gets into the right hands, but a lot goes into its operations to make that happen. “Worldline is in an environment that is highly secured, linked to multiple regulations, and in an environment which is highly critical 24/7, so monitoring is absolutely key,” explains Julien Scotté, the company’s Head of Advanced Infrastructure for Belgium and Australia. As the company’s business expands to different parts of the world, it needed a global infrastructure to make transactions more agile and faster.
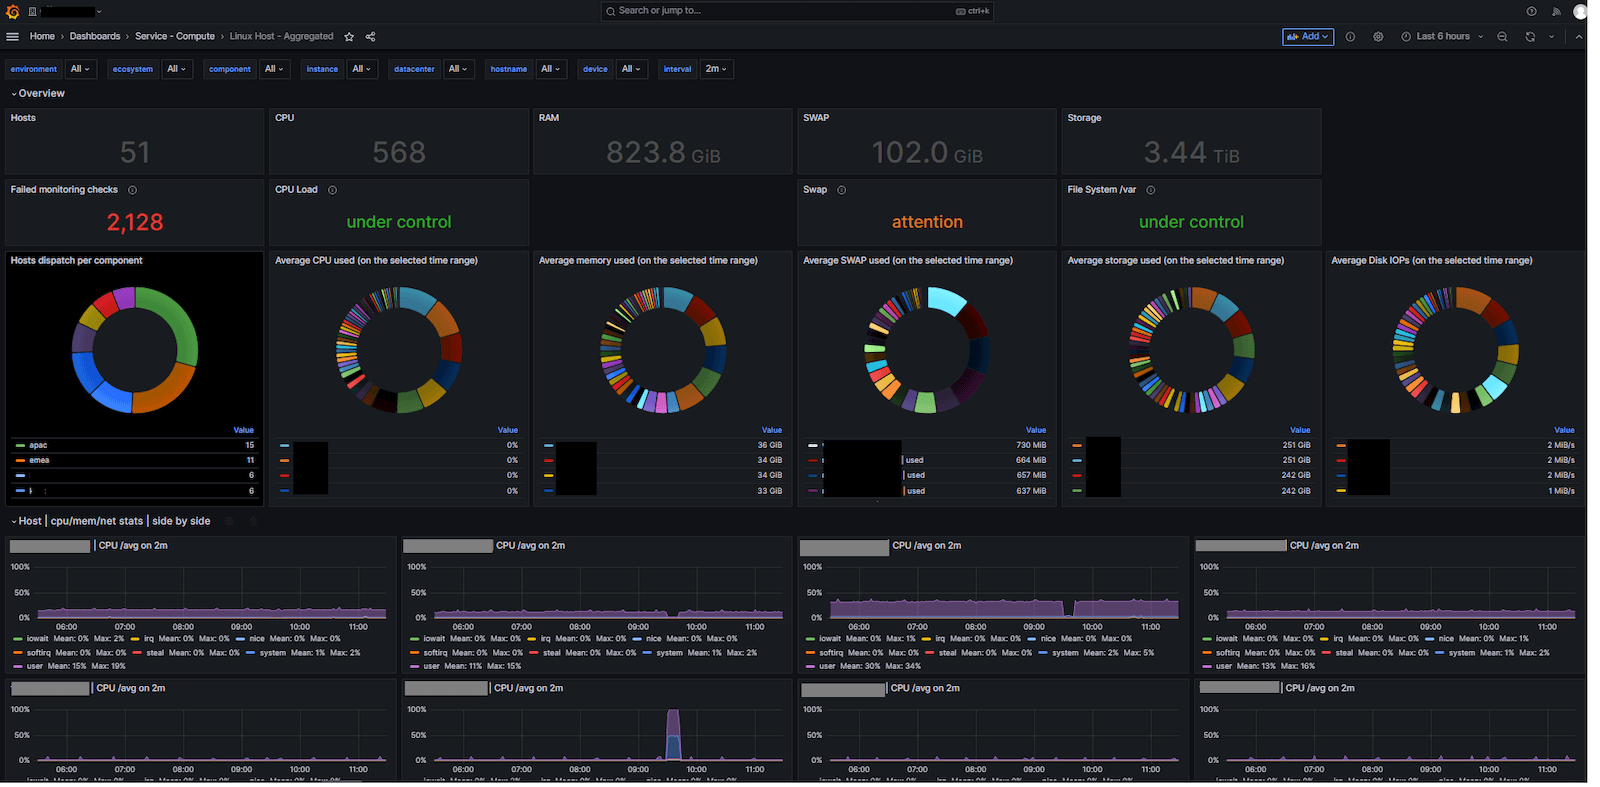
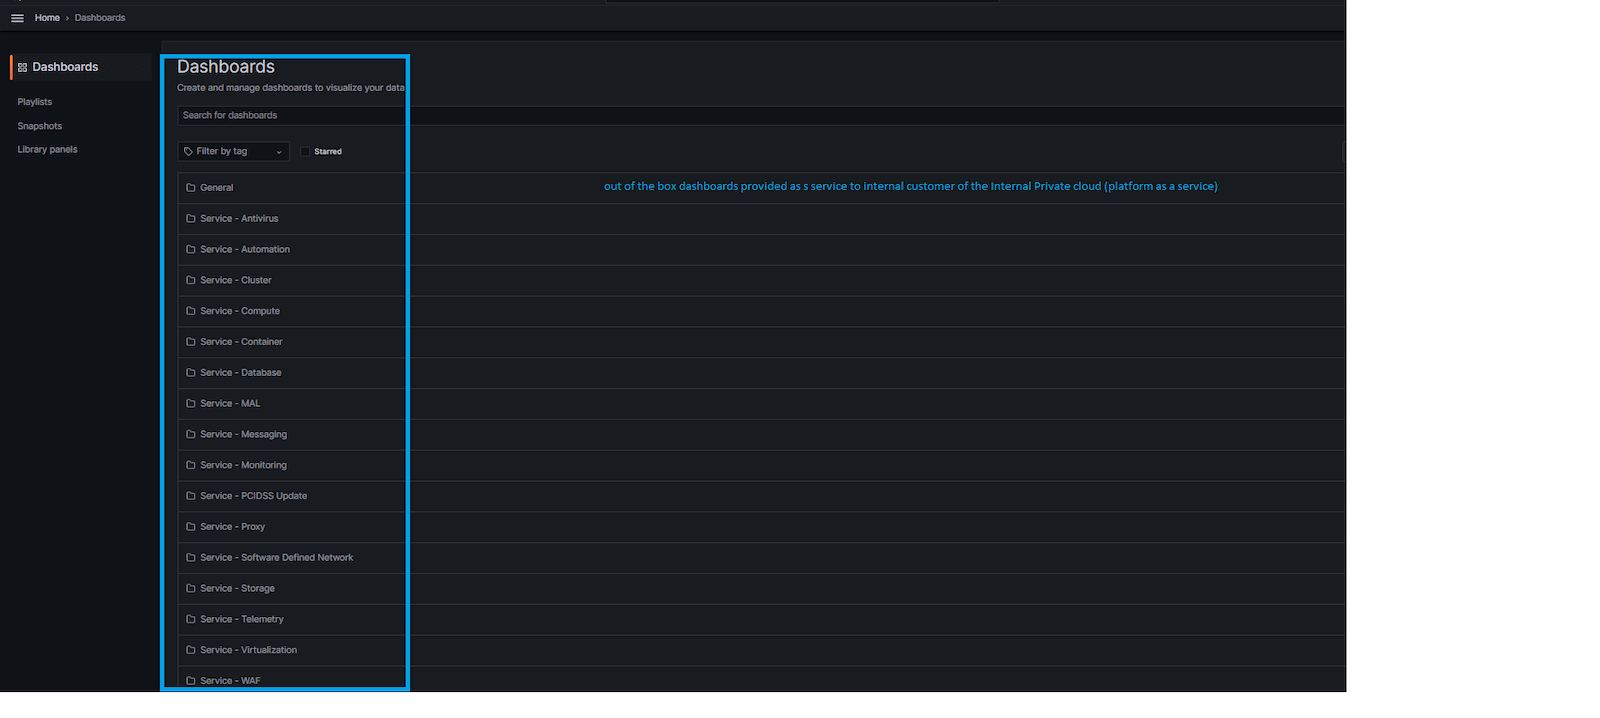
The Advanced Infrastructure teams filled that need by building an observability stack that provides a platform-as-a-service model at scale. “It is basically an internal cloud provider, with all the different bricks you can have in an infrastructure: the databases, the server, the automation, the virtualization, and all the ecosystems that would allow any of our internal clients that will consume our services — which are basically R&D and DevOps teams — to deploy their assets in a self-service manner,” he says.
“Grafana helps us in our journey to make sure that we can monitor both technical flows, plus all the payment flows of the application in the ecosystem that are there to derive an end-to-end service to our internal stakeholders — teams that have access to observability as a service,” Scotté adds. “The majority of them are from research and development — the DevOps team, infrastructure team, product, sales, and operations team — who use it more for infrastructure and sometimes business monitoring, but they can be in product sales, too.” (Worldline also has instances of Grafana that are publicly available for their end-customers, but that is a different service.)

As Worldline expands into more emerging markets around the world, there are 70 people on the SRE team who are in charge of building and maintaining the platform as a service. The team in charge of observability and monitoring (Grafana Mimir and Grafana) is composed of seven SRE, with two engineers mostly focusing on that stack.
We asked Scotté to tell us more about Worldline’s use of automation and the role Grafana Enterprise plays in making observability centralized and faster. We also talked about how he is deploying Grafana Mimir and Prometheus as well as expanding into other parts of the Grafana LGTM Stack (Loki for logs, Grafana for visualization, Tempo for traces, Mimir for metrics).
This interview has been edited for length and clarity.
How has offering infrastructure-as-a-product affected your business at Worldline?
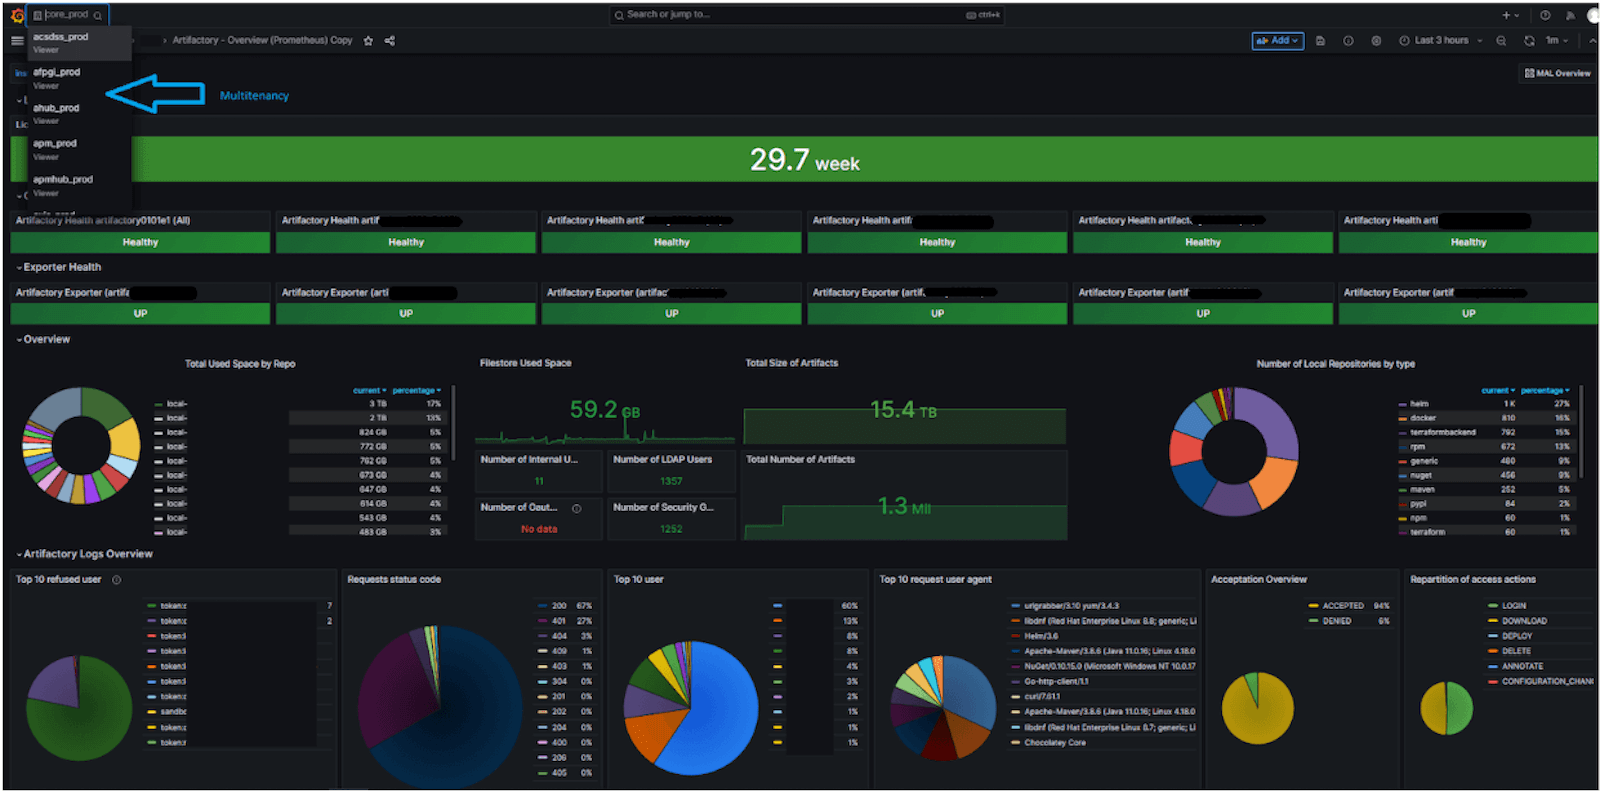
Grafana Enterprise has allowed the company to scale by way of automation, in the context of observability as a service — and thanks to multi-tenancy in Grafana. Our teams deploy their assets using our internal cloud exactly the same way they would do it with a public cloud like AWS, Azure, or Google Cloud, and they have observability as a service, which is supported by Grafana. They can view their assets, the capacity, the memory usage, dashboarding, etc., which is the part that comes with Grafana as a service.


It’s allowed us to grow in terms of scale and capacity because we’re a small team relative to the size of the full ecosystem of our infrastructure. Automation is our strength, and it’s helped us with the way we work, our cost, and harmonizing all of our tooling chains. And as a result, instead of having 15 or 20 different data centers, we now have three data centers with the same stack, same teams, same tooling, same tooling chain. Right now, I’m building a data center in Australia using the same stack we did in Europe.
How important is open source software to Worldline?
We use a lot of open source products, and that was one factor behind choosing Grafana Enterprise [which is powered by Grafana OSS]. But it was the openness and the flexibility of Grafana, too. The equivalent tooling on the market is very restrictive: You deploy an agent on a box, but you are limited to its tags, etc., and if you don’t fit the box, then that’s it. With Grafana, it’s much more flexible and agile, and you have much more ability to connect other ecosystems to it.

In addition to flexibility, what else did you like about Grafana?
The cost, of course. We started with the open source community version, which was free. When we grew, we had to look at it from a wider scale with more users and redundancy, so we graduated to Grafana Enterprise.
In comparison to the visualization tool we used to have, one of Grafana’s strongest aspects was a multi-tenancy approach. We could really separate our business line — one team could operate on their own part of the pie without touching another. Because we provide one infrastructure for everybody, teams can see what others are doing, but they can’t consume what the others are doing. That’s important for security, segregation, and more. Grafana gave us that multi-tenancy approach, plus it was completely out of the box, could be configured as code, could plug into a lot of scripting we do, and was deployable in a way that we could even limit the ability of the users to use the graphical user interface (GUI) and things like that. So instead of allowing our customers to go into the Grafana instance, go into settings, and change things with a few clicks, we remove that ability and give it all as infrastructure as a code. We do not allow anybody but our real admin population to go and manually change things in the settings. By doing that, we ensure quality with infrastructure as a code. Grafana really fit the model.
You’ve begun using Grafana Mimir, too. What led you to that?
We started using Thanos to replace the metric-based product Sensu, which could not scale for our needs, but after eight months we decided to switch to Mimir. We gained skills with Thanos and we also reached some limits, but we became more mature with our expectations. Now, we’re deploying Mimir in production parameters. We had started with a smaller infrastructure, but now we’re talking about millions of metrics a second. Since we were already using Grafana for the telemetry part, we started looking at Grafana products for the monitoring part. We conducted a POC and that was very successful, so we decided to go with Mimir and Prometheus to deploy across our global tooling chain to replace Sensu.
One of the new tools we’re also actively looking into is open source Loki. Today we use Elasticsearch for our logging infrastructure, which is okay for logs when it comes to live storage, but when we look at long-term retention storage, it’s very complicated. Loki will allow more scalable logging capabilities and new modern ways of addressing long-term retention storage.
You are constantly evolving the services offered within Worldline. How do you see Grafana Enterprise fitting into the future of observability in the company?
We’re very happy with Grafana Enterprise as a product. It’s stable, works well, it does what we want, and it’s also customizable based on our requirements. It’s also nice to see that it reflects the trend of what’s happening in the market and it’s always able to reinvent itself. We absolutely hate a product that remains stagnant and does nothing for five years. Every six months we can change our product if necessary because we are agile and we want to constantly keep up with the game, which is a big challenge, of course. In that context, Grafana is really helping us.
To find out more about Julien’s work at Worldline, contact him here.


