How to run faster Loki metric queries with more accurate results
Update!
Since this post was created, the fine folks that build Grafana have implemented [$__auto]! So as long as you are using Grafana > 10.2.0, the only thing you need to take away from this post is to just use [$__auto] everywhere, all the time!
If you are using an older version of Grafana or want to understand the concepts at play here, please do keep reading, but if you want the short version, just use [$__auto]!
Today I want to talk about metric queries. More specifically, I want to talk about an important concept that is going to make your queries run faster, give you more accurate results, and make your Grafana Loki operators (like me) much happier.
A metric query in Loki looks like this:
count_over_time({app=”foo”}[1m])And the part I want to talk about is that [1m] at the end.
Now, if you’re like me and have a short attention span and are already bored — I understand. If there’s only one thing I want you to take away from this post, it’s this:
- When writing range queries, which are the default in Explore and produce a graph result, ALWAYS USE
[$__interval]in your queries. - When writing instant queries, which produce a single result, ALWAYS USE
[$__range]in your queries.
Editor’s note: As a reminder, this should only be your one takeaway if you’re using older versions of Grafana.
I’m sorry, I know this is not the friendliest syntax; it’s both confusing and even a little counterintuitive when I essentially tell you to never use $__range in a range query. But don’t worry, I’m going to explain all that now — why it matters, how we ended up here, and more. But if at any point you want to bail out, just remember:
Always use [$__interval] in your range queries (graph) and [$__range] in your instant queries (single result).
Loki: Like Prometheus but for logs
Loki gets much of its query language from Prometheus. In fact, with only a few exceptions, metric queries in Loki are identical to queries in Prometheus.
So let’s walk through how these queries work.
Instant queries
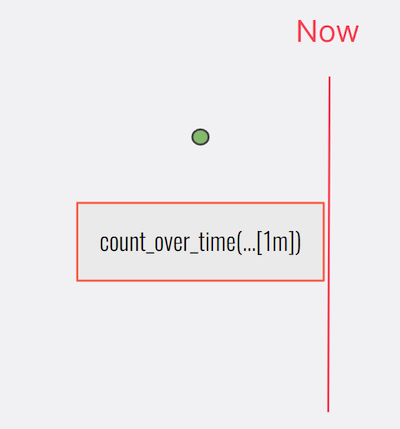
This is the most basic metric query. Loki takes your query, executes it exactly one time and produces one data point for each series matched by your label selectors. Or, if you are using an aggregation function like sum(), one series for whatever you are aggregating on.

Instant queries only take one time value as the input. In this example, that time is the current time, and Loki performs the query over the amount of time specified in the square brackets — in this case, 1m.
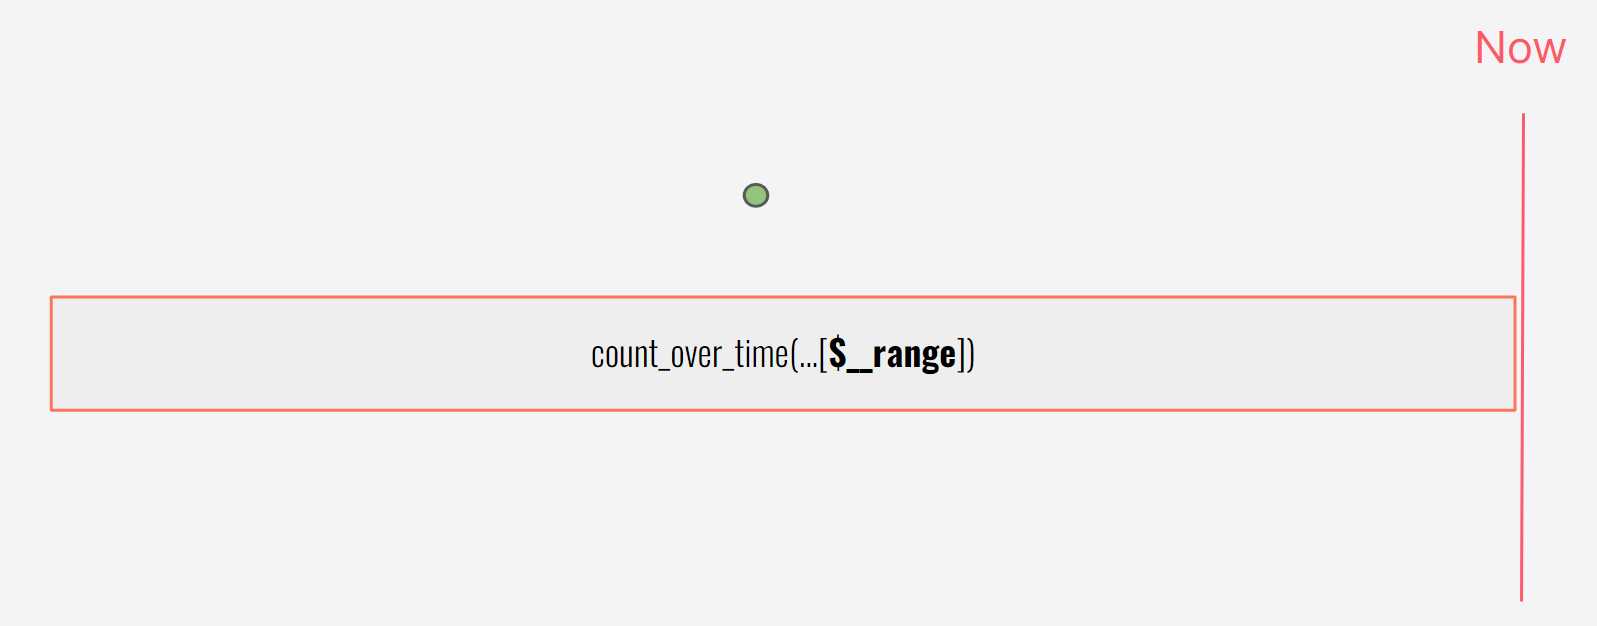
We can change that value in the brackets; it’s called the range.

Grafana has a variable that can make our lives a lot easier. This variable will map the time selector automatically to this range value, so if we select 1h or 6h from the time picker our query will automatically adjust to that range.

Note: The font makes it hard to see, but the variable is dollar sign, two underscores, range.
Range queries
We started with instant queries because they are simpler — and they’re actually the building block of a range query — but range queries are what most people work with most of the time because they produce a graph result.
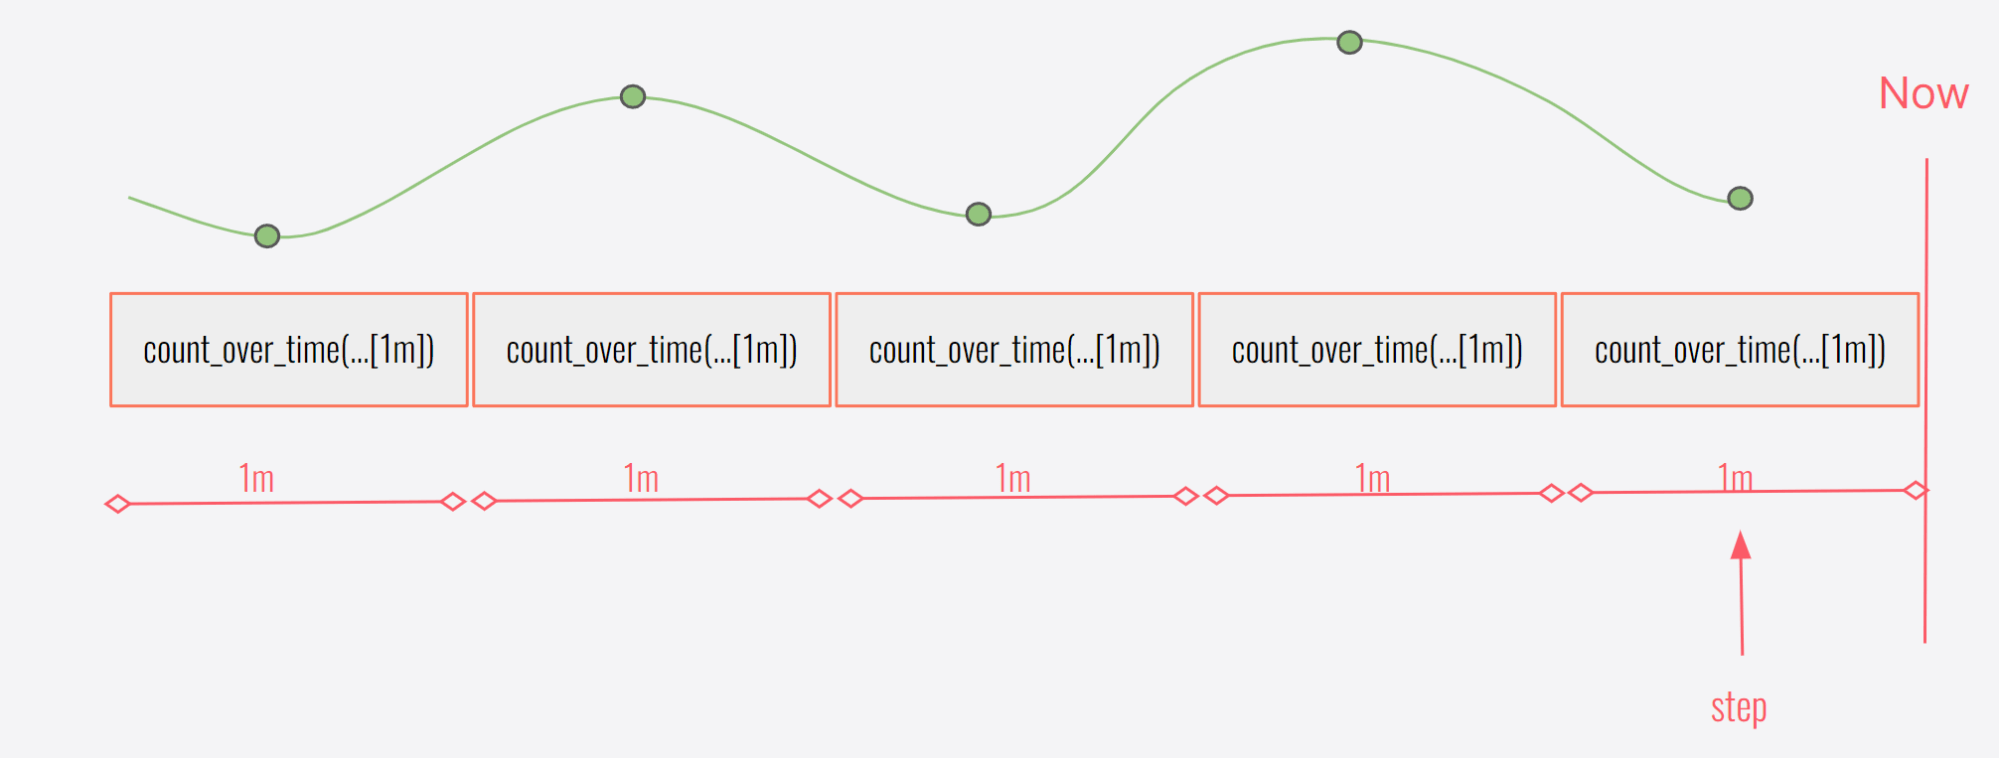
Range queries are nothing more than an instant query executed multiple times. For each execution we get a point (or points for multiple series) in our result. It looks like this:

This is where things get more interesting, more complicated, and where I have to give a bit of a history lesson. The execution of all those instant queries is controlled by something called the step, a required parameter passed to Loki for all range queries.
For most of you reading this, you’ve probably never heard of step before. That’s because Grafana both obscures and abstracts this variable into another name. This isn’t done for any nefarious reason; it’s actually pretty easy to explain: Grafana existed before Prometheus and from the early days had a concept of interval that was designed to create a user interface that gracefully handles zooming in and out on your data while keeping the number of points on screen manageable.
The interval in Grafana is chosen automatically based on the time range of the time selector as well as the width of the query panel. It’s a very clever design to try and present the most usable graph based on the space available and the time range of the query.
However, this is also where some problems arise for Loki.
Grafana uses its internally calculated value for interval as the value for step in all queries sent to Loki. This is great in some ways because systems like Prometheus and Loki can return the exact number of data points that Grafana wants to display. However, it does also create some challenges, which we’ll discuss now.
In the example above, the range value in the query was 1m and the step was 1m. This is great, but what happens when they aren’t the same?

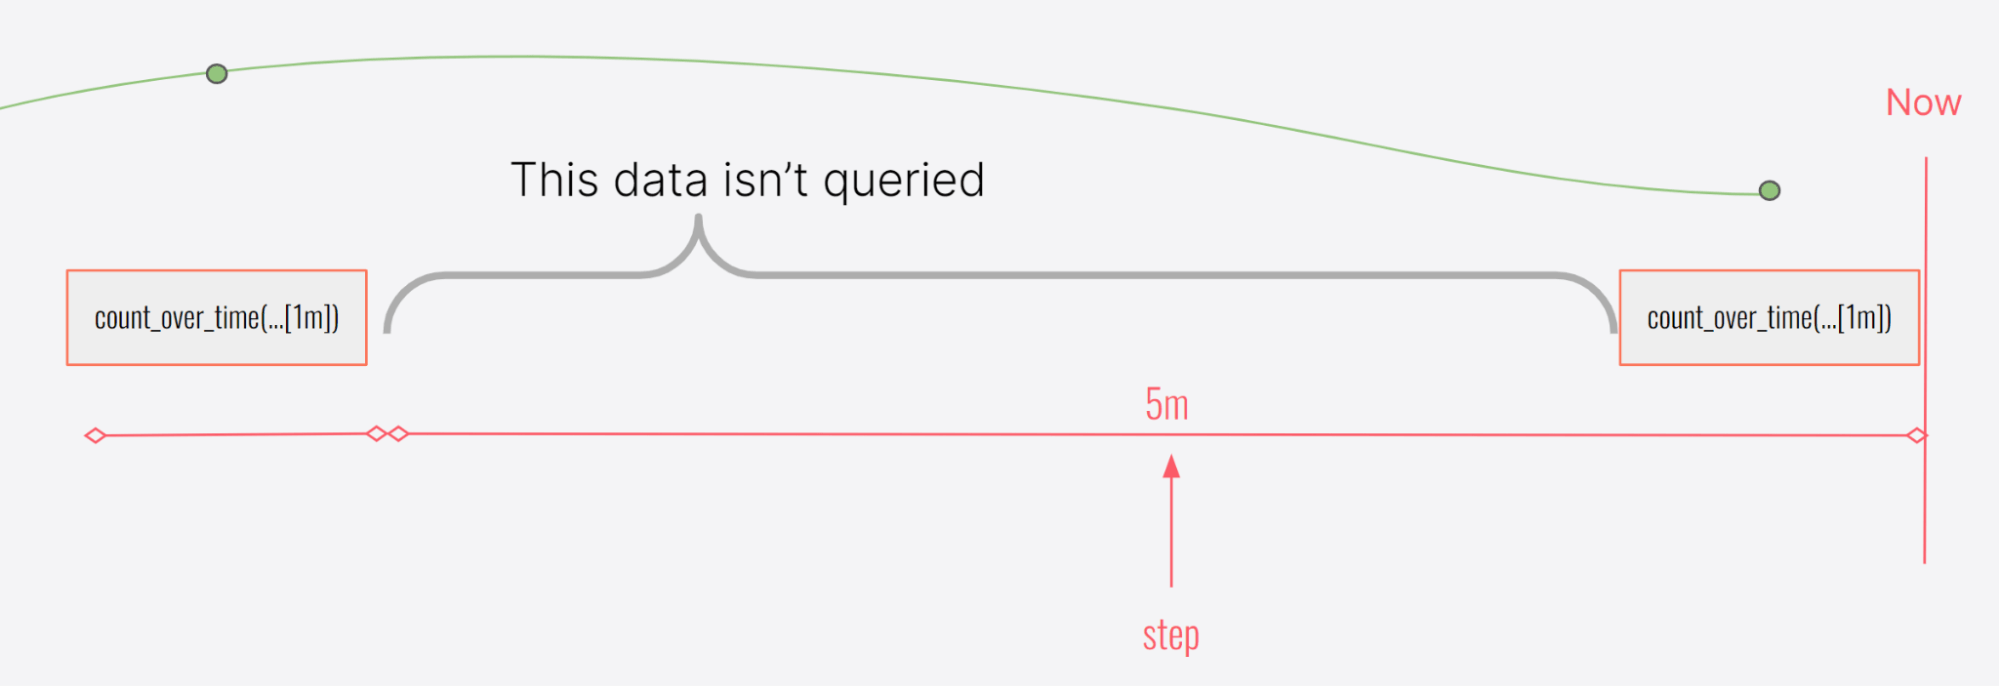
In this example, the step is 5m but the range value was only 1m. This might happen if you have a really large time window (weeks or a month) and Grafana chooses a larger value for the step based on its calculation of interval.

Here’s the opposite example. Perhaps the time window was only a few hours. In that case, the step might have been much shorter than the range. If the query is only for an hour, the step could only be a few seconds.
In both of these examples Loki is executing a count_over_time, and in both examples it’s going to produce a result which may not be what you expected. In the first, there is data that isn’t counted, and in the second there is data that is counted twice.
Good news! Grafana has another variable we can use that will address this:

By using $__interval inside the square brackets, Grafana will substitute the value it calculates for interval, which is the same value it will send to Loki as the step. This will guarantee that no matter how much you zoom in and out, Loki will always exactly query all your data.
This is why 99.9% of the time I recommend using [$__interval] for range — it will give you the best result and offer the best performance.
But what about that 0.1% of the time 🙂?
Special cases
I used the word “accurate” in the opening line of this blog, but technically using $interval doesn’t change the accuracy of your result. It’s more like it aligns the results with most people’s expectations. That is to say, most people would want a query like count_over_time to count all their logs and using $interval is the best way to guarantee this.
However, underquerying and overquerying data can be useful. They can also be used intentionally, with care.
In underquerying, you are effectively sampling the result, asking Loki to query [1m] of data every five minutes. If you know your data is relatively uniform, this could be a nice way to reduce the amount of work Loki has to do if the result you get from looking at a sample of the data is good enough for your purposes. This can be useful when trying to query over longer and longer time periods.
In overquerying, yes, Loki is querying the same data twice, but it’s also giving you perhaps a more useful result in some cases. For sparse data over short time ranges this can be a nice way to turn a broken up series of dots on a graph into a smooth sparkline. It also fixes each point on the graph to show you the query result over exactly [1m] of data. This could be useful if you wanted to know the specific count of events per minute, or per second, regardless of how far apart the points are.
Just be careful here and remember that as you start zooming out on your graph, your overquerying soon turns into underquerying, as the step increases each time you zoom out.
What’s next
Every time I’ve sat down to write this post, I always get stuck saying to myself, “Wouldn’t it be better to put your efforts into finding a better solution to this problem instead of trying to explain it?” Well, ultimately I’d like to do both. I think the information explained here is helpful in understanding how Loki metric queries are executed. I’m also happy to say there are changes coming to Grafana very soon that will eliminate this problem for most users in most use cases!
Coming soon: [$__auto]
Editor’s note: As cited in the update at the top of this post, [__auto] became available in Grafana 10.2.
We’re developing [$__auto] to replace [$__interval] and [$__range] completely. You will be able to write any query with [$__auto] and Grafana will choose correctly for you based on the type of query — instant vs. range.
Additionally, if you chose to set the range value directly to [1m], Grafana will set the step of the query to [1m] so you can very quickly update both the range and step together in one place to give properly queried results.
And if that weren’t enough! There will also be an option soon to directly set the step value for advanced use cases where you may want the [range] and step set differently.
Looking beyond [$__auto]
With the introduction of [$__auto], most users will find themselves including this in every metric query, at which point it will quickly start to feel redundant. We’ve already begun discussions around making it entirely optional, however, this is quite the departure from the Prometheus query language and ultimately we haven’t really reached a consensus on this yet. Still, I suspect as time goes on we will continue to evolve here and there may very well be a day where we allow [] or even completely omit the range from a metric query in Loki!
Grafana Cloud is the easiest way to get started with metrics, logs, traces, and dashboards. We have a generous forever-free tier and plans for every use case. Sign up for free now!


