How to fix performance issues using k6 and the Grafana LGTM Stack
The Grafana Labs ecosystem is built on a range of different projects that incorporate logs, metrics, traces across load testing, and Kubernetes monitoring. I’ll assume you know all of that data (and more!) can be visualized in Grafana. What made my observability dream become reality, though, is how these systems can work together to help you effectively debug performance issues and operate your system with more confidence.
In this post, I’m going to explain how you can utilize the Grafana LGTM Stack (Loki for logs, Grafana for visualization, Tempo for traces, Mimir for metrics) in combination with Grafana Cloud k6 to run a load test that will help you find — and fix — bottlenecks.
(Want to learn more about the LGTM stack? Check out this webinar.)
Getting started
Note: I’m not going to go into detail about any configuration options, so if you need a good place to start with that, check out the Grafana Cloud quickstart guides.
For the demo in this post, I’m using the OpenTelemetry Demo Application. The application provides a webshop for astronomy equipment, but what matters more in this case is that it is very well instrumented and exposes structured logs, meaningful metrics, and distributed traces out of the box.
By modifying the Kubernetes deployment a bit, the metrics and traces are sent to Grafana Cloud for storage. If you want to follow along, you can use our documentation on the OpenTelemetry Collector to send the telemetry data to Grafana Cloud.
Writing a load test
To figure out where my bottlenecks are located, I first have to verify a way to reproduce them. By writing a load test that describes a typical user flow, I can simulate a large number of Virtual Users (VUs) accessing our site at the same time. For my webshop example, a typical user flow could look something like this:
- Open the landing page
- View a product
- View a different product
- Add the product to the cart
- View the cart
- Submit the order
Writing down this flow in k6 results in the following script:
import http from "k6/http";
import { sleep, check } from "k6";
import { uuidv4 } from "https://jslib.k6.io/k6-utils/1.4.0/index.js";
export default function () {
const userId = uuidv4();
const url = "http://webshop.example";
http.get(url);
sleep(1);
http.get(`${url}/product/OLJCESPC7Z`);
sleep(1);
http.get(`${url}/product/2ZYFJ3GM2N`);
sleep(1);
http.post(
`${url}/api/cart?currencyCode=USD`,
JSON.stringify({
item: {
productId: "2ZYFJ3GM2N",
quantity: Math.floor(Math.random() * 10),
},
userId: userId,
}),
{ headers: { "Content-Type": "application/json" } }
);
sleep(1);
http.get(
`${url}/api/cart?sessionId=${userId}¤cyCode=USD`,
{
tags: { name: `${url}/api/cart` },
}
);
sleep(1);
http.post(
`${url}/api/checkout?currencyCode=USD`,
JSON.stringify({
userId: userId,
email: "someone@example.com",
address: {
streetAddress: "1600 Amphitheatre Parkway",
state: "CA",
country: "United States",
city: "Mountain View",
zipCode: "94043",
},
userCurrency: "USD",
creditCard: {
creditCardCvv: 672,
creditCardExpirationMonth: 1,
creditCardExpirationYear: 2030,
creditCardNumber: "4432-8015-6152-0454",
},
}),
{ headers: { "Content-Type": "application/json" } }
);
}Since I want to benchmark my code against some expectations, let’s assume my goal is to serve 80VUs and keep the 95th percentile of response times below 200ms. I also want the rate of errors to be less than one percent. In the k6 script, this is specified in the options variable. This is also where I define the number and behavior of virtual users.
export const options = {
  stages: [
    { duration: "5m", target: 80 },
    { duration: "20m", target: 80 },
    { duration: "5m", target: 20 },
  ],
  thresholds: {
    http_req_failed: ["rate<0.01"], // http errors should be less than 1%
    http_req_duration: ["p(95)<200"], // 95% of requests should be below 200ms
  },
  ext: {
    loadimpact: {
      projectID: 3642186,
      name: "Basic user flow",
      distribution: {
        "amazon:de:frankfurt": {
          loadZone: "amazon:de:frankfurt",
          percent: 100,
        },
      },
    },
  },
}
While it would be possible to run the test from my local machine, the current load of the workstation and the respective network connection could bias the results.
To easily schedule distributed load tests, Grafana Cloud k6 offers different load zones. It’s a good idea to choose load zones matching the geographic location of real users to accurately represent latencies as experienced by end users.
I can then either upload this script to Grafana Cloud k6 using the script editor or use the k6 CLI to upload and run the test.
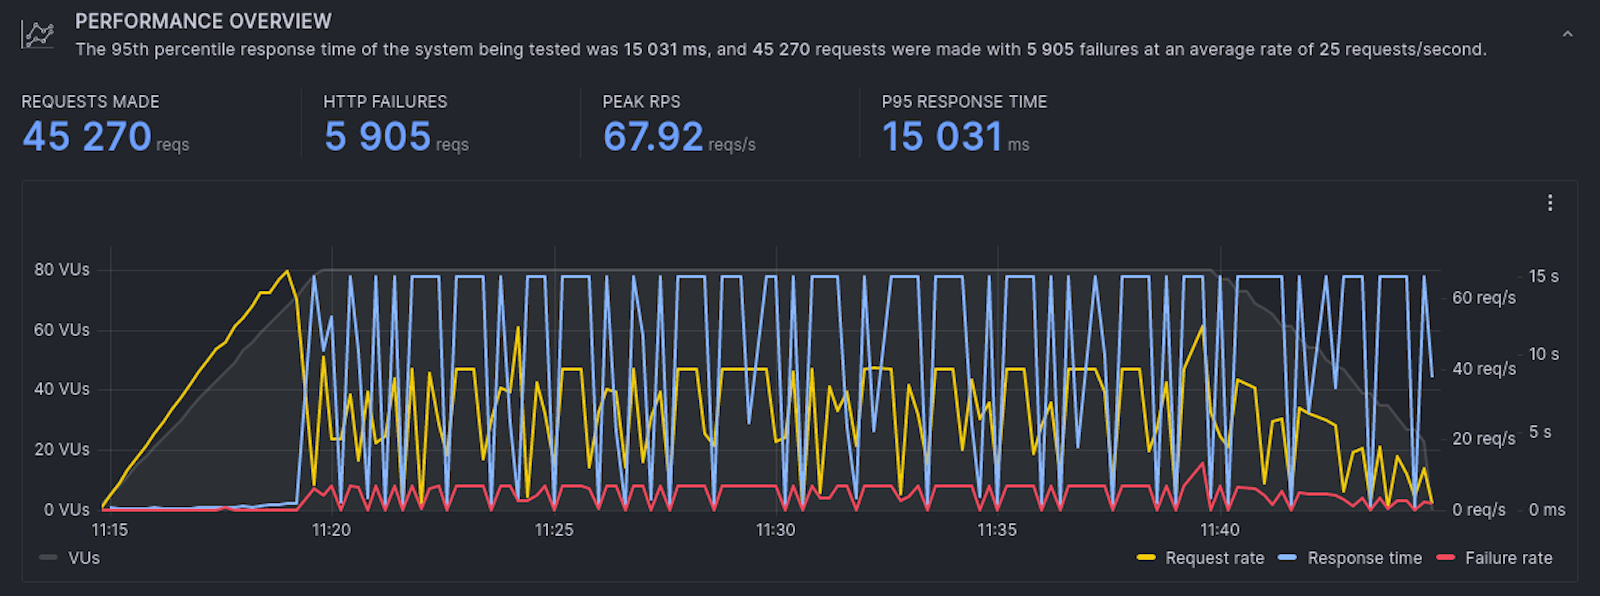
k6 cloud loadtest.jsHere is what my test run results in Grafana k6 Cloud look like:

As defined by my k6 script, the test run linearly scales up the amount of users over the first five minutes.
While the load was ramping up to 80 VUs, I was able to observe a sudden drop in request rate (yellow) and failure rate (red), as well as inconsistent response times (blue).
Let’s take a closer look at what might be happening . . .
Looking for clues
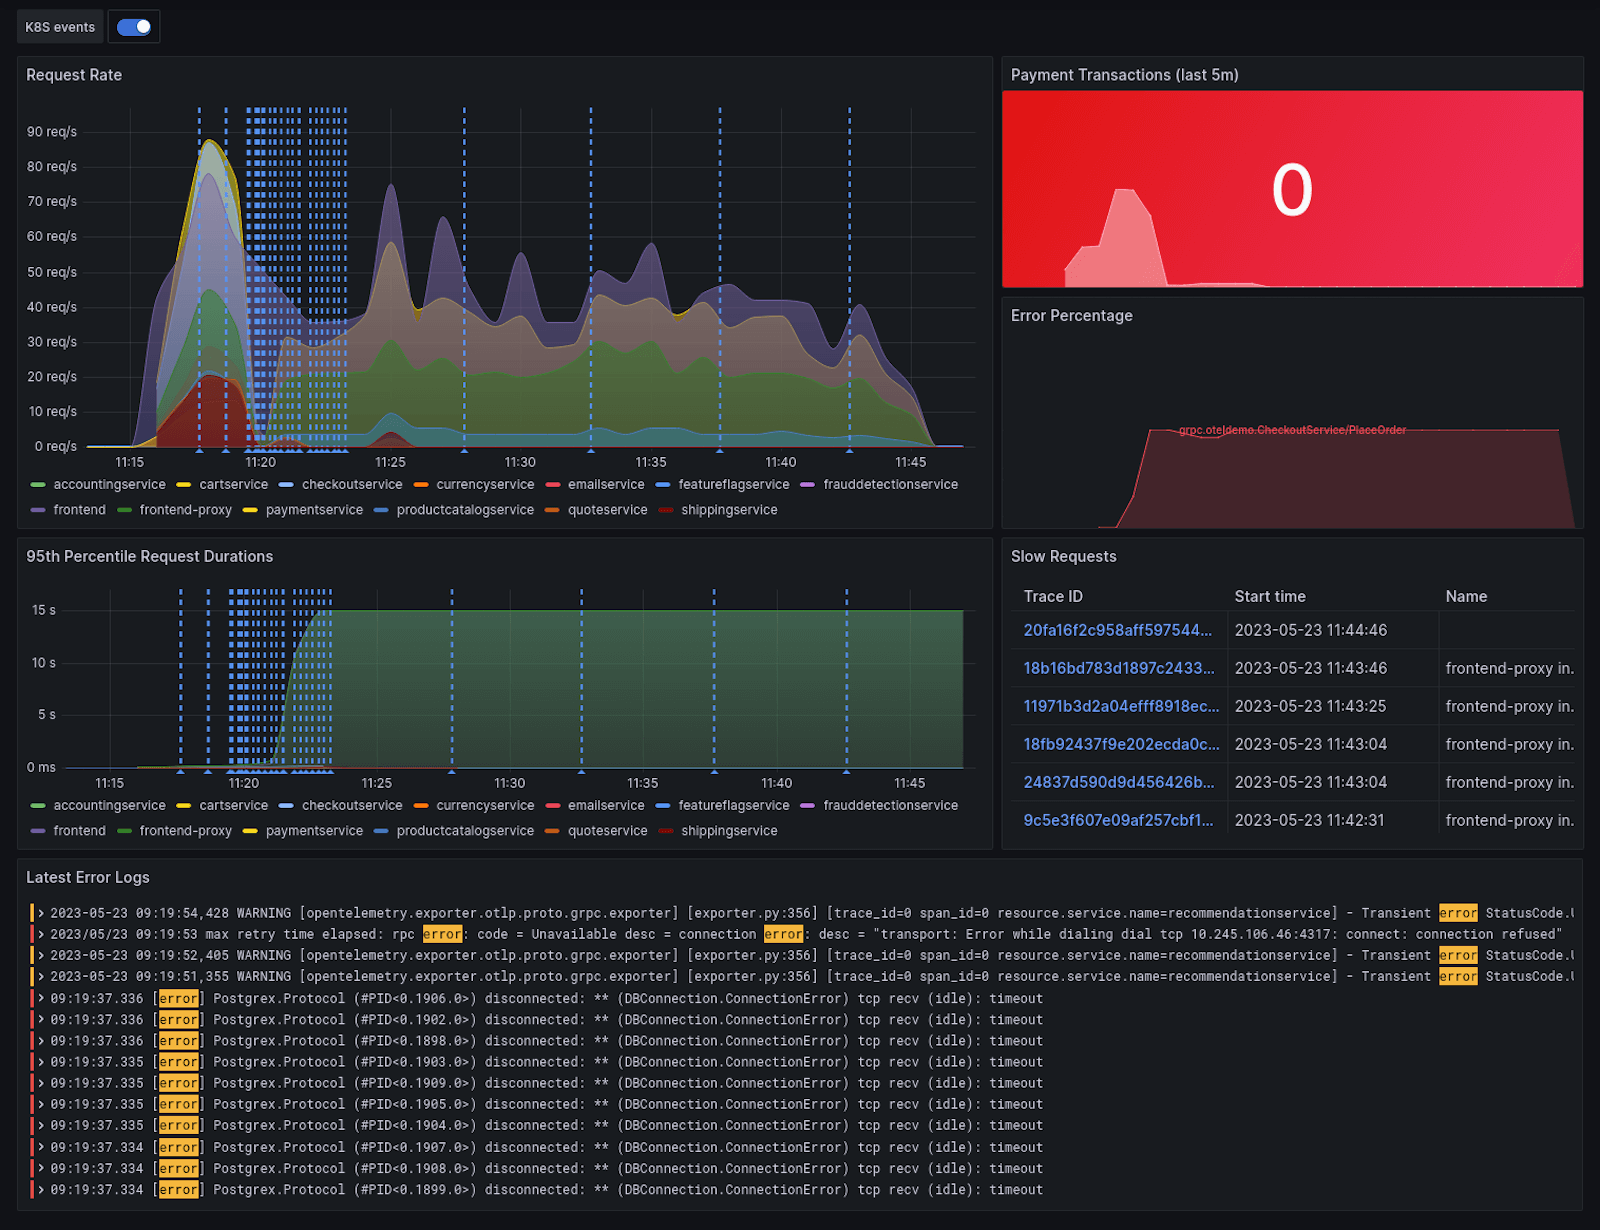
The demo application is fully instrumented, but having to remember queries can be quite challenging. The great thing about creating a Grafana dashboard is that you can pull data from all of your sources and have it in one place. The result is a beautiful overview of all your telemetry data like this:

Taking a closer look at the dashboard, I can see two concerns:
- The Place Order RPC call to the checkoutservice encounters a high rate of errors
- Correlating with the increase in error rate and latency, Kubernetes emits container restart events
Taking a closer look at the checkoutservice pod in Kubernetes reveals the cause of the issues: The pod is running out of memory! To resolve this, I can increase the memory limit, scale up the service, or do both.
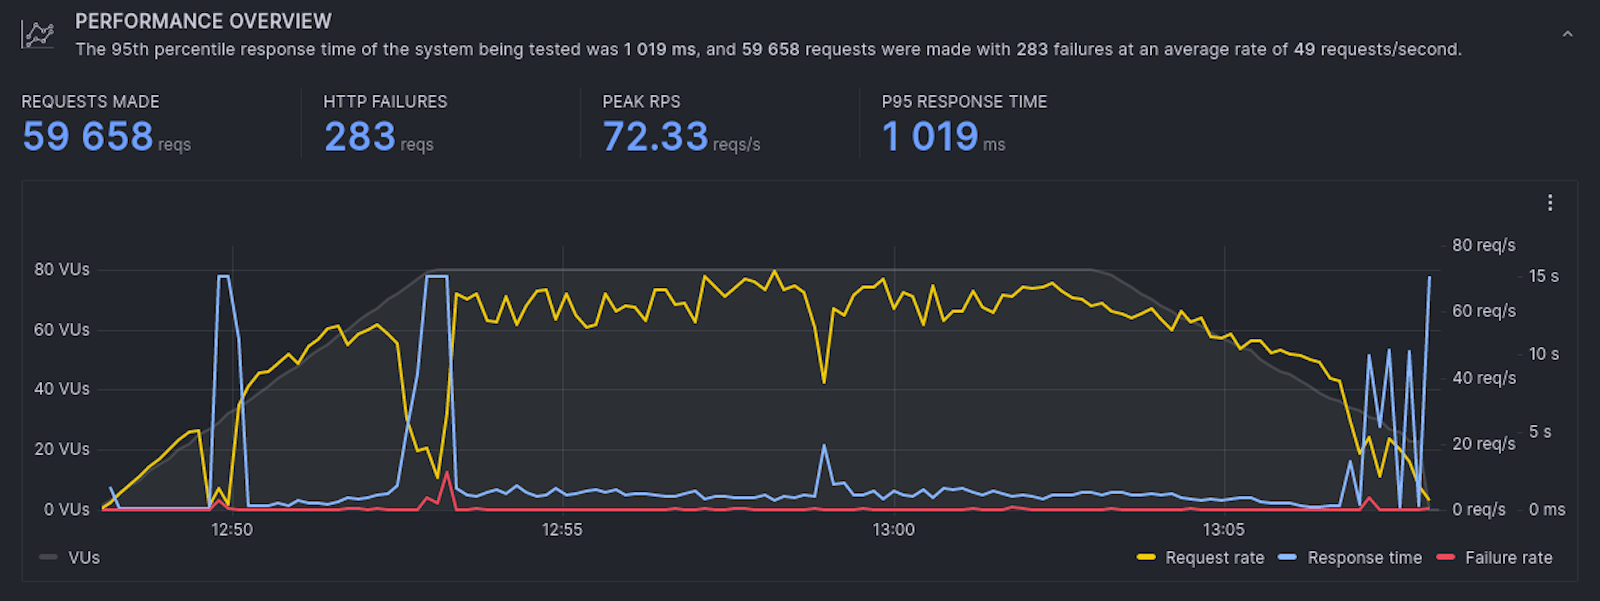
Let’s run the test again and see if the changes had the desired effect.

The first two disruptions in service that are visible above (blue and yellow lines) are due to a restart of the product catalog service and email service. To solve this, I can apply the same fix as above: increasing the limits and scaling up.
Sadly, even after these improvements, my P95 response time is way too slow — 1.019s. To figure out which part of the requests take so long, I need to dig a bit deeper.
Zoom in and enhance
By correlating the increase in the test run with my dashboard, I can see that the slowdown originates from the checkoutservice. However, this time the service is not crashing — it is just slow to respond. To see what’s taking it so long, I can utilize tracing.
The trace panel on the right of my dashboard filters out some of the longest recent requests. I can pick any one of them to take a closer look.
By clicking on the TraceID of a trace, I am redirected to the trace view, which gives a detailed timeline of the entire request lifecycle. A trace consists of multiple spans, and each one has a defined start and end time relative to the start of the trace context.
Since I’m interested in why this request takes so long, I have to find unusually long spans.

The trace visualization shows the checkoutservice calling the convert endpoint of the currencyservice. It sends the message successfully 28.13ms after the start of the request, but the currencyservice only starts processing the request after a whopping 4.9s!
The most common cause for this failure pattern is a backlog of packets. If the amount of requests currently being processed is too large, new requests will wait for resources to become available again.
To solve this issue quickly, I’ll scale up the service to distribute the requests across more instances. (Other more sustainable ways to fix this sort of issue would be to improve the way the application handles concurrent requests or to introduce caching.)
The same pattern is also appearing for the shipping, payment, and frontend services, so I’ll scale them up as well.
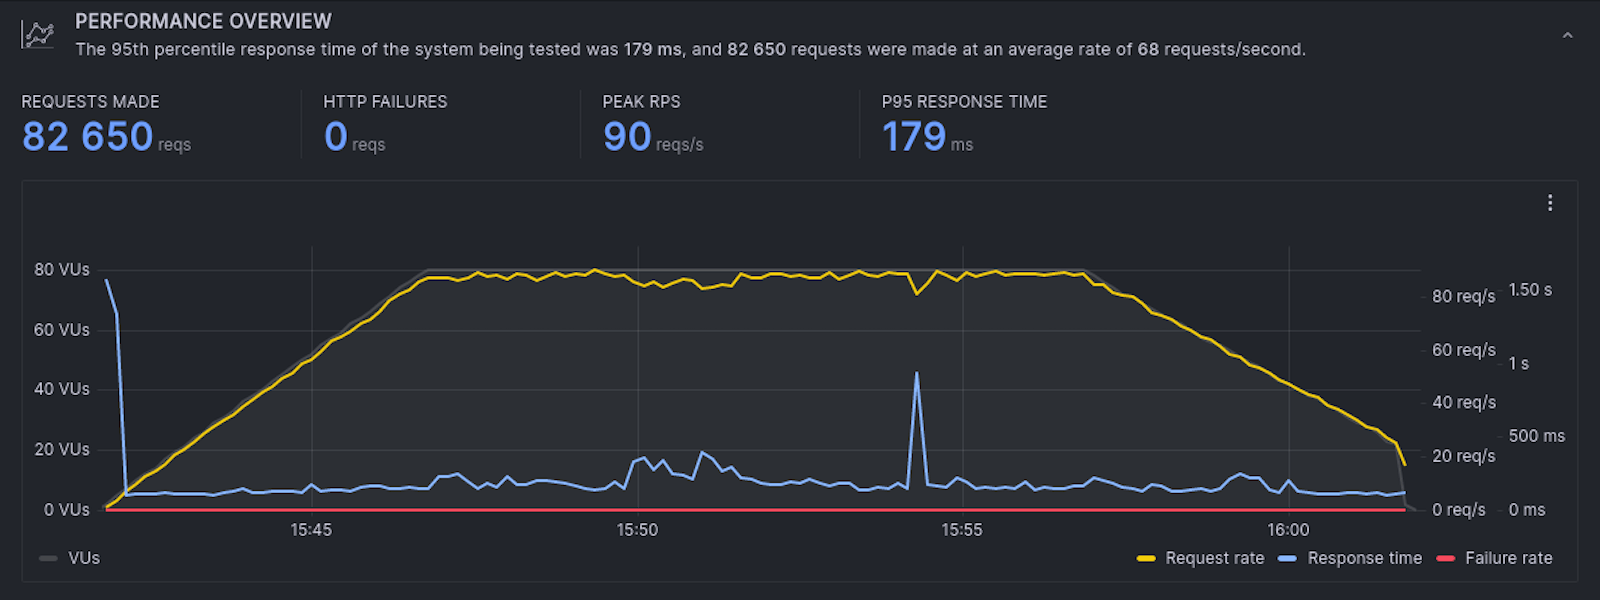
Now, when I re-run the test, everything looks great!

As you can see, the load curve does not noticeably affect latency, and all our defined thresholds hold. To avoid running into the same issues again, it would be a good idea to run this test on a schedule or integrate automated load testing into a CI/CD pipeline.
Next steps
I hope you’ve gained an appreciation for how the combination of k6 and the LGTM stack make it really easy to discover issues and correct them — but the tests and diagnostics performed in this post are only the beginning of what is possible.
Now that you know how to run a load test to measure an average load, the next step on your load-testing journey could be to explore different types of load tests. Or if you’re looking to improve your observability system, be sure to take a look at:
- Exemplars to speed up the correlation of metrics and traces
- xk6-disruptor to introduce some chaos into your test
- Pyroscope to figure out where your CPU/Memory is being spent
- Faro to add real user monitoring (RUM)
- k6-browser to also test the performance of your frontend code
If you have any questions, please reach out to us on our Community Slack or the Community Forums. We’re looking forward to hearing your success story!


