Celebrating Grafana 10: Torkel's top 10 moments from a decade of dashboarding
Grafana creator Torkel Ödegaard will never forget the very first GrafanaCON in 2015, when he shared some big news with the audience gathered in New York City. “I’ll always remember standing on stage and announcing that we just reached 12,000 instances and being super proud because it was just a couple of months after we started tracking these numbers,” says Torkel, who also launched Grafana Labs with co-founders Raj Dutt and Anthony Woods in 2014. “Little did I know what the next eight years had in store.”
Fast forward to GrafanaCON 2023, streamed globally from June 12-14, and there’s even more to celebrate: There are currently more than 1.2 million active Grafana instances in the wild with an estimated 20 million users visualizing data with Grafana every day.

With the release of Grafana 10 at GrafanaCON 2023, this year marks a major milestone in the open source project, which started when Torkel made his first commit in December 2013. He then went on a 14-day commit streak on GitHub and never looked back. Today, there are roughly 19 internal teams at Grafana Labs that focus on improving and innovating around Grafana, not to mention almost 2,000 contributors to the project. And Torkel has remained active alongside them.
“I have been working on Grafana for a very long time, but it’s been incredible. In some ways nothing has changed that much. I still wake up almost every day and work on Grafana — fixing bugs, looking at PRs, reviewing issues,” he says. On the other hand, “the scale of things has changed massively, and the community has grown beyond what I could have ever imagined.”
Here, in his own words, Torkel takes a rare moment to pause and reflect on some of the most memorable moments and development details from the past decade that have led to building the de facto data visualization platform used around the world.
1. Early adoption of Grafana (2014)
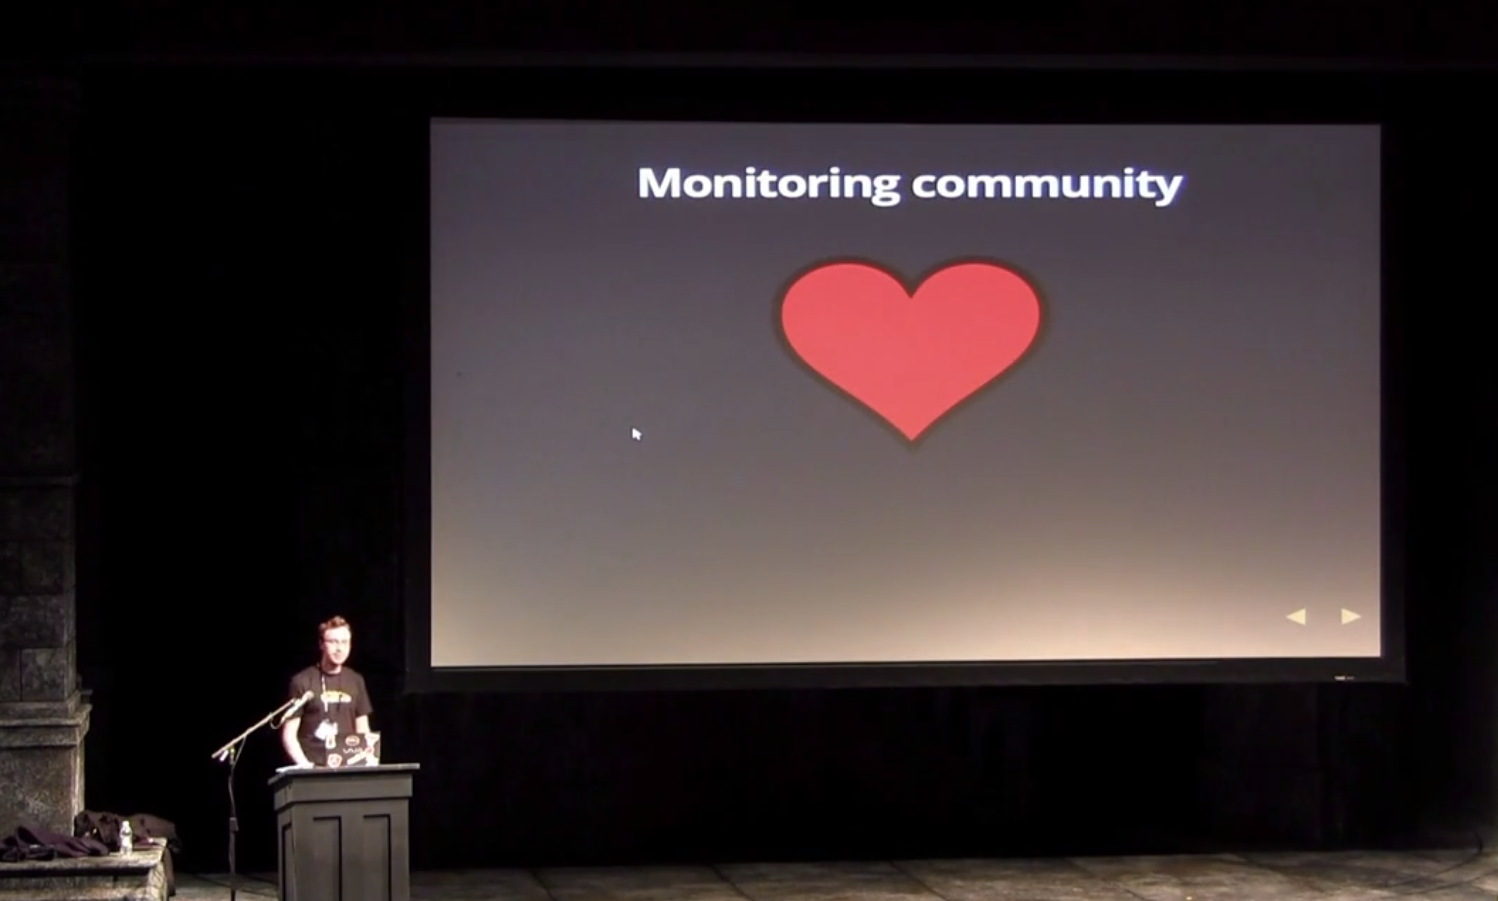
The response from the monitoring community was really overwhelming right from the start. Just a lot of love on Twitter and GitHub. Within months of releasing the open source project in 2013, it was obvious that it struck a chord with people. This became really evident when I first introduced Grafana within the e-commerce company where I worked at the time. All of a sudden teams picked it up, and it impacted the way people worked so radically. Every Friday, we had an all-hands meeting when teams presented what they had been working on, and they commonly used Grafana to showcase the impact of performance changes or the impact of changes based on user behavior. They could measure and see information in the graphs so everything became much more data-oriented within months of the company using Grafana. Seeing how quickly that change happened in how teams work was really, really exciting. That also made it even more clear to me that this really could be something.

2. Attending Monitorama (2014)

The first Monitorama I went to was maybe four and a half months after the first release of the project. I got invited to speak on the last day of the conference, and by that point there was already so much excitement and love for Grafana from the monitoring audience. It was incredibly welcoming, and there was a lot of loving community feedback. It felt like 20% of the audience were already using Grafana, even within months of introducing the project. It was really a key moment in helping me feel more confident in my decision to step away from my job and work on Grafana full-time, which is what I announced at that conference.
3. Watching the Space X Falcon 9 landing (2016)
When they first landed the Falcon 9 rocket, SpaceX released a promotional video (below) where we saw Grafana being used in the large control center. This was still pretty early in Grafana’s and Grafana Labs’ journey, and that was a really exciting moment because I was following that process a lot, being a space nerd and all. A few weeks later, Microsoft also had a video showing an underwater data center where they had Grafana dashboards too, which was cool. Seeing Grafana in the wild is always fun, whether it’s on customer calls where they demo the dashboards they’ve built or seeing how far Grafana users can take the dashboarding system by adding a bunch of hacks or using the text panel with customization panels and plugins.
4. Hosting GrafanaCON in Amsterdam (2018)
I remember standing in front of the audience at GrafanaCon in Amsterdam, which was such a beautiful venue, and getting everyone on stage — we could barely fit all our employees at that point and we were only about 20-25 people at the time! I just remember this conference as a huge success, our best in-person event by far (up to this point). Getting every employee on that stage, and being amazed how many were there — it just gave me a really positive, proud feeling and excitement for the future.

5. Adding color gradients to visualizations (Grafana 8.1, 2021)
On the feature front, the functionality that I really like in Grafana is that we can have gradient color scales. I really obsess over visualizations that have a very visual hook or flare. You can have lines or bar graphs that are gradients based on thresholds. Not many dashboarding tools or observability tools support this level of control over color scales so I’m pretty proud that you can do cool things like that in Grafana. You can specify a color scale and that same color scale feature works across many different visualizations, like the table panel and stat values.

6. Redesigning the Grafana navigation (Grafana 10, 2023)
I’m really excited about the new navigation that we’re launching as the default in Grafana 10. Getting consistent breadcrumbs on all screens has been a feature that I’ve been thinking about and wanting to push for many years. I’ve helped design and develop this feature with the team working on navigation. I’m super excited and happy that we’re finally doing a big redesign of the navigation and page layouts.

7. Building the state timeline panel (Grafana 8.0, 2021)
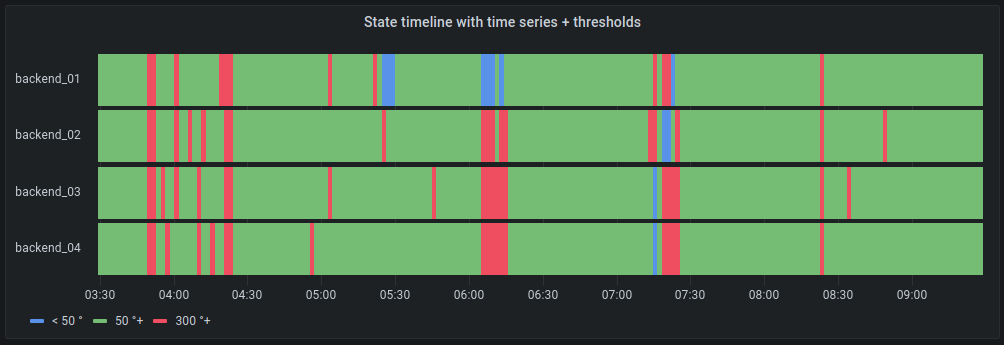
The state timeline panel is a feature we added in Grafana v8 that I think is really useful. It’s also something that maybe not that many people think of when they design dashboards. It can both support string values over time, but also it can apply to time series and break time series up into distinct blocks based on thresholds. So instead of looking at a bunch of graphs, you can very clearly see when a specific value range or a specific time series was good or bad. This type of timeline is a really powerful visualization that I think many might overlook.

8. Rolling out query builders (Grafana 1.0, 2014 & Grafana 9.0, 2022)
The Graphite query editor was present in the first version of Grafana, and I don’t think it has been matched in terms of power and ease of use since then. It has basically been the same, since version 1.0 with only minor improvements. It’s still, I think, the most powerful and easy to use query builder for any time series database. As a follow up, another of my favorite features are the new query builders for Prometheus and Grafana Loki that I personally worked on as well. They’re more complex because Loki and Prometheus have more complex query languages, but they are still really powerful and allow you to use a UI to create queries without knowing any of the syntax. And they’re also very unique — there’s no other Prometheus query builder like the one in Grafana.

9. Choosing simple design in the name of data (2015; Grafana 1.0)
Grafana has these panels that are very clean and simple compared to Kibana, which at the time had five buttons on each panel. I removed them from the get-go because when you put up the dashboard on a TV wall or just look at it on screen, I wanted it to have a very clean look. Some of the legacy systems just rendered PNG images of charts in a grid, and because they were images, you couldn’t have buttons on them. So I wanted to mimic that clean look where edit actions were more on demand. We made the decision early on to prioritize the aesthetics, and the design philosophy behind Grafana was a stripped down look that wouldn’t get in the way of the data.
10. Working with the open source community (2013 to today)
The thing that is most memorable to me throughout this journey is the community. Most of the time, especially early on but I think even over the years, people who open bugs are almost always so appreciative of the project. Even when they found something that doesn’t work, they were usually very supportive. There were occasionally, of course, some bad actors, but overwhelmingly most people while opening an issue also took the opportunity to say thank you for the project. That has made working in open source such a rewarding experience — to see that kind of appreciation even from people who are struggling!
Grafana: How it all started
The GrafanaCON 2023 opening keynote (which you can watch on demand) kicked off with a video chronicling the journey of the Grafana project and its open source community. A longer documentary will be released later this year.
There’s supposed to be a video here, but for some reason there isn’t. Either we entered the id wrong (oops!), or Vimeo is down. If it’s the latter, we’d expect they’ll be back up and running soon. In the meantime, check out our blog!
To learn more about the latest major release, check out our recent Grafana 10 blog post and watch our “Deep dive into Grafana 10” GrafanaCON session on demand.
Grafana Cloud is the easiest way to get started with metrics, logs, traces, and dashboards. We have a generous free forever tier and plans for every use case. Sign up for free now!


