GrafanaCON 2023: A guide to all the big announcements from Grafana Labs
GrafanaCON 2023 marks a huge milestone: It’s the official release of Grafana 10 and also the kick-off to celebrating a decade of dashboarding with Grafana.
The GrafanaCON 2023 opening keynote opened with a short video that details Grafana’s origin story. (A full documentary will be released later this year.) Then Grafana Labs co-founders Raj Dutt, Torkel Ödegaard, and Anthony Wood, streamed live from Stockholm, Sweden, the birthplace of Grafana, where they reflected on how far the Grafana project has come since Ödegaard sent his first commit in 2013 — and showcased some exciting developments that will help shape the future of Grafana, observability, and our open source community.
There’s supposed to be a video here, but for some reason there isn’t. Either we entered the id wrong (oops!), or Vimeo is down. If it’s the latter, we’d expect they’ll be back up and running soon. In the meantime, check out our blog!
Below is a summary of all the major headlines from our biggest community event of the year.
Plus you can watch any of the 30+ sessions from GrafanaCON 2023 on demand today. Throughout the event, we also highlighted all of the latest updates in Grafana Loki for logs, Grafana Tempo for traces, Grafana Mimir for metrics, Grafana Pyroscope for continuous profiling, and more!
There are also GrafanaCON 2023 Local Meetups this June in more than 20 cities around the world to give you a chance to connect in person with a Grafana community near you. Check out the agenda for each meetup on the official GrafanaCON 2023 Local Meetups web page.
Grafana 10 is here!
In 10 years, the Grafana ecosystem has only gotten bigger. There are now 20 million users worldwide and 150 data sources, both open source and commercial.
“What’s been remarkable about the success of Grafana is the evolution of the visualization capabilities that have really blossomed as the Grafana dashboard became ubiquitous," said Ödegaard. “It’s incredible how big its footprint has become and how many great new ideas for visualizations and use cases keep pouring in from the community.”

Grafana 10 is no exception. Along with new visualizations like the datagrid panel and the trends panel, Ödegaard and Director of Engineering Mihaela Maior previewed some of the latest enhancements to the Grafana UI that makes getting started with dashboarding even easier, reducing the steps from 15 to just 4. There are also new ways to connect (Correlations!), organize (Subfolders!), and share (Public Dashboards!) all your data.
And as your networks expand and your organizations scale, Grafana 10 also offers enhanced security, including expanded role-based access control (RBAC) and streamlined SAML authentication.
Ödegaard then provided a preview of the next-gen dashboarding experience: Grafana Scenes, a new frontend library that allows you to build beautiful dashboard experiences right into your products. For more information, check out Grafana Scenes on GitHub or watch the GrafanaCON session “How to build dynamic, customizable dashboards with Grafana Scenes.”
To learn more about the latest version of Grafana, read about the Grafana 10 release on our blog and for a full demo of Grafana 10, watch the “Deep Dive into Grafana 10” GrafanaCON session.
To try out the new features, upgrade your instance or download Grafana 10 today. And if you’re new to Grafana, the easiest way to get started is to sign up for Grafana Cloud, which has a generous forever-free tier and plans for every use case. Get your free account today!
More features added to Grafana Cloud’s free tier
Since we announced the Grafana Cloud “forever-free” tier more than two years ago, we have proudly offered a Cloud Free plan that’s actually useful by including 3 users, 10k metrics, 50GB logs, 50GB traces, 50GB profiles, 500 virtual user hours for k6 load testing, IRM, continuous profiling, infrastructure monitoring, and more.
Today at GrafanaCON, Grafana Labs CEO Raj Dutt announced that the company is adding even more to the Grafana Cloud free tier, including access to all enterprise plugins for data sources such as:
The hosted open and composable observability stack on Grafana Cloud has also recently expanded to include load and performance testing with Grafana Cloud k6, incident response and management with Grafana IRM, continuous profiling with Grafana Cloud Profiles, and turnkey integrations for infrastructure monitoring, such as Kubernetes Monitoring.
You can sign up for your free Grafana Cloud account today. Grafana Cloud is also available across all the major cloud platforms: AWS, Microsoft Azure, and Google Cloud. Additionally, Grafana Labs has partnerships with Tencent Cloud and Alibaba Cloud for managed Grafana offerings in the Asia-Pacific region.
To learn more, watch the GrafanaCON 2023 Opening Keynote address on demand.
Golden Grot Award winners revealed!
The traditional 10-year anniversary gift is tin; however, at Grafana Labs, we decided to celebrate with gold. During the GrafanaCON 2023 keynote, Raj Dutt presented the first ever Golden Grot Awards, which recognize dashboards created by community members.
The winner in the personal category, Nicky Sonnemans, built a public dashboard that provides visibility into energy infrastructure and real-time costs across Europe.

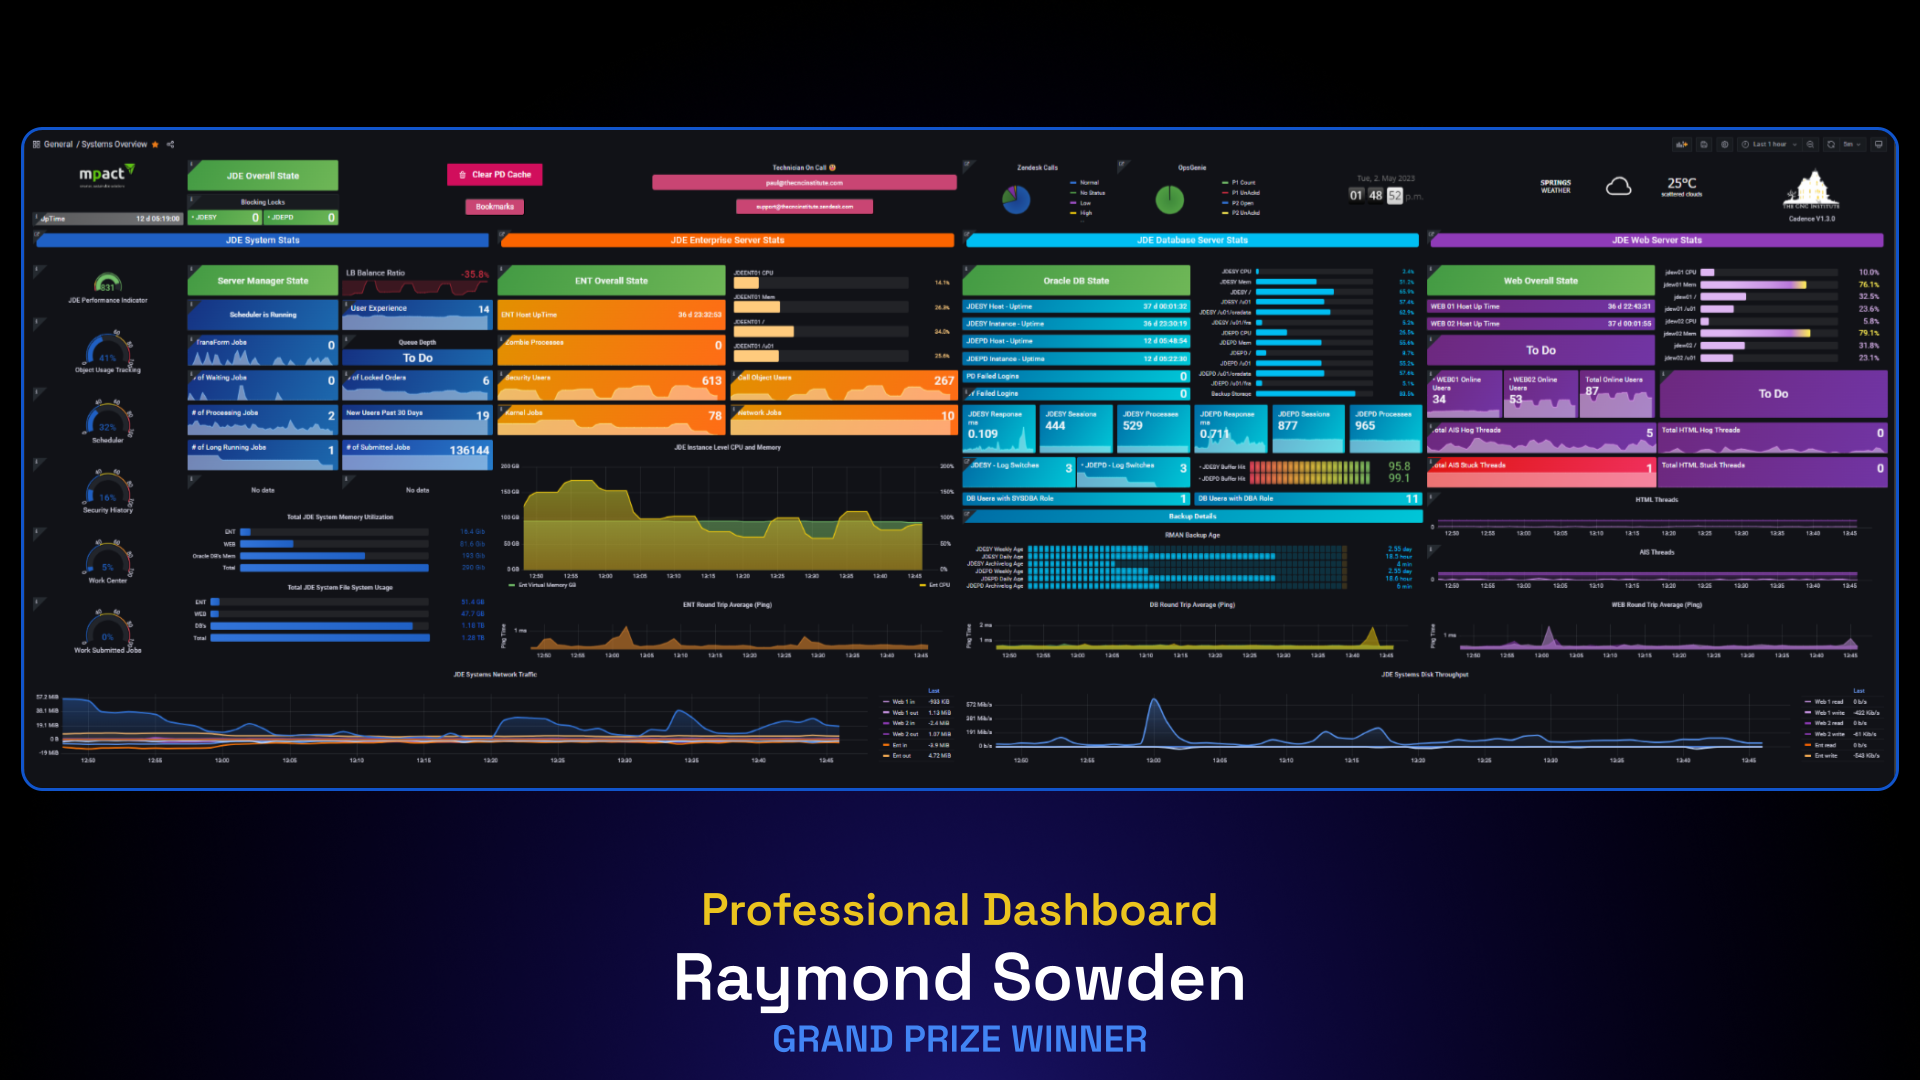
Raymond Sowden, CNC team lead at South Africa-based RadixTrie PTY LTD, topped the professional category for his team’s dashboard, which gives their technicians and customers insights into the overall health and performance of Oracle’s JD Edwards EnterpriseOne ERP.

To learn more, go to the official Golden Grot Awards web page.
For more information about these announcements, read our complete press release about GrafanaCON 2023. You can also watch all of the GrafanaCON 2023 sessions on demand now.


