Easily monitor Docker Desktop containers with Grafana Cloud
18 million — that’s the number of developers around the world who use Docker, the popular tool for containerization. Docker Desktop, a software application for Mac, Windows, and Linux, is one of the most widely used tools within the Docker ecosystem, especially among developers who want to build, test, and deploy applications in containers on their local machines.
For those users, we are excited to announce that Grafana Cloud has launched the first and only monitoring solution for Docker Desktop. The new Docker Desktop solution for Grafana Cloud allows developers and users to monitor metrics and logs for the containers running inside Docker Desktop. Users can also leverage the embedded Grafana Agent inside the Grafana Cloud extension for Docker Desktop to scrape any Prometheus-supported target or enable and use several other Grafana Cloud integrations.
You can easily get started with monitoring your Docker Desktop instance by installing the Grafana Cloud extension available in the Docker Desktop extensions marketplace. Let’s walk through how to set up a Grafana Cloud account and start monitoring your Docker Desktop instance.
How to configure Docker Desktop with Grafana Cloud
The Docker Desktop integration utilizes metrics generated by the open source cadvisor exporter for the Docker engine. We embedded the cadvisor exporter into Grafana Agent, so it is easier for you to run it in your environment and start collecting both metrics and logs from your server with a single agent and configuration.
The Grafana Cloud extension for Docker Desktop has an embedded Grafana Agent instance and a UI that lets you easily configure and connect to Grafana Cloud to start sending metrics and logs.
Please note that in order to install the Grafana Cloud extension, Docker Desktop version 4.8 or higher needs to be installed and the extensions feature has to be enabled in the settings. See the Docker Desktop extensions documentation for more information.
You can start monitoring your Docker Desktop deployment with Grafana Cloud by following these simple steps:
- Sign in to your Grafana Cloud account, which is required to use the Docker Desktop integration. (If you don’t have a Grafana Cloud account, you can sign up for a free today.)
- In your Grafana instance on Grafana Cloud, use the left-hand navigation bar to find the Connections Console (Home > Connections > Connect data).
- Install the Docker Desktop integration. Follow the steps to install the Grafana Cloud extension in Docker Desktop and start collecting logs and metrics from it. Please refer to our how to install and manage integrations documentation for more information. For details around configuring the extension for this integration, refer to our Docker Desktop integration documentation.

Start monitoring your Docker Desktop instance
After the integration is installed, the Docker Desktop extension will start sending metrics and logs to Grafana Cloud.
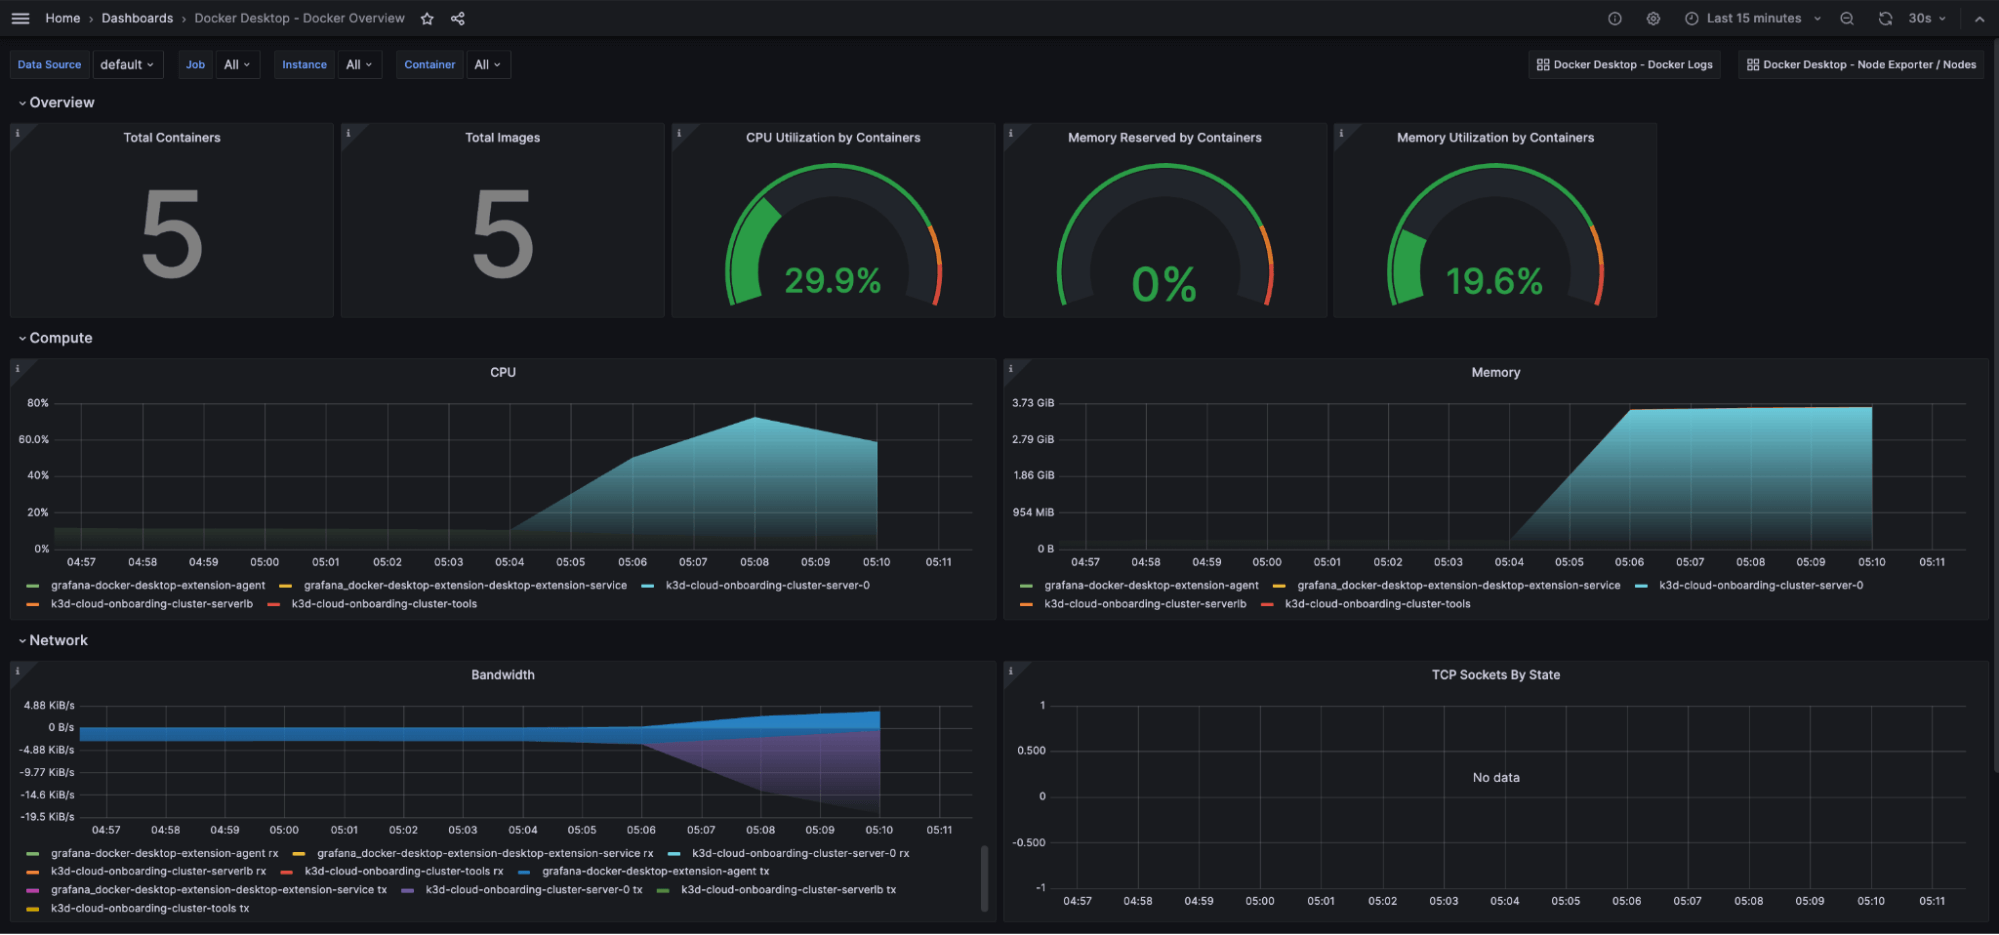
You will see three prebuilt dashboards installed in Grafana Cloud for Docker Desktop.
Docker Overview dashboard
This Grafana dashboard gives a general overview of the Docker Desktop instance based on the metrics exposed by the cadvisor Prometheus exporter.

The key metrics monitored are:
- Number of containers / images
- CPU metrics
- Memory metrics
- Network metrics
It also contains a shortcut at the top for the logs dashboard so you can correlate logs and metrics for troubleshooting.
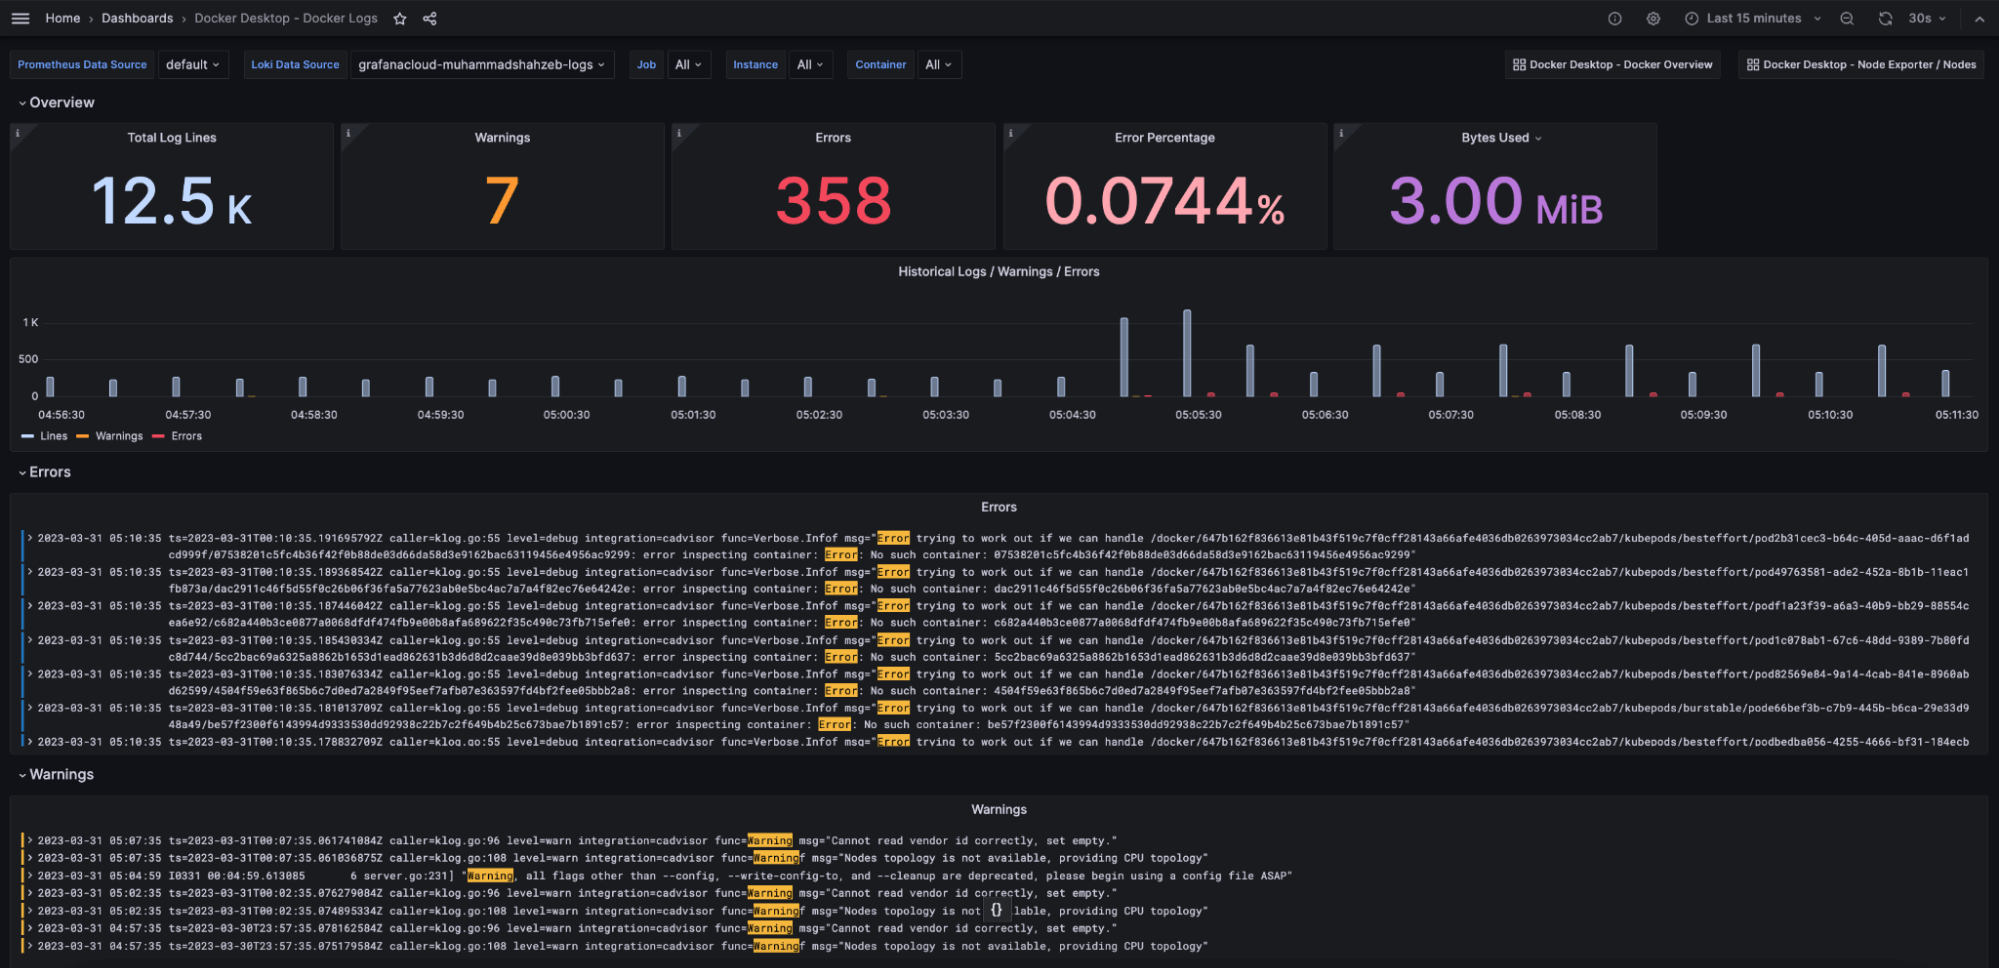
Docker Logs dashboard
This Grafana dashboard provides logs and metrics related to logs of the running Docker containers on the Docker Desktop engine.

Logs and metrics can be filtered based on the Docker Desktop instance as well as the container using the drop-down for template variables on the top of the dashboard.
Docker Desktop Node Exporter / Nodes dashboard
This Grafana dashboard provides the metrics of the Linux virtual machine used to host the Docker engine for Docker Desktop.

The key metrics monitored are:
- CPU metrics
- Memory metrics
- Network metrics
- Storage metrics
How to monitor MySQL in a Docker Desktop container with Grafana Cloud
Since the Grafana Agent is embedded inside the Grafana Cloud extension for Docker Desktop, it can easily be configured to monitor other systems running on Docker Desktop that are supported by the Grafana Agent.
For example, you can monitor a MySQL running inside a container in Docker Desktop using the MySQL integration for Grafana Cloud and the Docker Desktop extension.
Install the MySQL integration on Grafana Cloud by navigating to the Connections Console (Home > Connections > Connect data) and clicking on the MySQL tile.
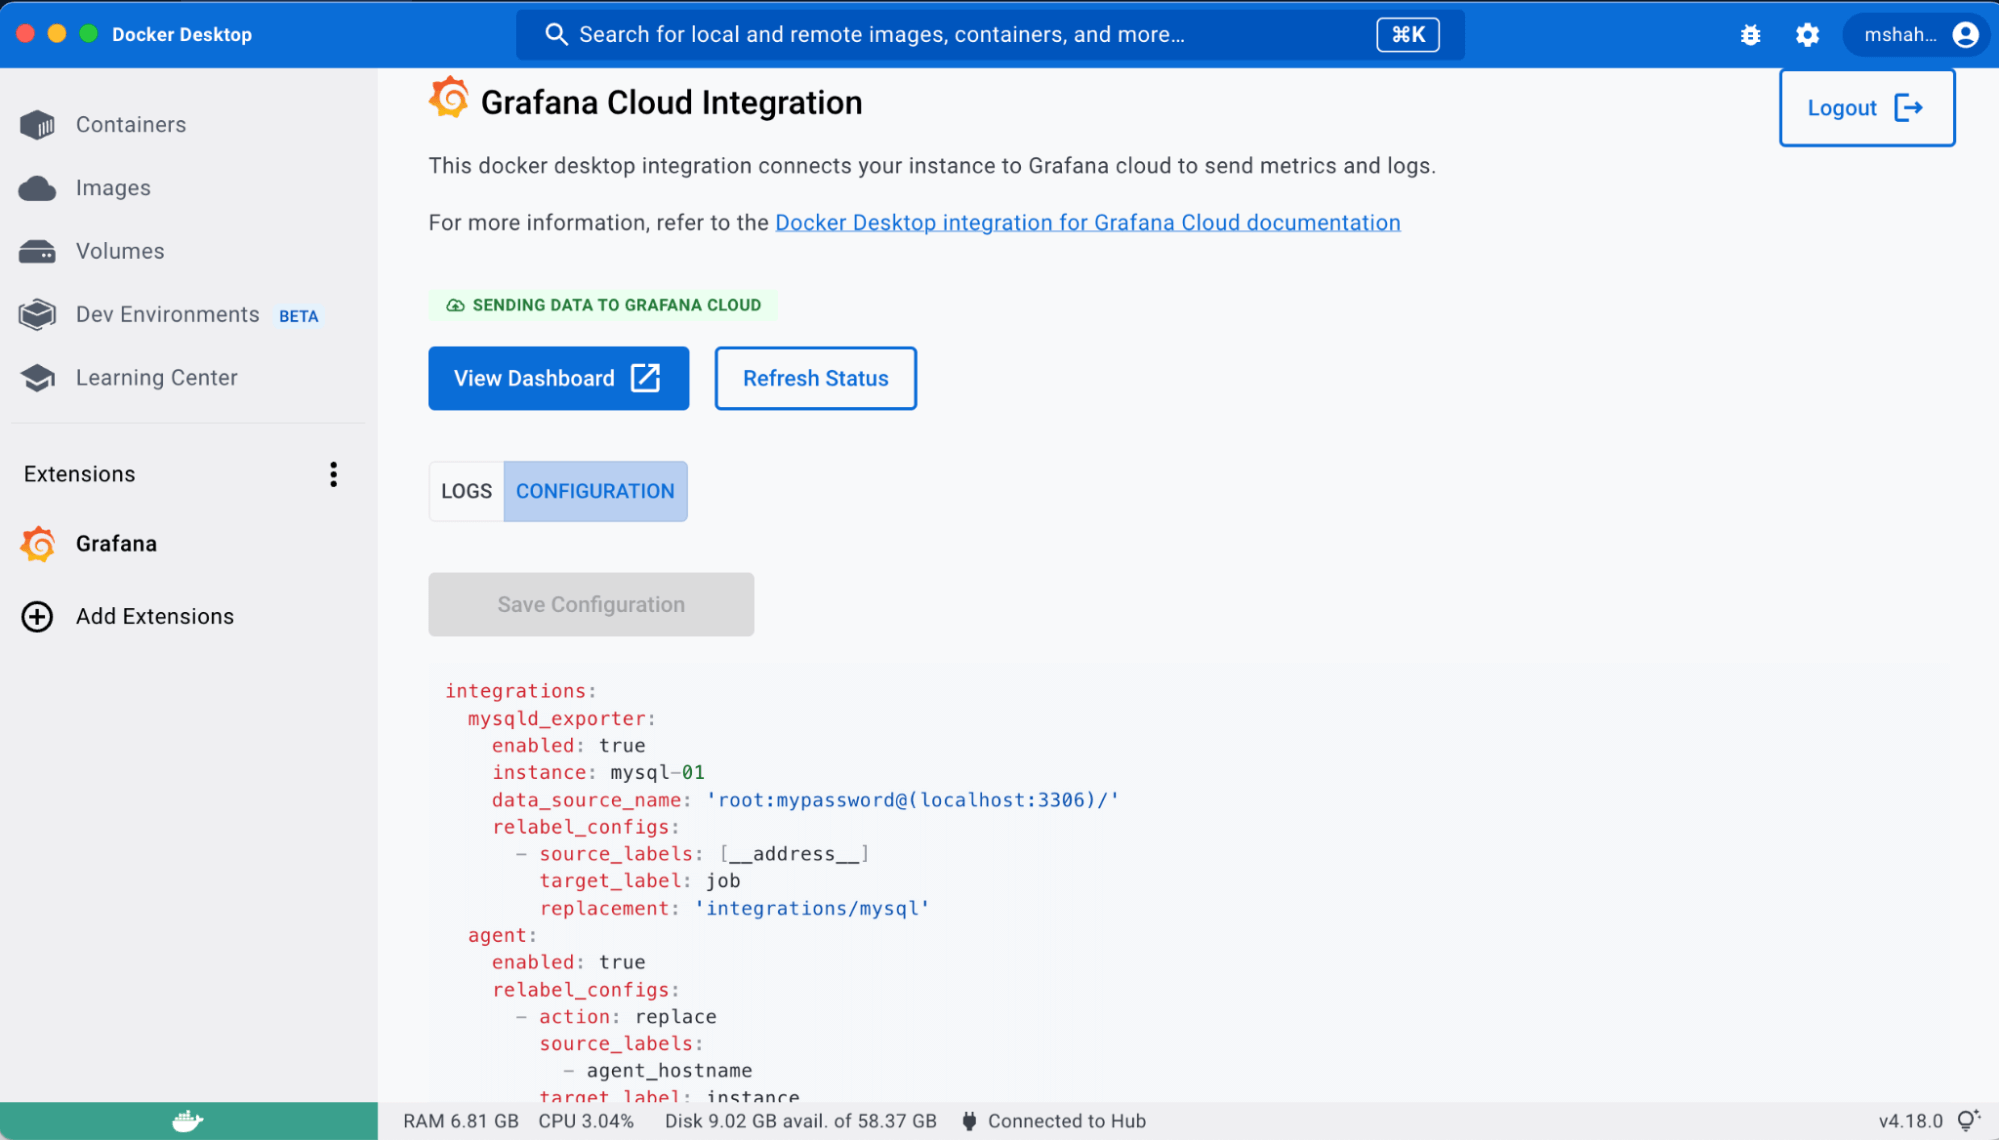
To start collecting metrics from the MySQL server, copy the corresponding agent snippet into our agent configuration in the Docker Desktop extension. Click on Configuration in the Docker Desktop extension and add the following snippet under the integrations key. Then press Save configuration.
mysqld_exporter:
    enabled: true
    instance: mysql-01
    data_source_name: 'root:my-secret-pw@(localhost:3306)/'
    relabel_configs:
      - source_labels: [__address__]
        target_label: job
        replacement: 'integrations/mysql'
In its default settings, the Grafana Agent container is not connected to the default bridge network of Docker desktop. To connect the agent to this container, run the following command:
docker network connect bridge grafana-docker-desktop-extension-agentThis allows the agent to connect and scrape metrics from applications running on other containers.

Now you will be able to see MySQL metrics on the dashboard installed as part of the MySQL integration for Grafana Cloud.

The above example only shows how you can enable metrics for the MySQL instance. But, by using this method, you can also configure logs as well as any other Grafana Cloud integration leveraging the Grafana Agent inside the extension.
Learn more about the Docker Desktop and Grafana Cloud
The prebuilt Grafana dashboards and alerts available in the Docker Desktop integration can help you get your monitoring up and running in an easy way.
Give our Docker Desktop integration a try, and let us know what you think! You can reach out to us in our Grafana Labs Community Slack in the #Integrations channel.
Grafana Cloud is the easiest way to get started with metrics, logs, traces, and dashboards. We have a generous forever-free tier and plans for every use case. Sign up for free now!


