Introducing powerful APIs and webhooks for Grafana Incident
Grafana Incident, Grafana’s powerful incident response tool, comes with a range of integrations out of the box, including Zoom and Google Meet spaces, GitHub and JIRA issues, and even a Google Doc template for post-incident review documents.
However, every team has unique needs and workflows, and you may need to integrate with other systems not currently on our roadmap or even use your own in-house tools. That’s why we’re excited to announce a range of API options that allow you to integrate with almost anything, so you can fine-tune your workflow and automate even more of your incident response and management (IRM) process.
Overview of API and Webhooks
Our API and webhooks aim to enable engineering teams to integrate them seamlessly into their workflows. And while the possibilities are potentially endless, it can help to see some concrete examples of how this works.
This new update addresses several popular use case we get asked about a lot, including how to use:
- The JSON/HTTP RPC API for low-level programmatic control over your incidents, activity timeline, tasks, and more.
- Outgoing webhooks to trigger workflows in third-party systems when specific events occur
- Incoming webhooks let you declare an incident detected in a third-party system
For the remainder of this blog, we’ll walk through several specific examples of how you can use our API and webhooks. You can either start using these examples in your own workflows today or use them as inspiration for your own specific needs.
Use case 1: Post an update to an incident using the API
The JSON/HTTP RPC API gives you low-level programmatic control, which is ideal if you want to build custom integrations or automate complex workflows. For example, you can use the API to create incidents, add tasks, and update the activity timeline.
Let’s explore a real-world example of how to use the API. (Alternatively, you can jump right into the documentation to learn about the API, or even browse the reference material.)
To programmatically post a message to an incident, you can write code to make an HTTP POST request to the API.
For example, using the curl command, you could have code like this as part of a script:
“https://your-stack.grafana.net/api/plugins/grafana-incident-app/resources/api/v1/ActivityService.AddActivity” \
  --request POST \
  --header 'Content-Type: application/json; charset=utf-8' \
  --header 'Authorization: Bearer glsa_HOruNAb7SOiCdshU9alkrqF...' \
  --data '{
"incidentID":"incident-123",
"activityKind":"userNote",
"body":"Some interesting insights from a third-party system"
  }'
To explain this command, we’ll go step-by-step:
- curl is the command.
- The URL is the API endpoint for your instance, including the
ActivityService.AddActivityservice and method. - --request POST tells it to make a POST request.
- --header flags set the Content-Type and Authorization headers — you should use the Bearer value for the appropriate service account you want to use.
- --data flag sets the JSON body, in this case an AddActivityRequest object that specifies the
activityKindofuserNote, a markdown body, and the ID of the incident to which the note will be added.
The curl command lets you easily add such automation to scripts, but you may also opt to use one of the official client libraries to interact with the API, depending on where your code will run.
Use case 2: Trigger workflows in ServiceNow
Outgoing webhooks can be configured to fire when specific events occur. For example, you can trigger workflows in other systems when an incident is declared in Grafana Incident. This allows you to automate repetitive tasks and streamline your incident response management process.
Lots of teams have a mix of technologies that they need to keep in sync. Our tools integrate neatly into your existing processes. For example, we may want to create an incident in ServiceNow whenever an incident is declared in Grafana Incident. (Alternatively, you can learn more by exploring our docs, starting with how to Configure Outgoing Webhooks.)
Note: You have to be an administrator in Grafana Cloud to configure Outgoing Webhooks.
Step 1. In ServiceNow, create a Scripted REST API
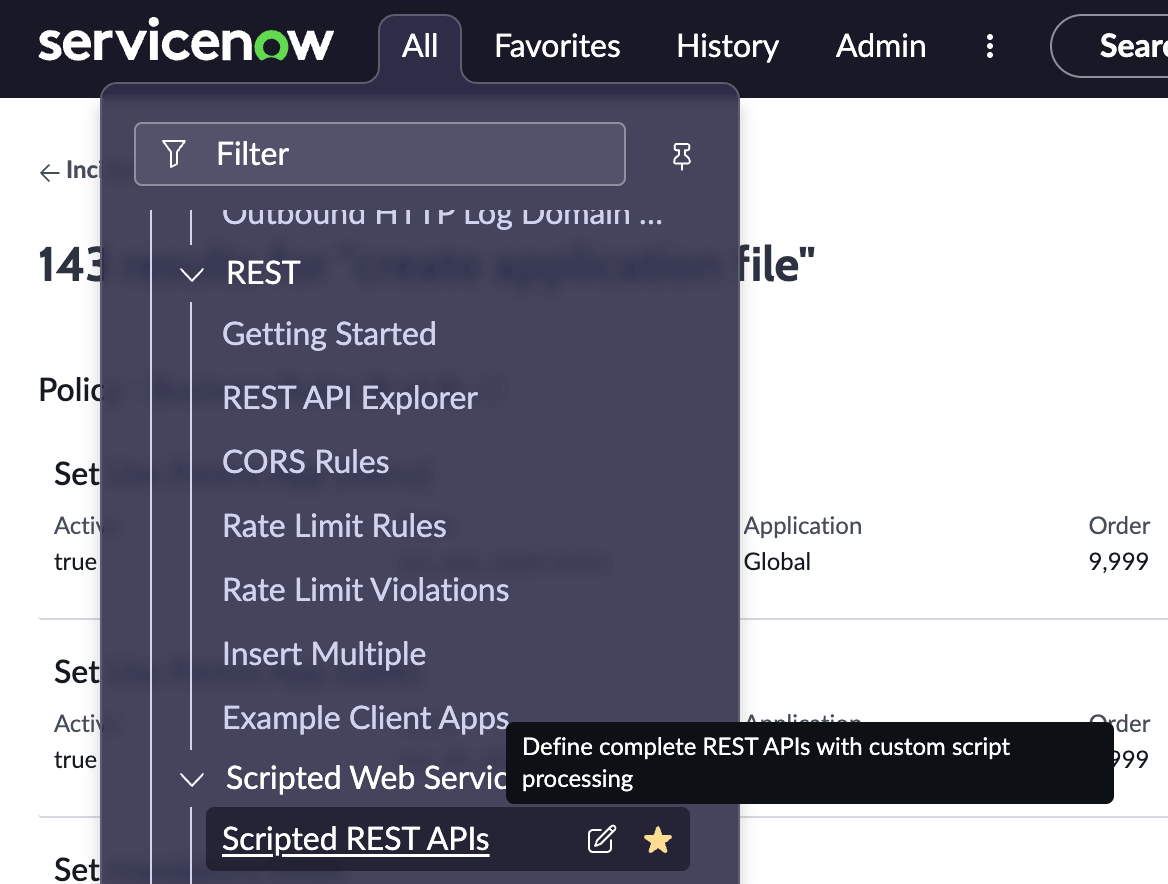
Look for Scripted REST APIs in the navigation in ServiceNow.

For more information, see also the ServiceNow documentation for creating Scripted REST APIs.
Step 2. Create a new service for Grafana Incident
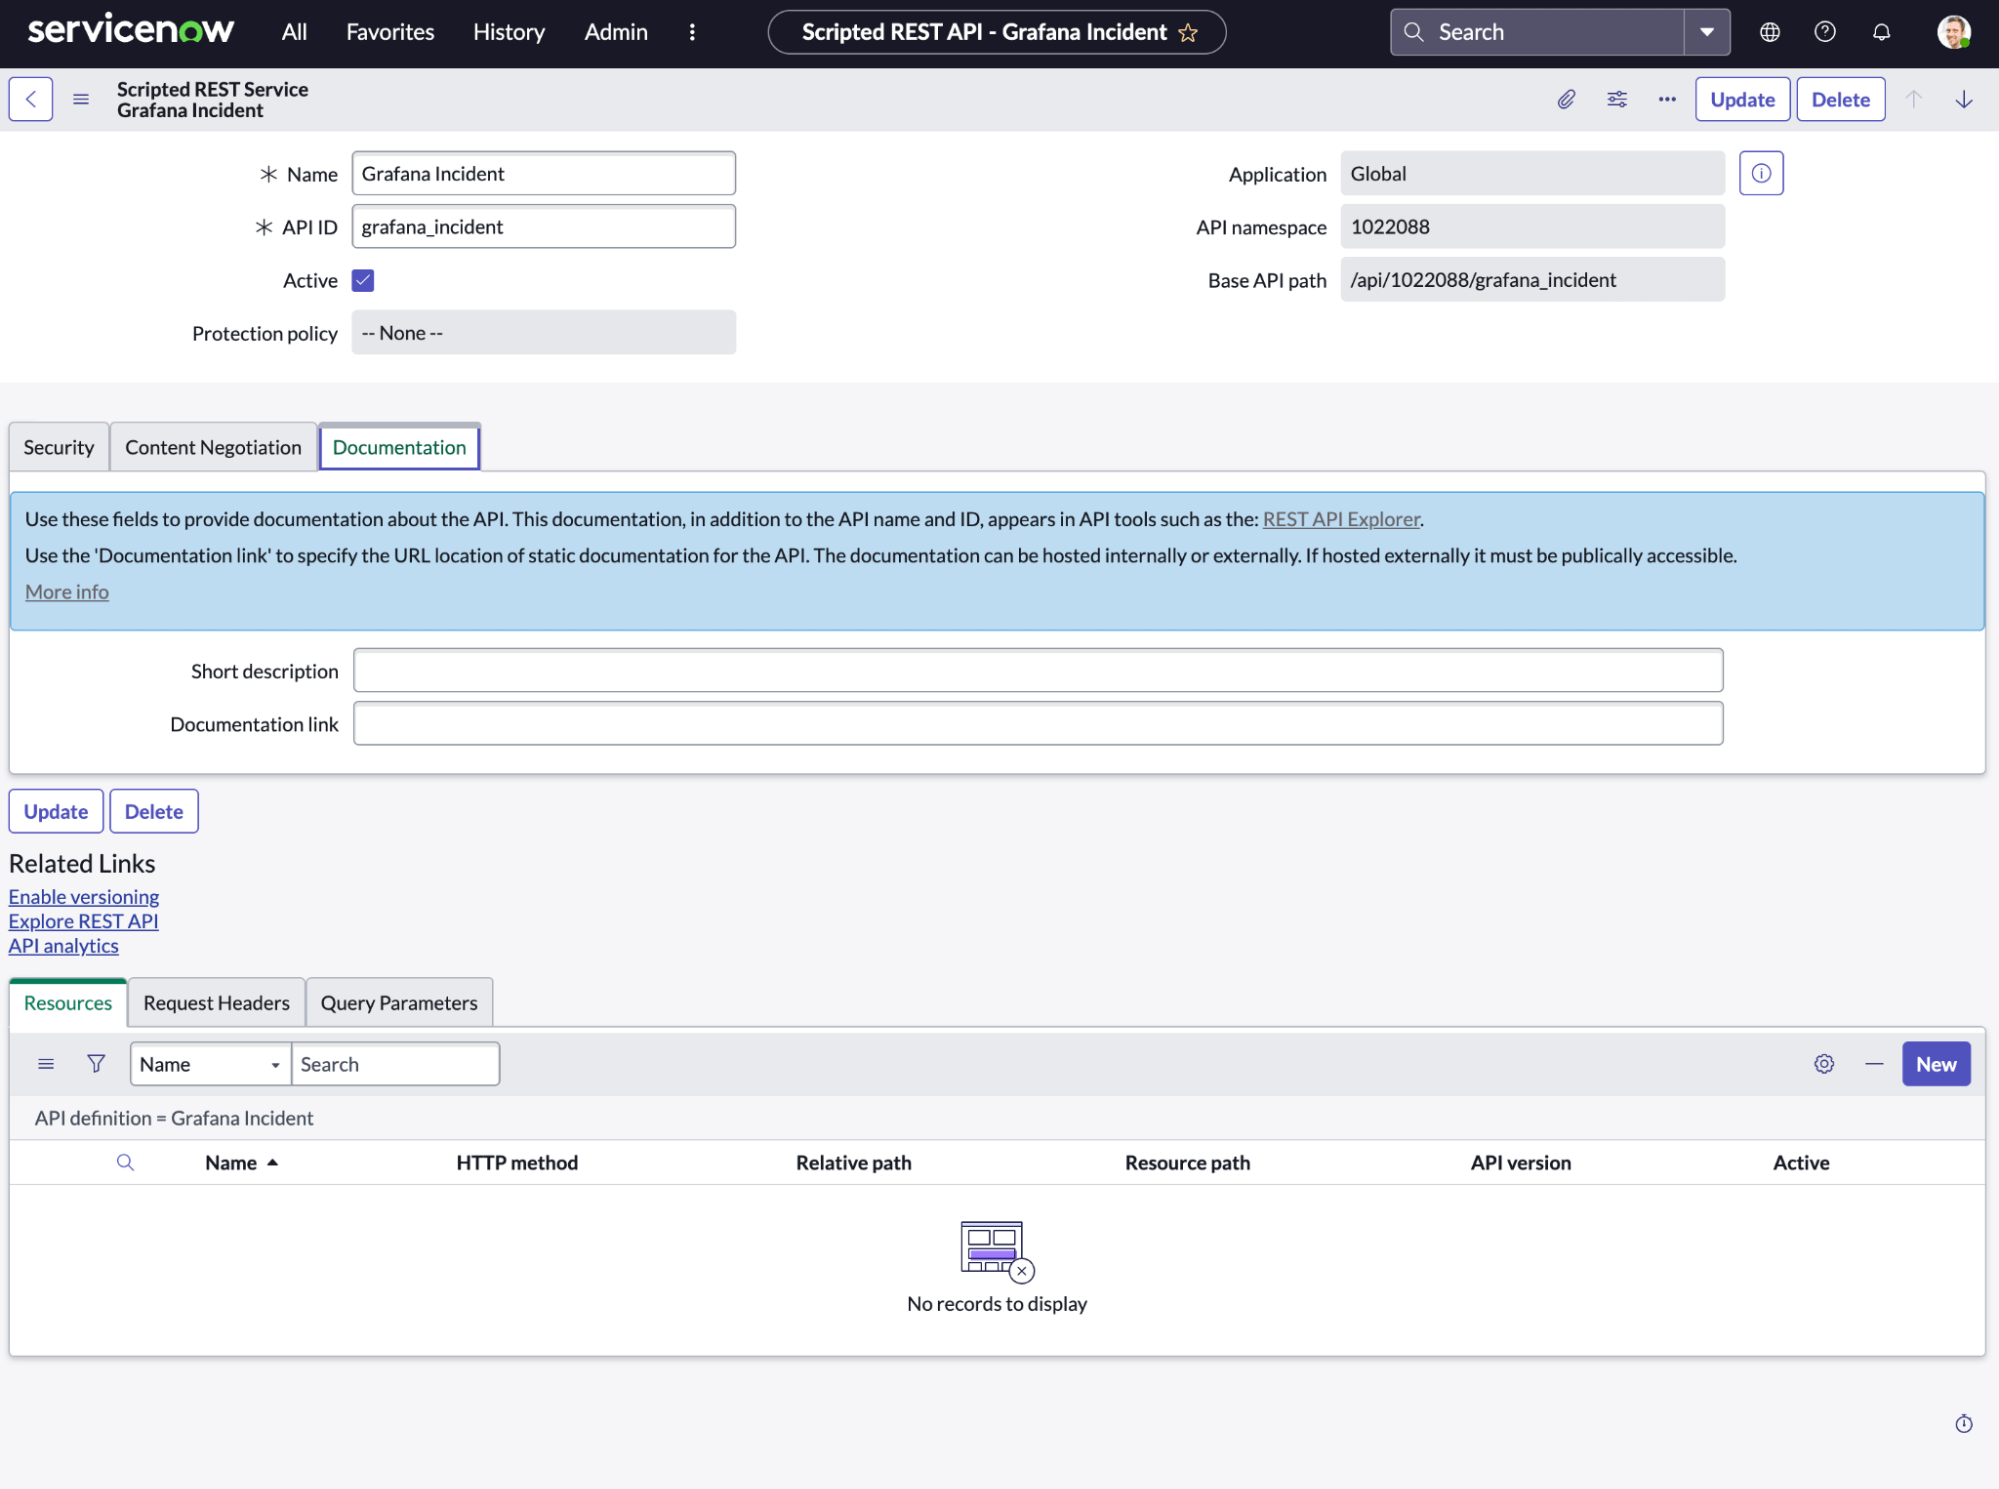
Create a new Scripted REST Service called “Grafana Incident.” This service will handle the webhooks within ServiceNow.

Step 3. Add a /create resource
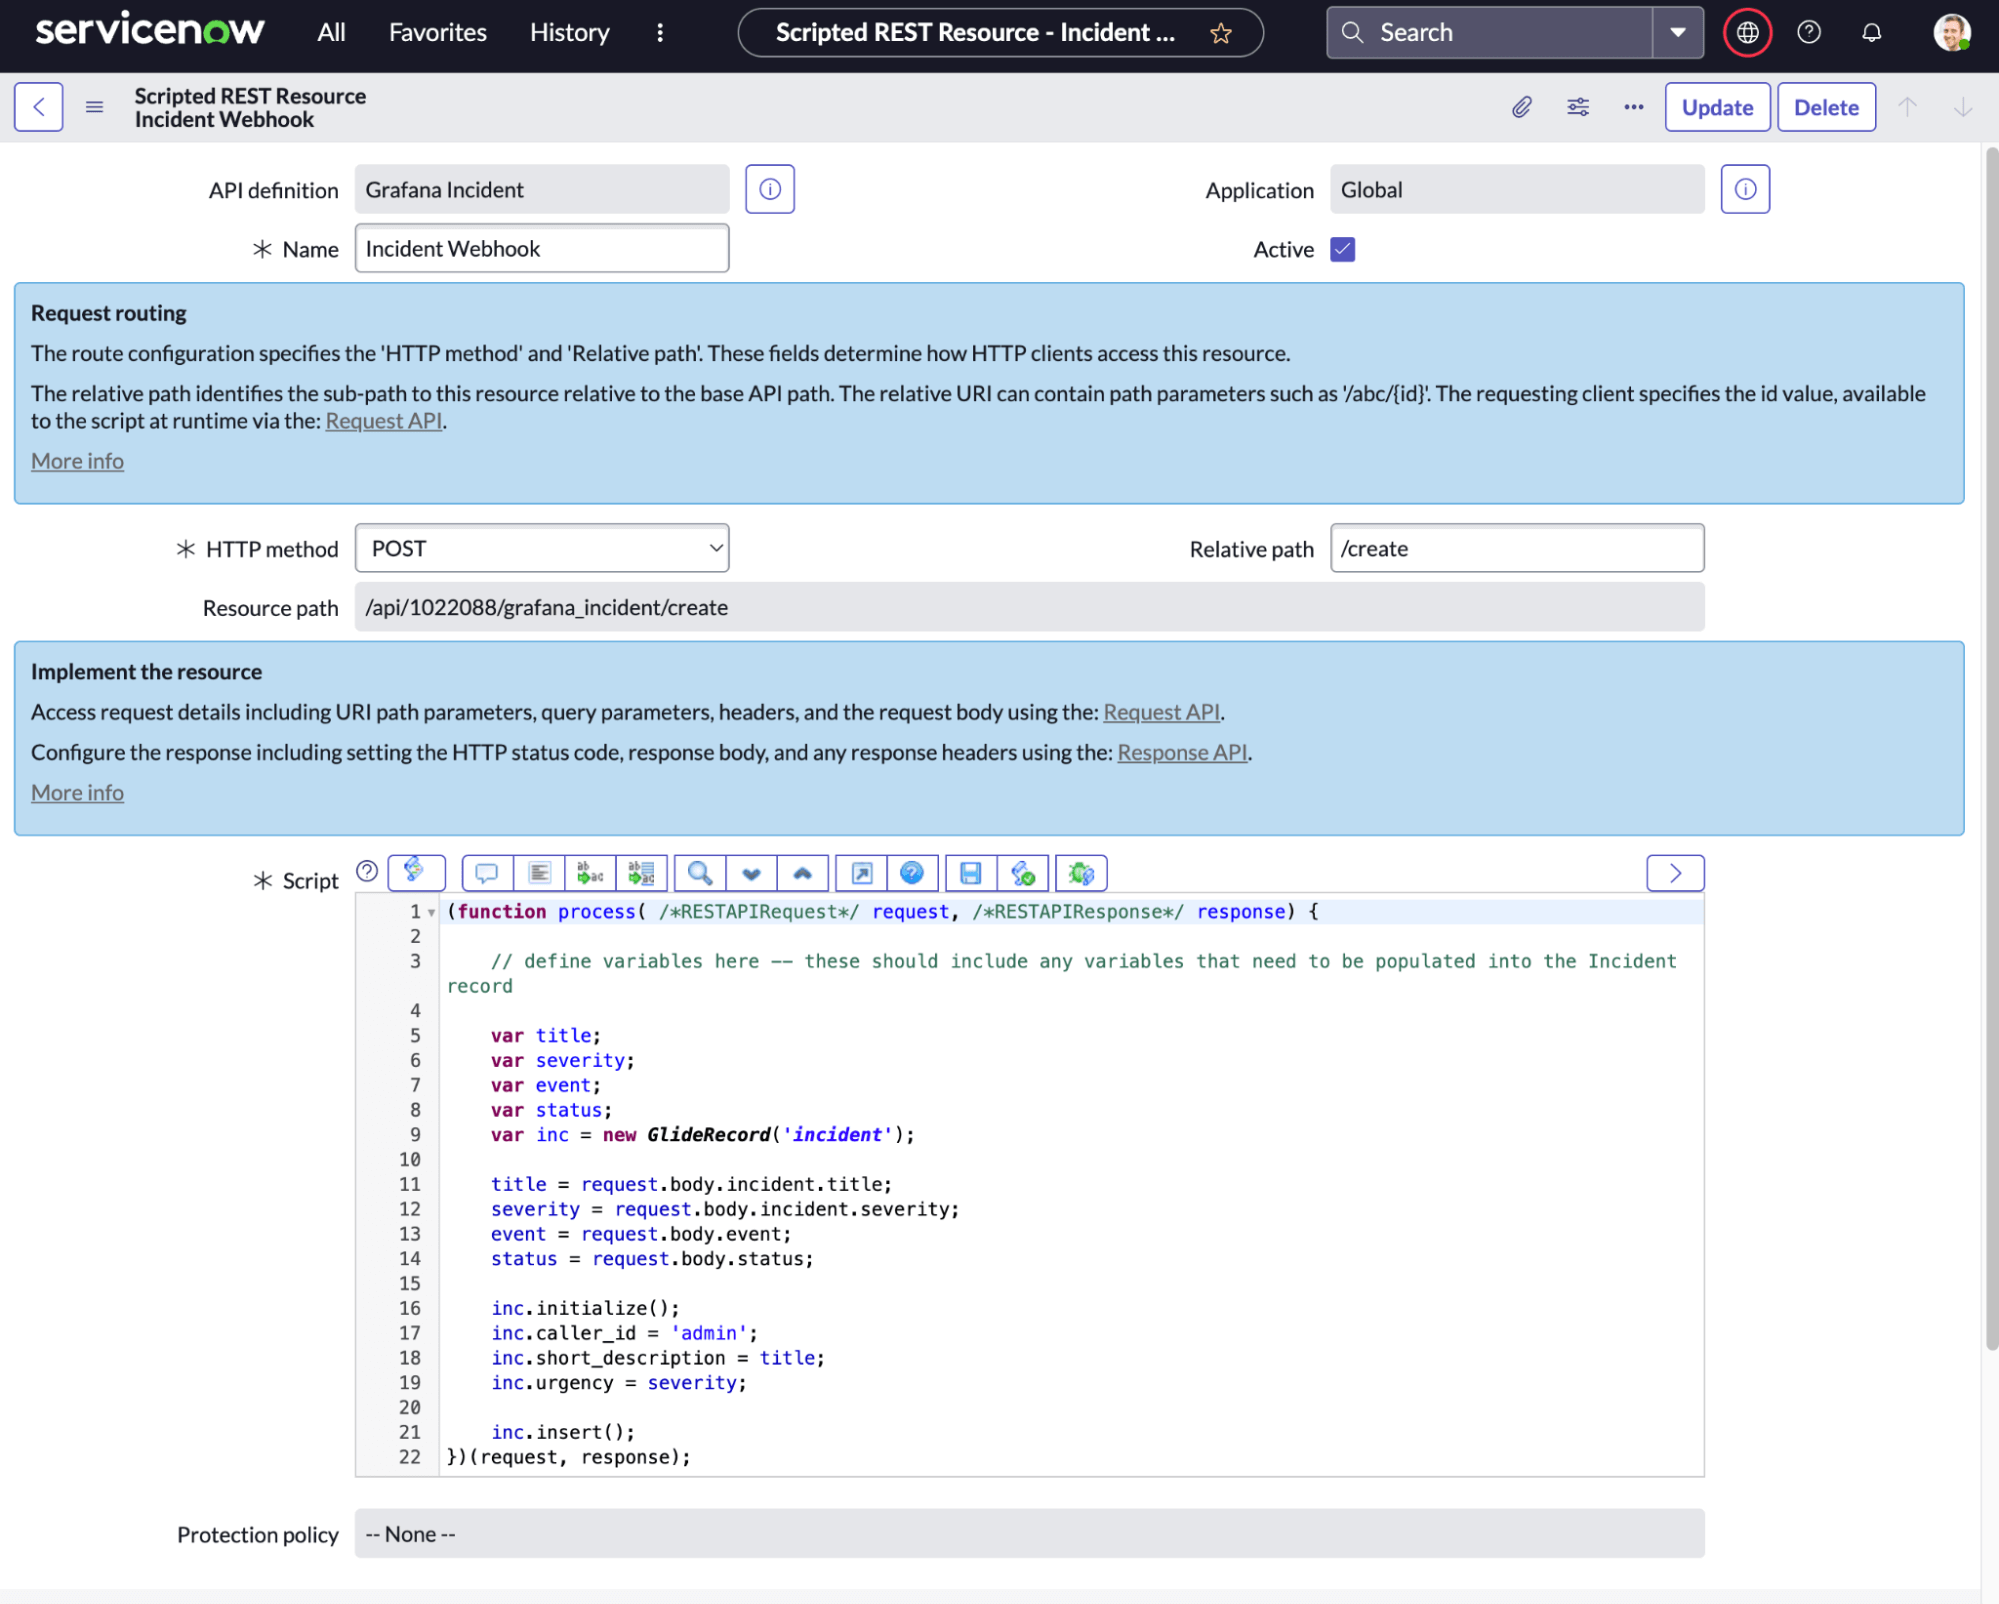
Add a new Scripted REST Resource called “Incident Webhook.” This resource will handle the webhook request coming from Grafana Incident.

Step 4. Configure the Outgoing Webhook in Grafana Incident
Note: Only admins in Grafana Cloud can complete this step.
In the Grafana Incident web interface, head over to Integrations and choose Outgoing Webhook. Click Install Integration and use the + Run when an event fires button to wire this up to when an incident is declared.
The Target URL should be the absolute URL of the /create resource in ServiceNow.
Step 5. Develop and test with the Explore REST API
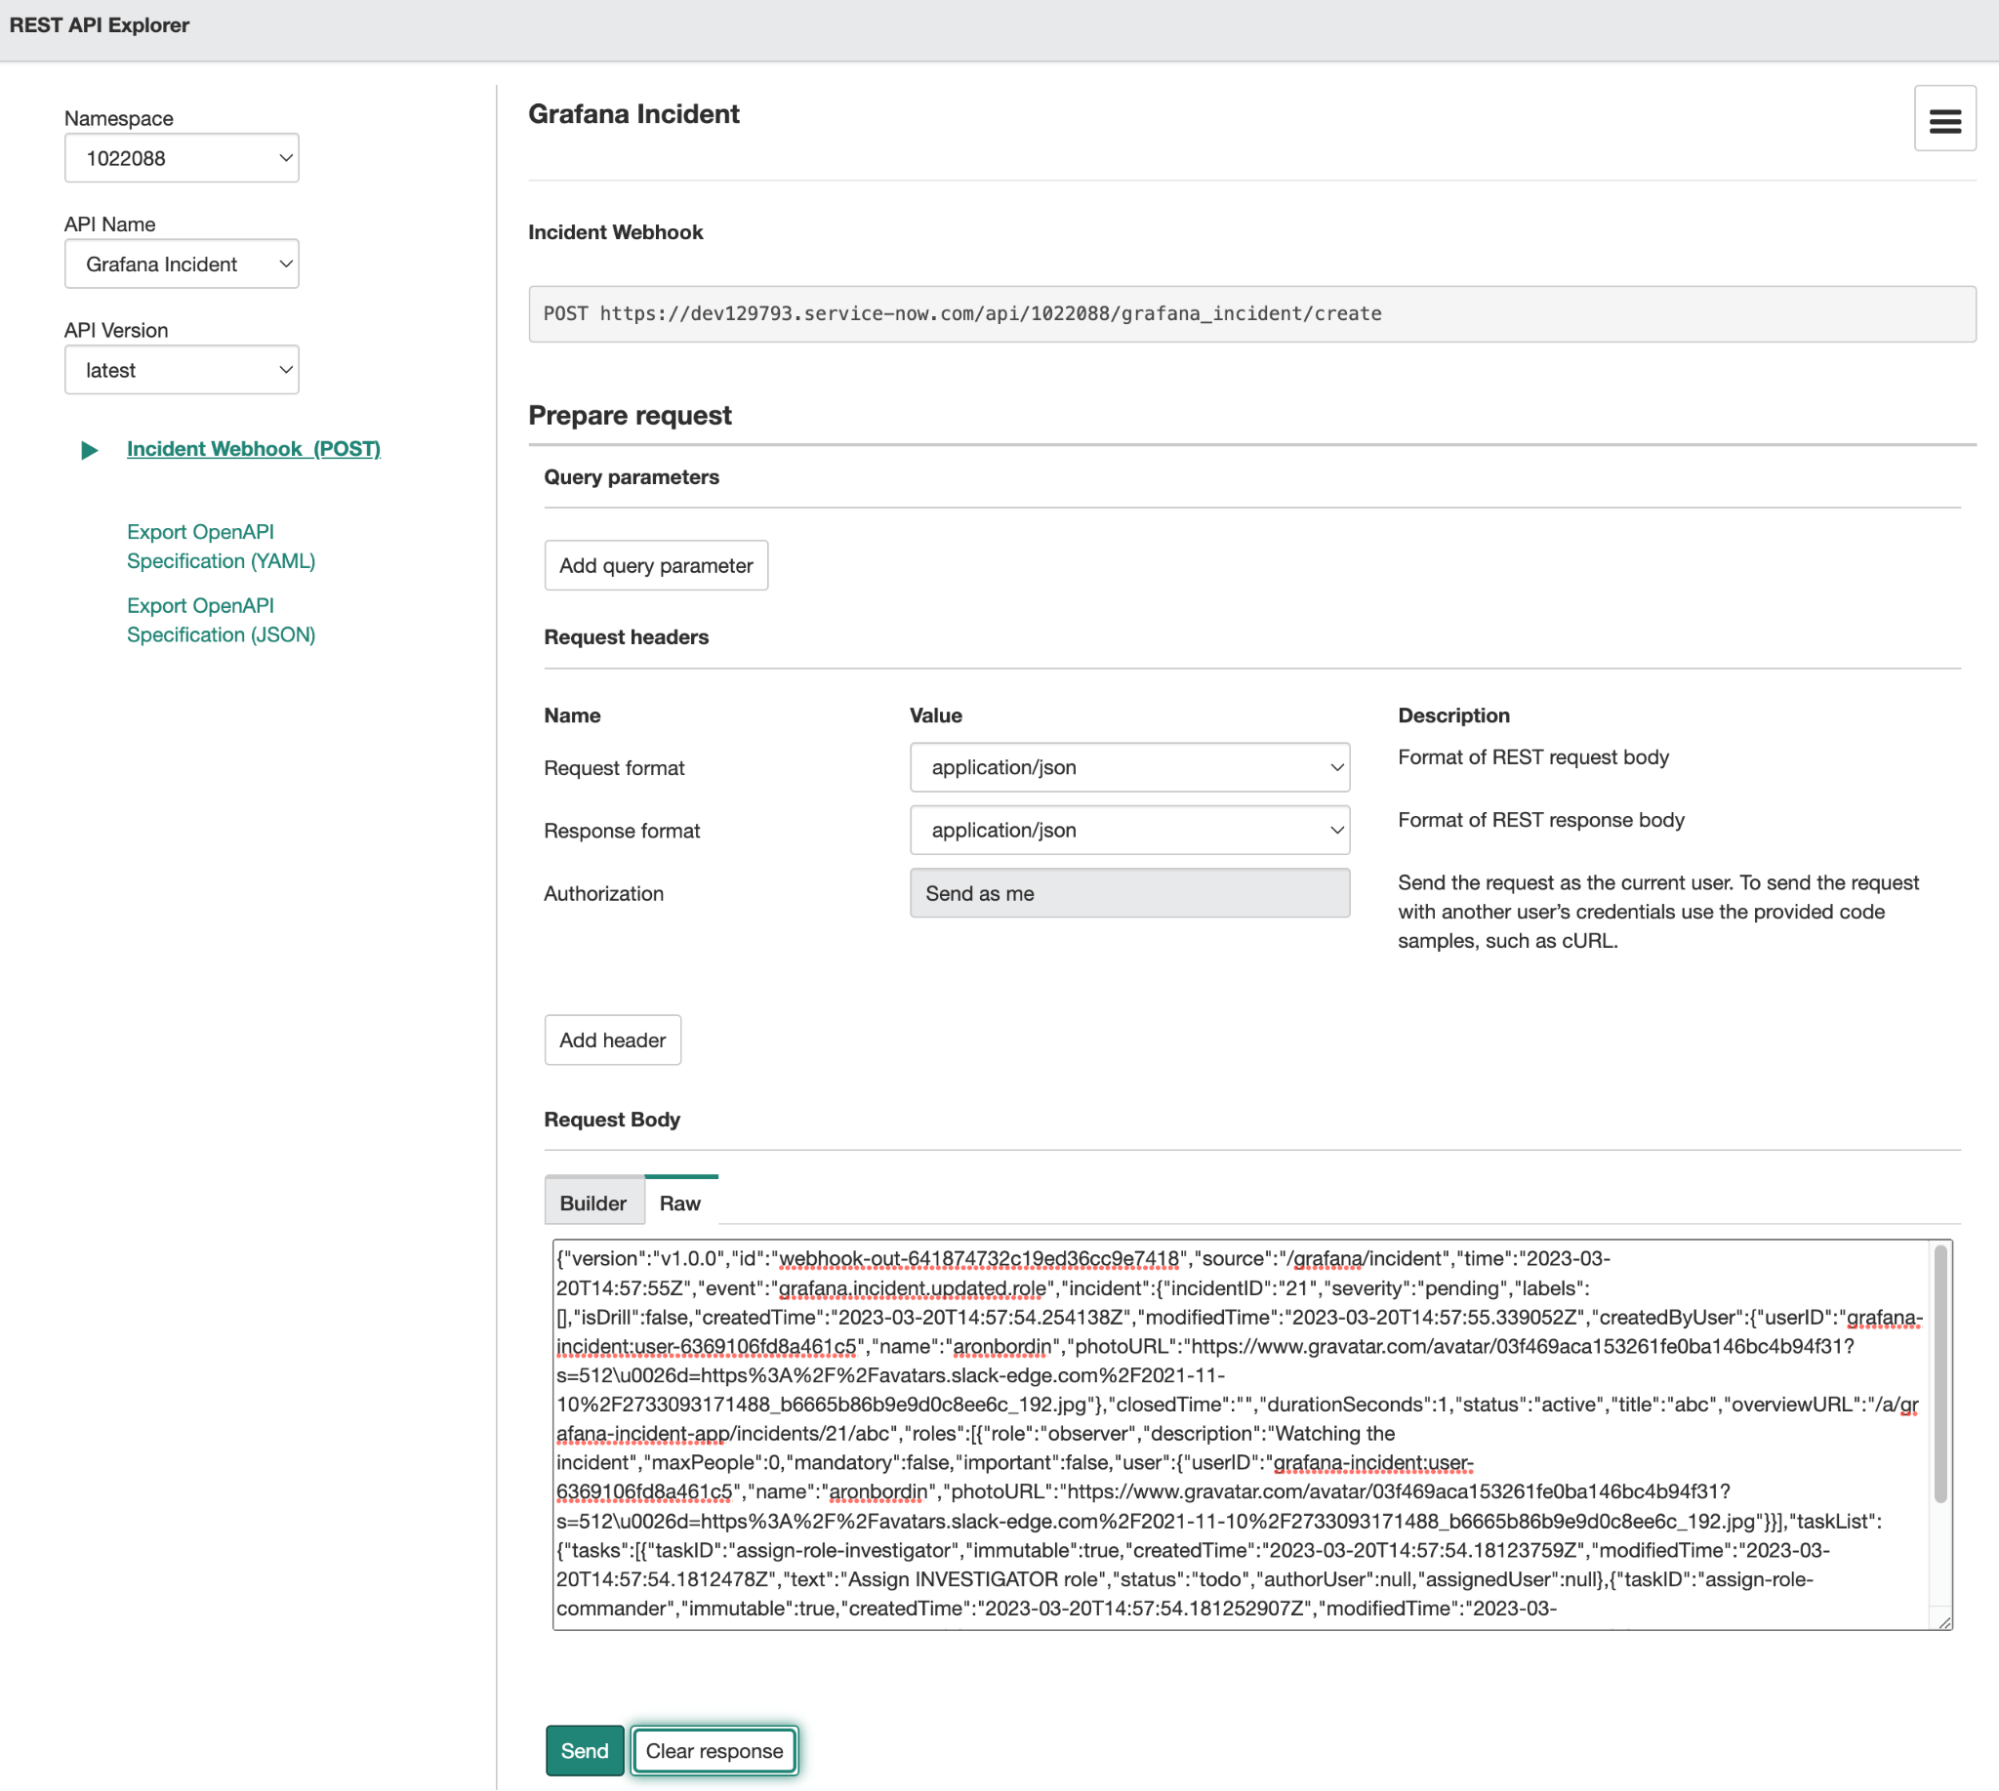
Use the Explore REST API capability to develop and test your handler. You can get an example JSON payload from the Outgoing Webhook Payload reference documentation.

To test your integration, declare a drill incident by either clicking + Drill, or typing “/incident drill something went wrong” in your chat tool.
An incident will be declared (drills are exactly the same as other incidents, but they are hidden from the views and reports by default) and the Outgoing Webhook will fire. You will notice the event in ServiceNow, and that the rest of your workflow has been started.
Use case 3: Trigger an escalation when adding a label to incidents
Labels on incidents can be any string, and some teams use grouped values (a type name before a colon in the format group:value; for example, team:loki or team:mimir) to indicate which components are affected, or which teams are involved.
Using the Outgoing Webhook, we can trigger an event to fire when a specific label is added to the incident.
Step 1. Create the label
If you don’t already have a label you’d like to use, you should create one.
- Go to Incident > Settings.
- Click + Add new label.
- Enter a name. (Tip: Use CAPS to make it distinctive since it will trigger an escalation when it is used.)
Step 2. Create the Webhook integration in OnCall
In order for Grafana OnCall to receive webhooks, you must first enable it to obtain a unique URL.
- Go to OnCall > Integrations.
- Click + New integration to receive alerts.
- Choose Formatted webhook from the list of options.
- Copy the unique webhook URL for use in Step 4.
Step 3. Configure the route in OnCall
When webhooks are sent to that unique webhook URL, we want it to trigger an escalation chain.
- Click Open escalation settings.
- Give your integration a nice name, like
Incident {labelname} -> OnCall routes. - Click + Add Route to create a new route.
- Use the following template script, which writes
Trueif the specified label is found in the list. Remember to replacelabelnamewith the actual label string:
{% for label in payload.incident.labels %}{% if label.label == "labelname" %}True{%endif%}{% endfor %}- Configure the escalation chain to notify the appropriate people.
Step 4. Configure the Outgoing Webhook in Incident
To trigger the escalation, Incident will need to send an Outgoing Webhook to OnCall.
- Go to Incident > Integrations.
- Select Outgoing Webhook.
- Use the + Run when an event fires button to fire the webhook both for when an incident is created and when it changes.
- For the Target URL use the URL provided by OnCall in Step 2.
Step 5. Test it by declaring a drill
Drill incidents will fire webhooks in the same way as real incidents, so you can use them to test the integration.
- Go to Incident.
- Click + Drill to start a new drill incident.
- Use a clear title, like “testing labelname OnCall integration.”
- Add the configured label to the incident.
- Notice the escalation chain fires within OnCall.
More use cases
There are a range of other use cases engineering teams can solve, whether hosted on internal infrastructure or using cloud functions. A small selection of them are explained in this section.
Automatically add tasks when an incident is declared
Use the Grafana Incident API to create a new task list and assign tasks to team members as soon as an incident is declared. This can help ensure that everyone on the team knows what needs to be done to resolve the incident, and can help prevent tasks from falling through the cracks.
By automatically creating a task list when an incident is declared, you can:
- Ensure that everyone on the team knows what needs to be done to resolve the incident, which can help prevent tasks from falling through the cracks.
- Increase efficiency and reduce response times by automating the task creation process.
- Improve collaboration and communication by giving team members a framework of what needs to be done.
If the security label is added to an incident, ping the security team
Use the Grafana Incident API to automatically notify the security team when a security label is added to an incident. This can help ensure that the right people are notified as soon as possible and can take action to address any potential security issues.
By automatically notifying the security team when an incident with the security label is declared, you can:
- Ensure that the security team is quickly informed of incidents that require their attention, which can help minimize the impact of security incidents.
- Reduce incident response time for potential security risks by expediting the notification process and eliminating the need for manual communication.
- Gain greater visibility into the incident response process by tracking which incidents require attention from the security team and how quickly they are notified.
Automatically declare an incident when a specific OnCall alert fires
Use Grafana Incident’s Incoming Webhooks integration to automatically declare an incident when a specific alert fires in Grafana OnCall. By automating the incident declaration process in this way, you can reduce MTTD (mean time to detect) and MTTR (mean time to resolve) for incident-worthy alerts. By taking the decision making burden of whether or not to declare an incident off of the on-call engineer, your team can respond more quickly and effectively to incidents.
Put these features to work to solve your unique problems
Your team has its own workflows and a unique combination of tools, which can make adopting a new tool toilsome. Grafana Incident’s API and webhooks gives you full control over the incident management process, allowing you to integrate with the right tools, to further automate away that toil.
You can get started with the API today by heading over to the Grafana Incident APIs documentation. If you have any questions or would like some help, please get in touch via the Grafana Incident Community GitHub repo.
Grafana Cloud is the easiest way to get started with metrics, logs, traces, and dashboards. We have a generous forever-free tier and plans for every use case. Sign up for free now!


