Monitoring smart cities with Grafana, Timescale, and Sentilo
Miquel is a Project Manager at Seidor Opentrends, focused on smart cities, data, and IoT projects. Seidor Opentrends, which is headquartered in Barcelona and has offices around the world, provides end-to-end, high quality IT transformation services and serves as a consultant on open source and software architecture for municipalities throughout Spain.
At Seidor OpenTrends, we build and maintain Sentilo, an open source sensor and actuator platform for smart cities. As part of that work, we’re always looking for ways to integrate other open source projects that can save us time and money while increasing efficiency for smart cities.
Like piecing together a puzzle, we try to incorporate the right OSS tool that suits each use case as we scale. We initially developed Sentilo in 2012 as a small IoT project in collaboration with the Barcelona City Council. Today, Sentilo is a mature product supported by a diverse community of public and private entities. For example, the Barcelona Sentilo instance manages more than 7.5 million messages every day. Seidor Opentrends maintains Sentilo for several customers, as on-premises deployments, and as SaaS deployments through its spin-off Thingtia. It also maintains the Sentilo Community, with the support of the Barcelona City Council.
As part of that growth, we’ve needed to expand the OSS puzzle that underpins the platform. We recently incorporated Grafana and TimescaleDB, both of which have become important pieces in our smart city solution. In this blog, I’ll explain why a customer request led us to build new customizable visualizations with Grafana that have helped improve a range of processes in smart cities.
Pairing Grafana and TimescaleDB
One of the main objectives of Sentilo is to deliver information to its subscribed modules as fast as possible.These modules are typically other systems or datasources, such as an energy monitoring system or corporate data lake. To accomplish this, data collected by smart city sensors (from vehicles, electric panels, and more) is stored in-memory, which gives us high performance. But memory is expensive. The repository was only temporary; we still needed long-term storage for historical data.
For some of our deployments of Sentilo, users have their own legacy data lakes they use for this, so we have a suite of connectors to different target repositories, including Kafka, Elasticsearch, and the most common relational databases on the market. But this type of setup doesn’t work for everyone, due to the size and cost. So when one of our customers asked us to create their historical repository from scratch and integrate it with their Sentilo platform, we had to evaluate several solutions to provide the right solution for the use case.
We needed something that would help us process information on the fly while still enabling us to explore and discover historical data through a web based interactive visual tool. We had some experience using Grafana for system monitoring and we were aware of its great features and the multiple embeddable datasources. So, after analyzing other options from the market and doing several PoCs, we decided on the following combination:
Timescale. This open source time series database, which is based in PostgreSQL, provides high performance and scalability when working with large amounts of data. It also gives us a well known working environment through SQL.
Grafana. This open source visualization tool has a large suite of powerful dashboards. It also provides interesting features for our use cases, like embedding content, multi-tenancy, and dashboard sharing.
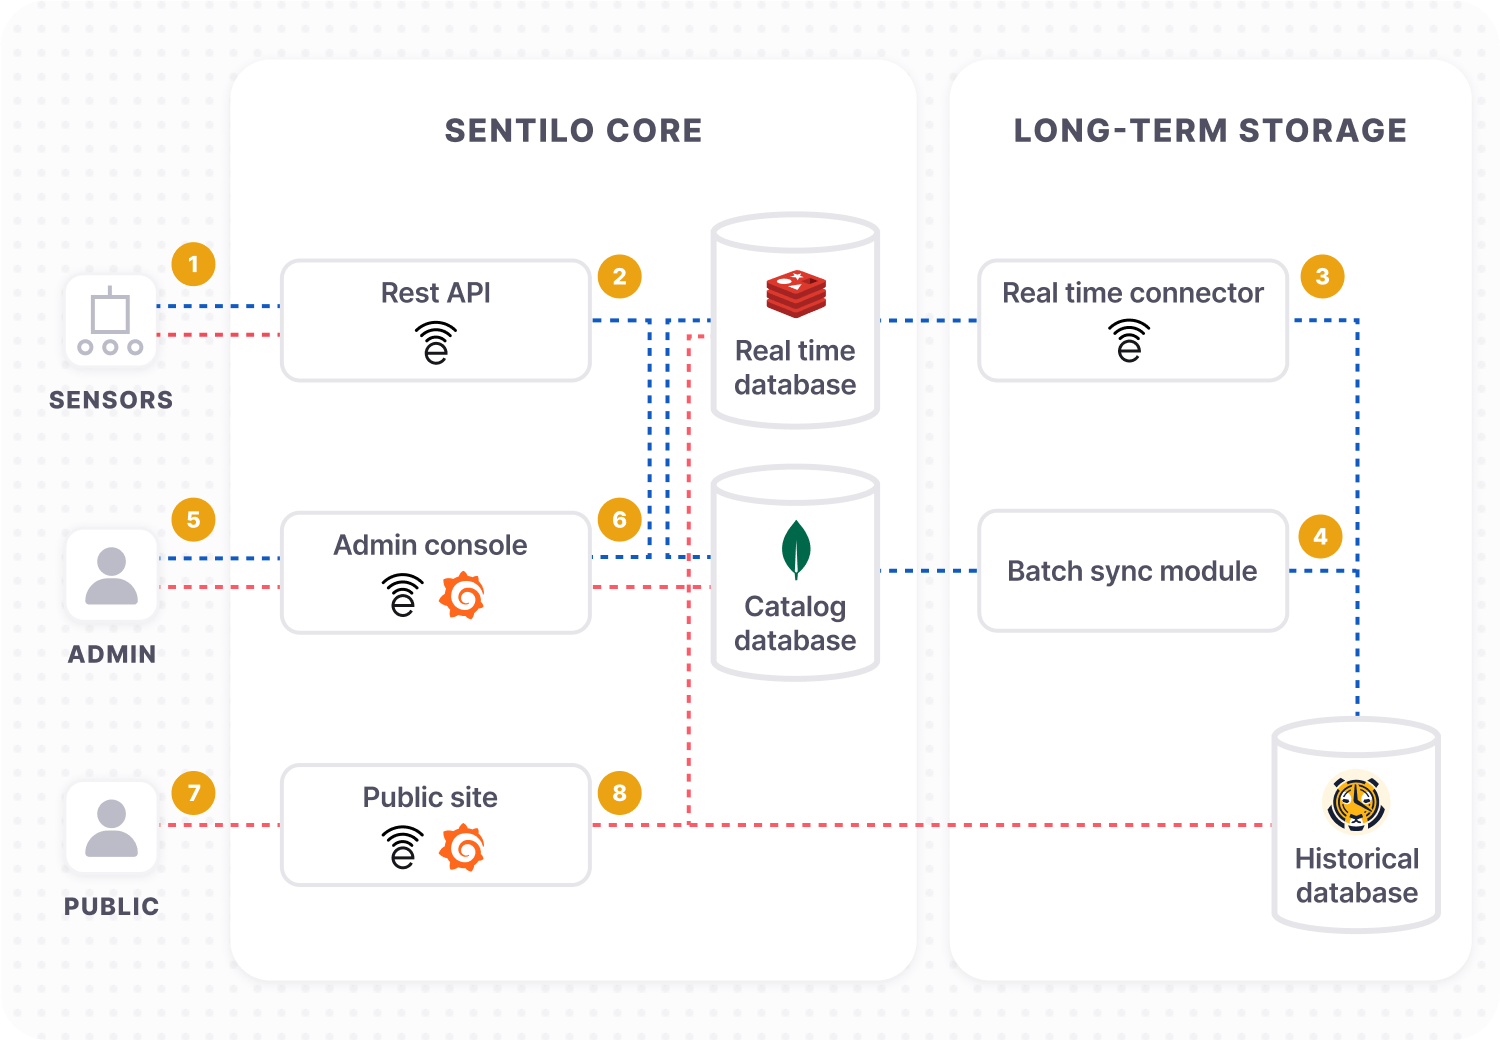
![An architectural diagram shows how the various components of the Sentillo system work together]()
As you can see from the architectural diagram, our smart city platform relies on a mix of databases, sensors, connectors, and Grafana. Here’s a brief description of how those pieces work together:
- Sentilo stores sensor data in two different databases: Redis for real time data and MongoDB for the sensor’s catalog metadata.
- The Sentilo API provides services to interact with the catalog and for publishing the real time data (1). The data is then stored in the corresponding repository (2).
- A custom Sentilo connector, based in a common agent architecture working with Redis streams, receives the data and stores it in TimescaleDB (3).
- The sensor’s metadata is periodically synchronized to the Timescale database using another ad hoc module (4).
- Sentilo provides a web interface for different administration purposes (5). Admins can manage their catalog and visualize the real time data. And with Grafana, users can explore the historical database and build specific dashboards (6).
- Sentilo also includes a web interface focused on citizenship, where any citizens can explore the city map and visualize the sensors and their publicly accessible data.
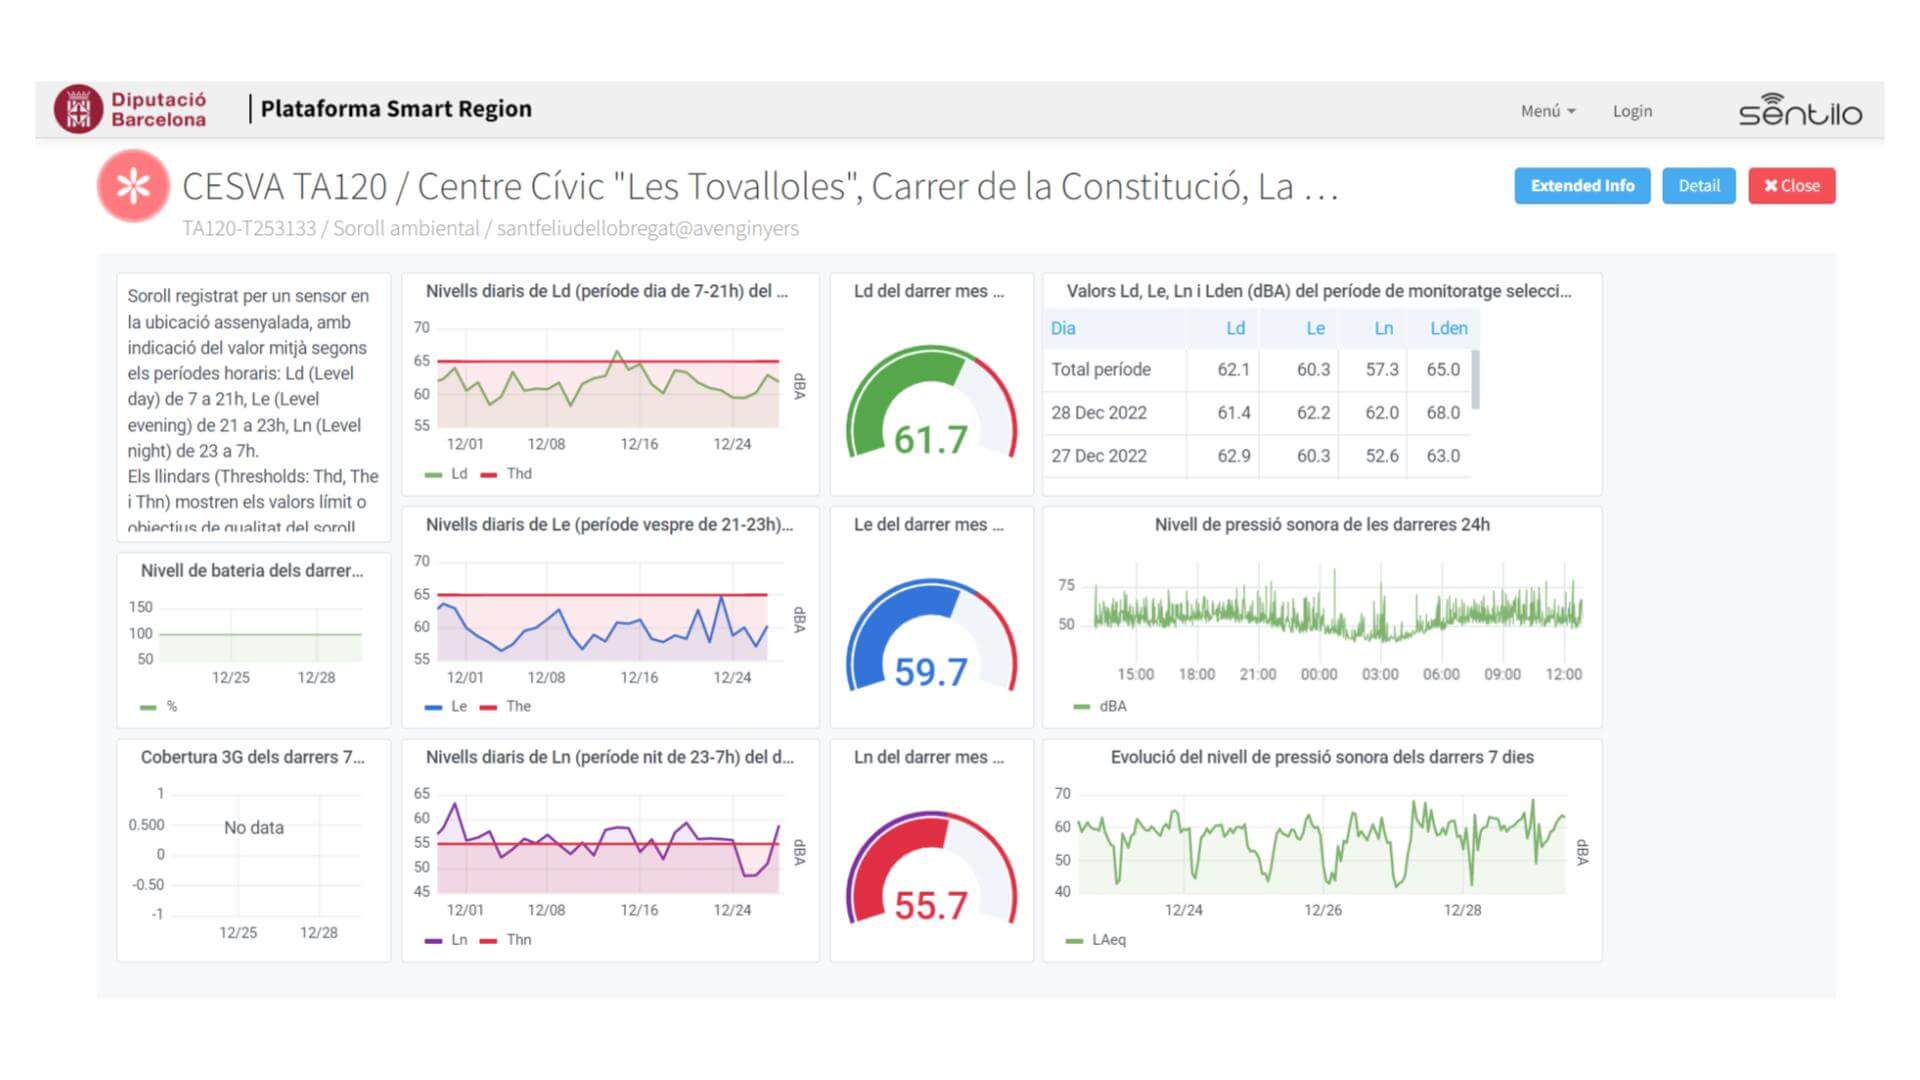
Through Grafana, we are able to deliver richer and interactive visualizations tailored to the specific sector or typology that can be integrated seamlessly into the platform’s public website.
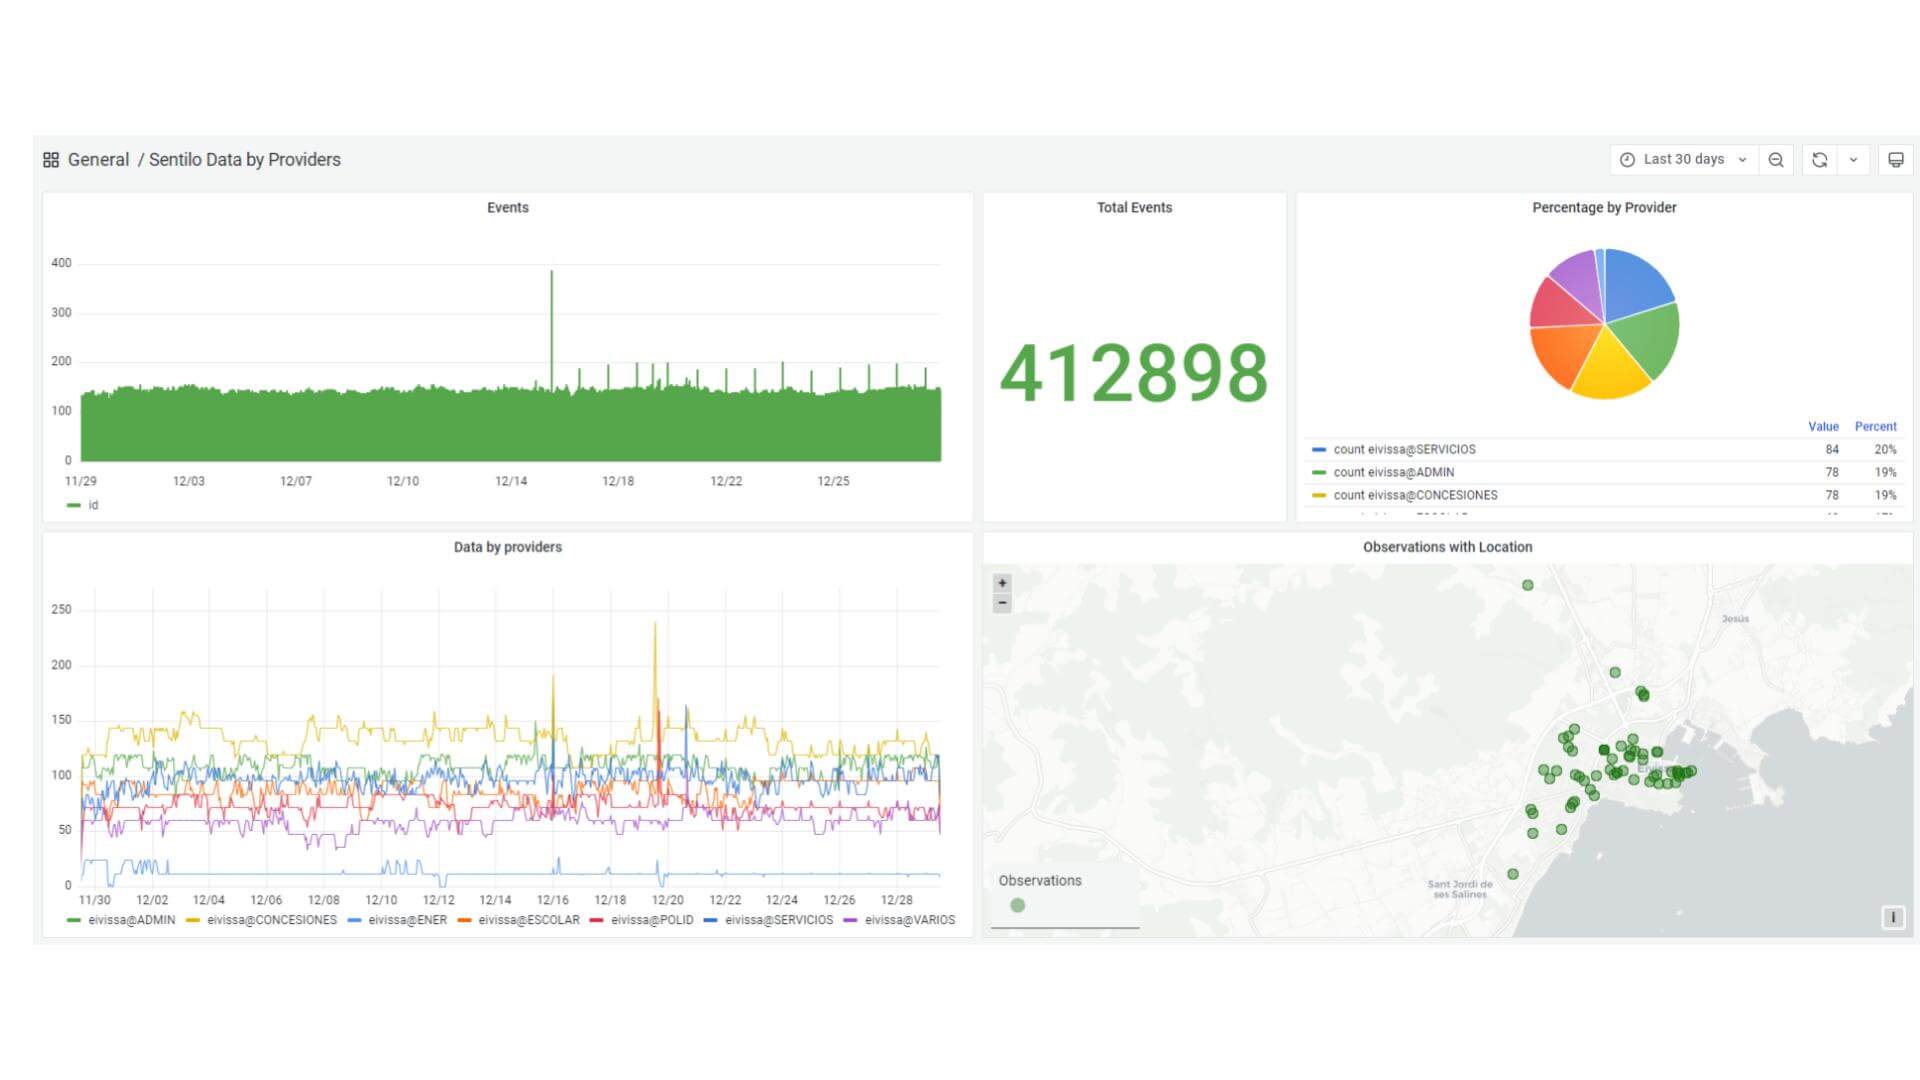
This solution has been implemented for the Sentilo instances of the Barcelona Smart Region and for the Eivissa, Spain, town council through Thingtia. It gives us an interactive search and discovery framework over huge volumes of the data (millions of messages) and wide time frames (years) while still providing great performance.

Grafana dashboards are embedded within the standard Sentilo public visualizer and linked to different sectors: noise monitoring, air quality, irrigation, water fountains, and energy monitoring. Our customers can then build their own powerful dashboards autonomously and share them with other Sentilo community members.

Using Grafana to get value from big data
Of course, you always have to keep in mind that when you work with large amounts of data and filters, you must optimize queries, add indexes, or limit the data the dashboard can manage, especially if those features are open to the public. This is important if you want to keep down costs and provide quick results when executing your queries.
Still, the solution has proven to be a great approach for working with large amounts of data. It has helped us explore and discover data, and we’re able to extract valuable information by combining different sources. It’s also a good way to build powerful dashboards that can be easily embedded in any number of city-specific websites.
If you want more information on how Sentilo works or how you can incorporate it in your own smart city plans, check the community site. You can download it for free, use it as a SaaS, or ask us for a tailor made solution.
Want to share your Grafana story and dashboards with the community? Drop us a note at stories@grafana.com.


