How to monitor Snowflake with Grafana Cloud
Snowflake is a cloud-based data warehousing platform that allows organizations to store, manage, and analyze large amounts of data. It offers a scalable, secure, and highly available solution that separates storage and computing resources.
We already offer the Snowflake datasource plugin, which allows you to query and visualize data from your Snowflake Data Cloud on your Grafana dashboards. And now we’re pleased to announce that Snowflake has a dedicated integration for monitoring usage and billing in Grafana Cloud.
Let’s walk through how to easily set up a Grafana Cloud account and start monitoring your Snowflake Data Cloud!
How to configure Snowflake integration with Grafana Cloud
The Snowflake integration utilizes metrics generated by the open source snowflake-prometheus-exporter project that we developed to support this integration specifically. We’ve also embedded it into Grafana Agent so it is easier for you to run it in your environment and start collecting metrics with a single agent and configuration. To start monitoring your Snowflake Data Cloud with Grafana Cloud, follow these simple steps:
- A Grafana Cloud account is required to use the Snowflake integration. If you don’t have a Grafana Cloud account, you can sign up for a free account today.
- In your Grafana instance on Grafana Cloud use the left-side navigation to get to the Connections Console (Home > Connections > Connect data).
- Install the Snowflake Infrastructure Integration and configure the Grafana Agent to collect logs and metrics from it. Please refer to our documentation on how to install and manage integrations for more information. And for details around configuring Grafana Agent for this integration, refer to the corresponding documentation.
Start monitoring Snowflake
After the integration is installed, you will see two pre-built dashboards for Snowflake and a set of six Snowflake-related alerts automatically installed into your Grafana Cloud account.
Snowflake Overview Dashboard
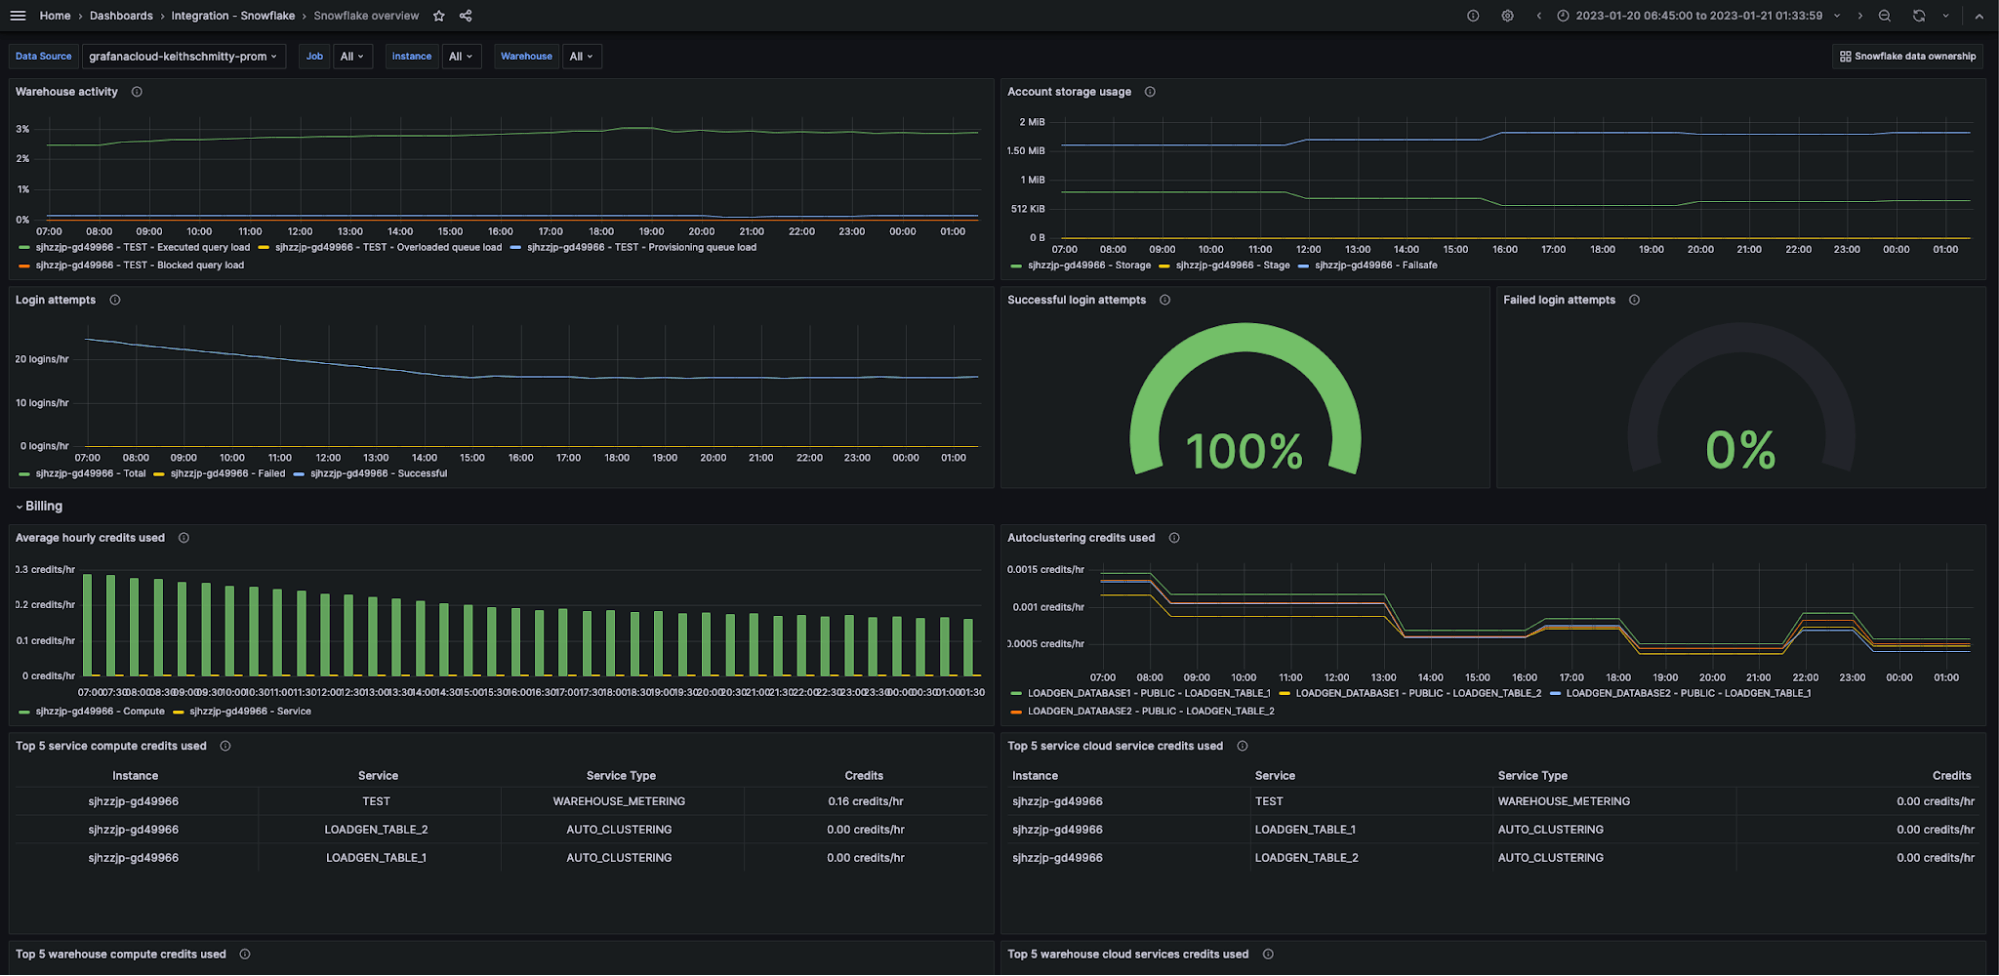
The Snowflake Overview dashboard gives a high-level view of your Snowflake Data Cloud based on the metrics exposed by the Snowflake exporter embedded in the Grafana agent.
Here you can observe the status of your account at a glance with information such as warehouse activity, storage usage, login attempts, hourly credit usage, and a breakdown of billing by compute and service credits.

The key metrics monitored are the following:
snowflake_warehouse_executed_queriessnowflake_warehouse_blocked_queriessnowflake_login_ratesnowflake_failed_login_ratesnowflake_used_compute_creditssnowflake_used_cloud_services_creditssnowflake_warehouse_used_cloud_service_credits
Snowflake Data Ownership Dashboard
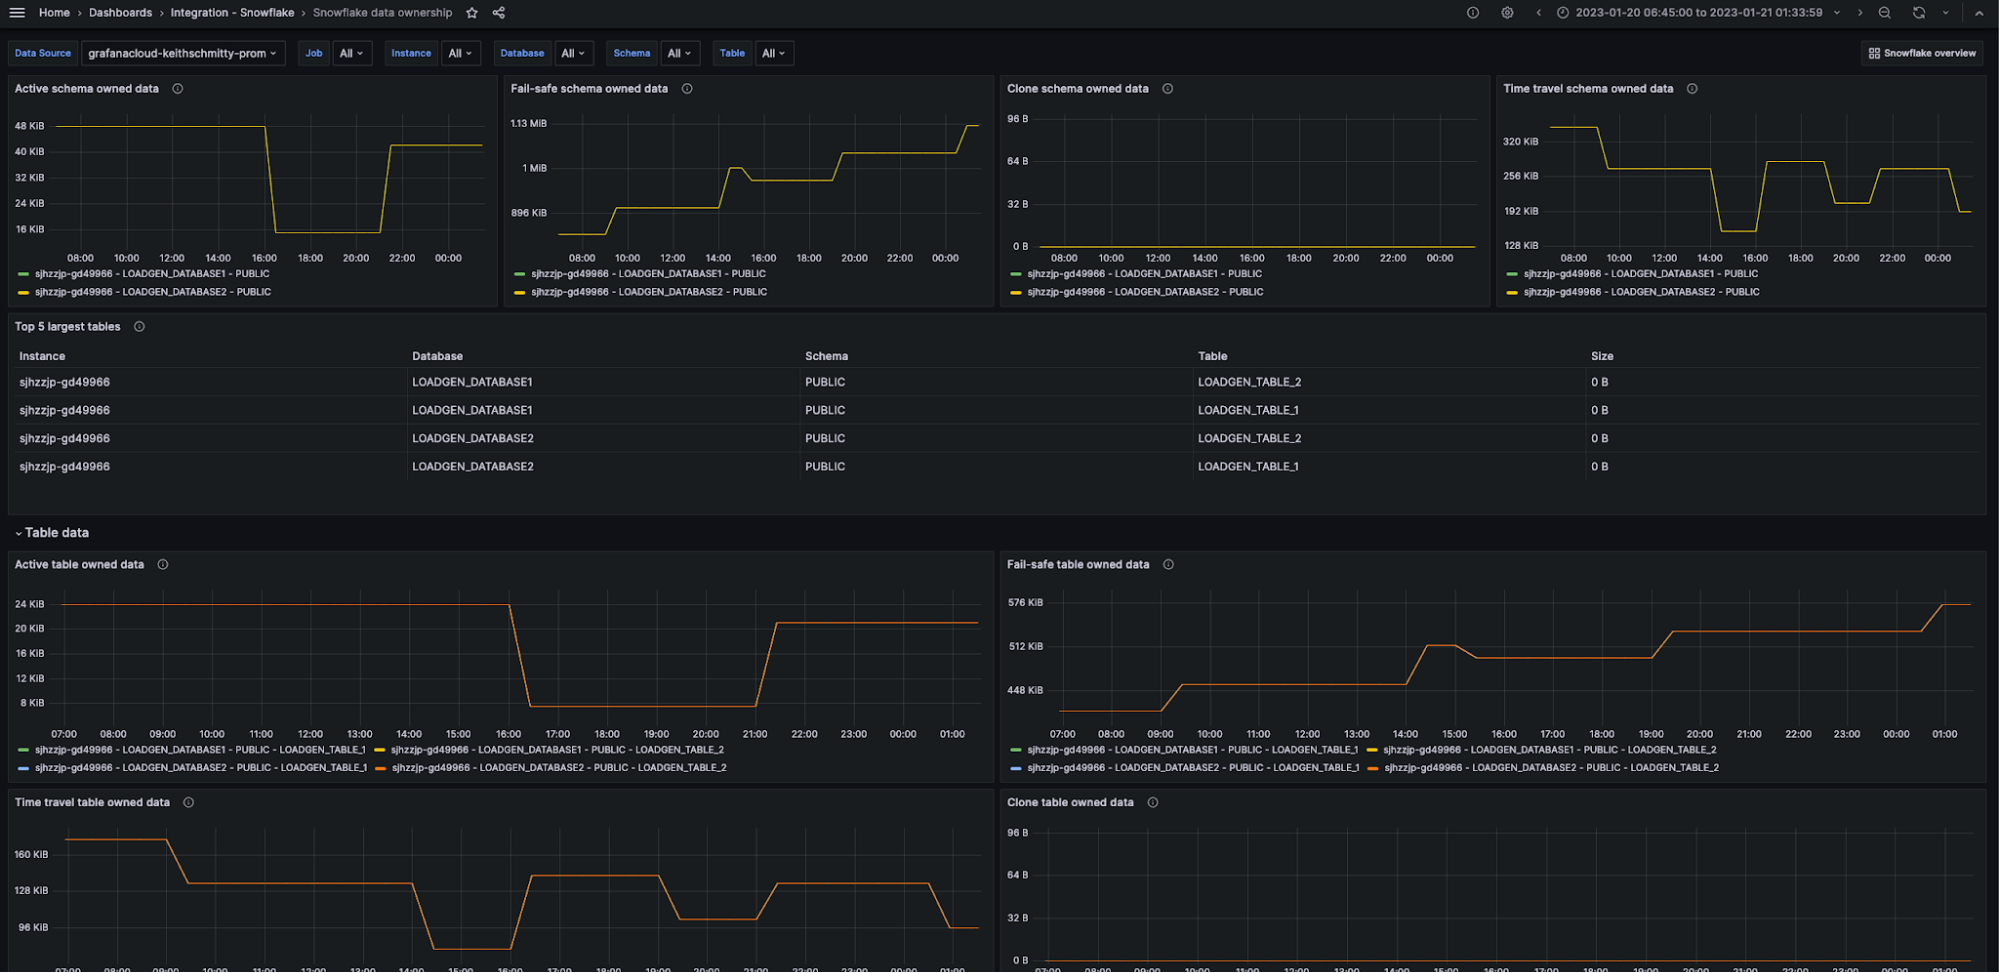
The Snowflake Data Ownership dashboard provides you with a dedicated insight on used storage for schema and tables in your Snowflake Data Cloud.

The key metrics monitored are:
snowflake_table_active_bytessnowflake_table_time_travel_bytessnowflake_table_failsafe_bytessnowflake_table_clone_bytes
Snowflake alerts
The Snowflake integration for Grafana Cloud includes a set of six alerting rules that were created to help you monitor your Snowflake Data Cloud. The following alerts are a sample of what is included, with the full list available in the Snowflake integration documentation.
The included alerts cover three distinct areas, namely the availability of Snowflake itself, compute and service credit usage, and login failures.
SnowflakeDown
This alert monitors the snowflake_up metric and alerts if the Snowflake Prometheus Exporter fails to scrape metrics from Snowflake. This indicates either Snowflake downtime or an incorrectly configured exporter.
SnowflakeCriticalHighComputeCreditUsage
This alert monitors the snowflake_used_compute_credits metric and alerts if the compute credit usage has exceeded the default usage budget of five credits an hour, for the last five minute interval. Another alert SnowflakeWarningHighComputeCreditUsage will warn when the credit usage is above 80% of the usage limit.
SnowflakeWarnHighLoginFailures
This alert monitors the snowflake_failed_login_rate metric and alerts if the failure rate exceeds 30% of login attempts over the last five minutes. Login failures can be an indicator of attempted malicious activity and needs to be responded to quickly.
All alerts thresholds are default examples, and can be configured to meet the needs of your environment.
Start monitoring Snowflake today
These dashboards and alerts can help you get your Snowflake monitoring up and running in an easy way, which is the goal of this integration.
Give our Snowflake integration a try, and let us know what you think! You can reach out to us in our Grafana Labs Community Slack in the #Integrations channel.
And if you’re looking to monitor additional environments, check out our solutions page for a list of other tools and platforms we can help you visualize and monitor with Grafana Cloud. At Grafana Labs, we have a “big tent” philosophy of providing a consistent experience across as many data sources and environments as possible, and we’re continuing to expand our integrations to support our community’s needs.
Grafana Cloud is the easiest way to get started with metrics, logs, traces, and dashboards. We have a generous forever-free tier and plans for every use case. Sign up for free now!


