Why Paradigm switched to Grafana Cloud: Inside their observability stack
As the largest liquidity network in crypto, Paradigm facilitates more than $11 billion in monthly volumes, representing nearly 40% global cryptocurrency option flows. Their free-to-use platform provides a single point of access to multi-asset, multi-instrument liquidity on demand, and Software Architect Jameel Al-Aziz leads the team of developers who build and maintain the platform.
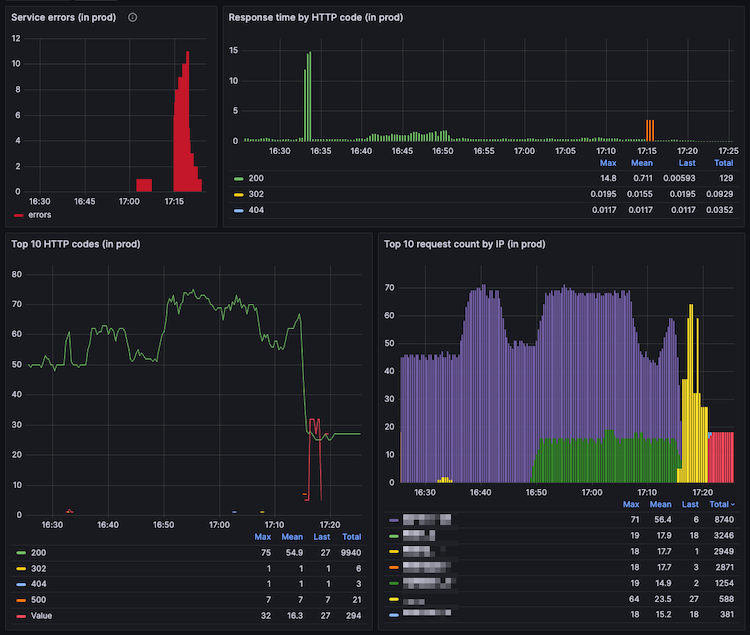
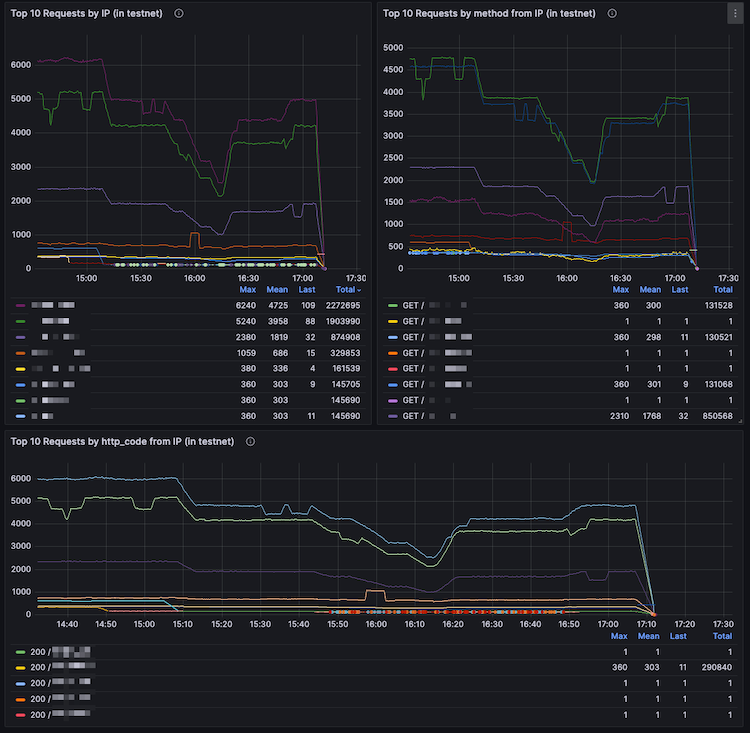
We recently spoke with Al-Aziz about Paradigm’s logging and observability journey, which has evolved as the team adopted Grafana Cloud and Grafana Cloud Logs, which is powered by Grafana Loki. Over the course of the conversation, Al-Aziz shared how transitioning to Grafana has helped the team significantly improve its logging and monitoring capabilities, leading to enhanced developer engagement, increased trust in their data, and better issue diagnosis and resolution.

Note: This transcript has been edited for length and clarity.
How did you find out about Grafana Loki for logs?
I’ve been in an infrastructure role for almost my entire career. And to me, observability is at the heart of what we do in infrastructure. Providing a good observability platform is the key. By the time I came to Paradigm, I had learned a lot working with other vendors in this space. And I kept running into the same challenges — lack of adoption, not getting the alerting capabilities we needed, and ballooning infrastructure costs. Then I learned about Grafana Loki in one of my previous roles, and it ticked all the boxes: It delivered super scalable ingest and an incredibly fast read workload that leverages cloud infrastructure.
What drove your transition to Grafana Cloud for logging?
When I came on board at Paradigm, the team was using an IaaS provider for logging, and it was a miserable experience. We needed to get insights from logs that we just weren’t getting. Grafana Cloud solved all of our needs in a scalable, affordable way. And the price structure aligned really well with the way we used it.

Why did you choose to utilize Grafana Cloud?
We could have hosted Loki internally, which is the beautiful thing about Grafana’s open source tooling. But we chose Grafana Cloud because we’re a small company and a small team, so we didn’t want to manage it ourselves. And Grafana Cloud is a no-BS platform. The benefits are huge compared to the small increases in cost. You’d be a fool not to pay for it. The engineering costs of hosting it ourselves would be much higher. It was easy, it scaled, and the Grafana Labs team was incredibly supportive in onboarding us and making sure we were set up for success.
How has Grafana Cloud changed developer culture at Paradigm?
One huge benefit has been developer happiness. When I look at the success of a logging tool, I look at engagement and whether the team is actively using the tool. The level of engagement we saw with Grafana Cloud Logs was astounding. We planted the seed with a few folks and then, very organically, more people just started using it. Now, when an issue comes up, Support shares their Grafana Cloud link, and then engineers follow up with a different view of the logs.

The conversations are so much more data driven than they were in the past. Different teams are looking at and using it because the Loki query language, LogQL, is simple, so it’s accessible to everyone. They also have complete trust in the data.
Have you seen improvements in your performance metrics and MTTR?
Our time to resolution has definitely improved. We’re still working on it, but our ability to diagnose issues has improved by an order of magnitude. Our main solutions engineer recently told me how easy his job is now with Grafana Cloud. That’s the power of a great tool — empowering team members of all backgrounds to understand and use a technical platform.
With our previous platform, everybody dreaded logging in to find information. Now, we have three or four people looking at logs, slicing and dicing in different ways, and feeling empowered to find information and root causes. It’s a totally different ballgame.

How are you planning to evolve your use of Grafana in the future?
As we were onboarding Grafana Cloud, Grafana Mimir and some other tools came out. So we’re looking forward to adopting those and fully transitioning away from our legacy monitoring solutions. With Grafana Loki for logs and Mimir for metrics, the fundamentals are there; the fundamentals are right. And anybody who looks at competitors in the same space can see that they don’t have those fundamentals — and that’s why they cost so much.
I’m really a big fan of what Grafana Labs is trying to do here. They’re saying observability should be easy, accessible, and rock solid at the core.
Grafana Cloud is the easiest way to get started with metrics, logs, traces, and dashboards. We have a generous free forever tier and plans for every use case. Sign up for free now!


