Start monitoring GitLab with our new Grafana Cloud integration
GitLab is a popular open source DevSecOps platform for software development. The Enterprise Edition is a web-based Git repository manager that allows teams to collaborate on code and automate workflows for building, testing, and deploying applications.
We already offer the Gitlab datasource plugin, which allows you to query and visualize data from your GitLab instance on your Grafana dashboards. It provides you with the ability to access and visualize various data from your GitLab instance, such as repository statistics, merge requests, pipelines, and issues. This plugin focuses on retrieving and displaying specific GitLab data within Grafana.
Now we are proud to introduce a different kind of integration for Gitlab — a brand new observability integration that will help you monitor the system itself. It is designed to help you monitor and observe specific metrics and logs related to your GitLab instance, and it offers insights into metrics such as HTTP request rates, HTTP request latencies, CI pipeline creation rates, and more.
Additionally, the integration supports scraping the rails error logs through an agent like Promtail. It provides a pre-built dashboard that visualizes these metrics and logs, giving you a comprehensive view of the observability aspects of your GitLab environment.
Let’s walk through how to easily set up a Grafana Cloud account and start monitoring your GitLab instance!
How to configure GitLab integration with Grafana Cloud
The GitLab integration uses the Grafana Agent to collect metrics for monitoring your GitLab EE (Enterprise Edition) instance. This way we can collect both metrics and logs from your server with a single agent and configuration which will enable you to monitor your GitLab deployment with Grafana Cloud by following just a few simple steps:
- A Grafana Cloud account is required to use the GitLab integration. If you don’t already have a Grafana Cloud account, you can sign up for a free account today.
- In your Grafana instance on Grafana Cloud, use the left-hand navigation to get to the Connections Console (Home > Connections > Connect data).
- Install the GitLab Infrastructure Integration and configure the Grafana Agent to collect logs and metrics from it. Please refer to how to install and manage integrations documentation for more information. For details around configuring Grafana Agent for this integration, refer to the GitLab integration documentation.
Start monitoring your GitLab instance
After the integration is installed, you will see a pre-built dashboard for GitLab and a set of GitLab-related alerts automatically installed into your Grafana Cloud account.
GitLab overview dashboard
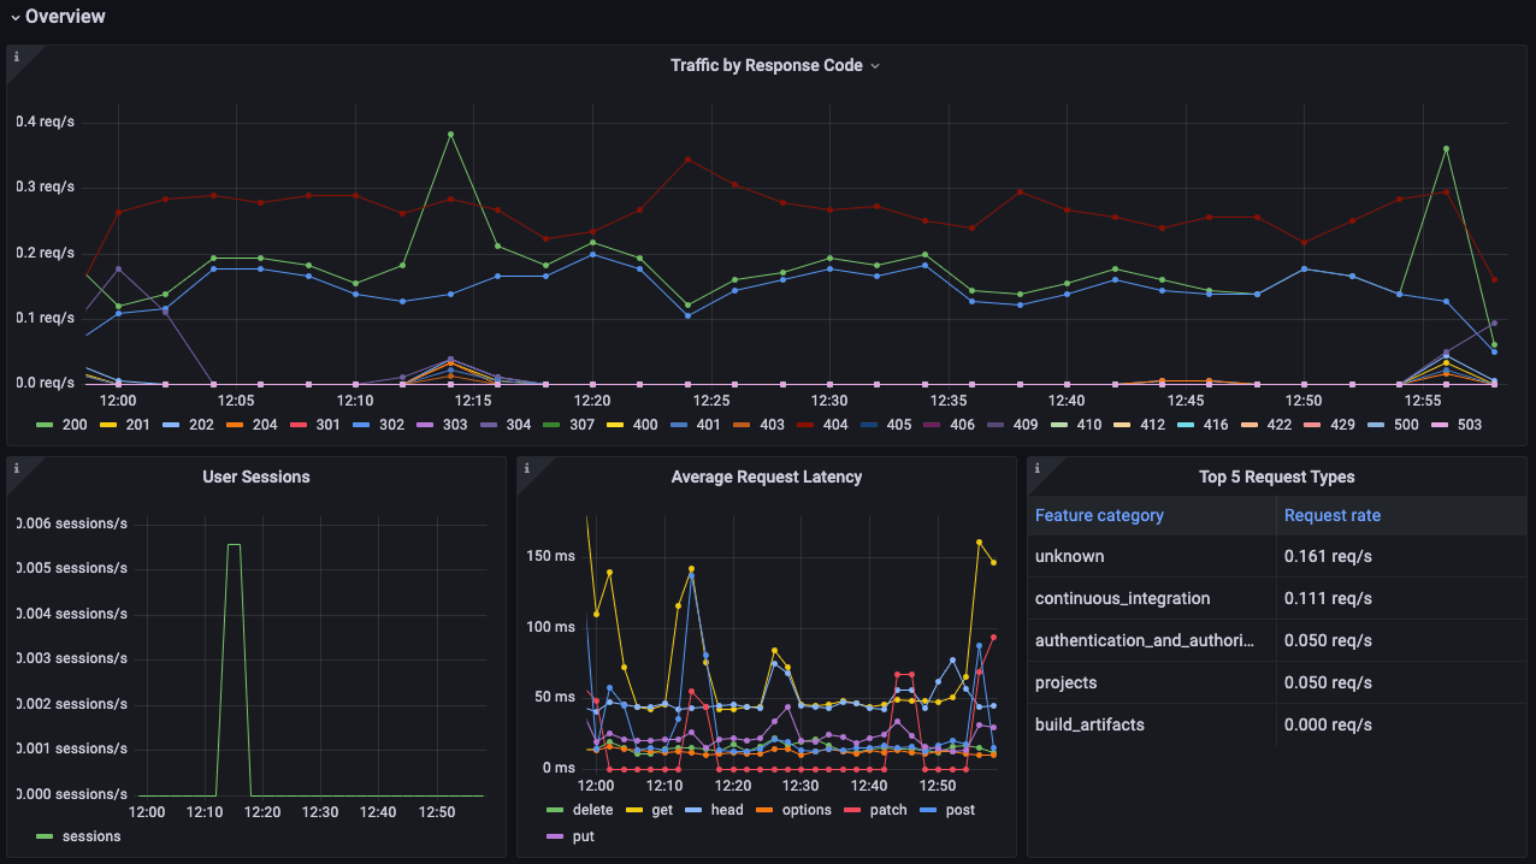
We collected all you need to monitor your GitLab instance in a single dashboard.
The Overview dashboard will give you assurance that everything is working as expected, and the top panel visualizes your traffic by response code. This will make problems, such as lots of 500 errors, impossible to miss. Of course you won’t need to keep the dashboard up on screen at all times since we also alert if there are too many 5XXs or 4XXs.
Additionally, we show you the average request latencies to help you keep an eye on the performance of successful requests.

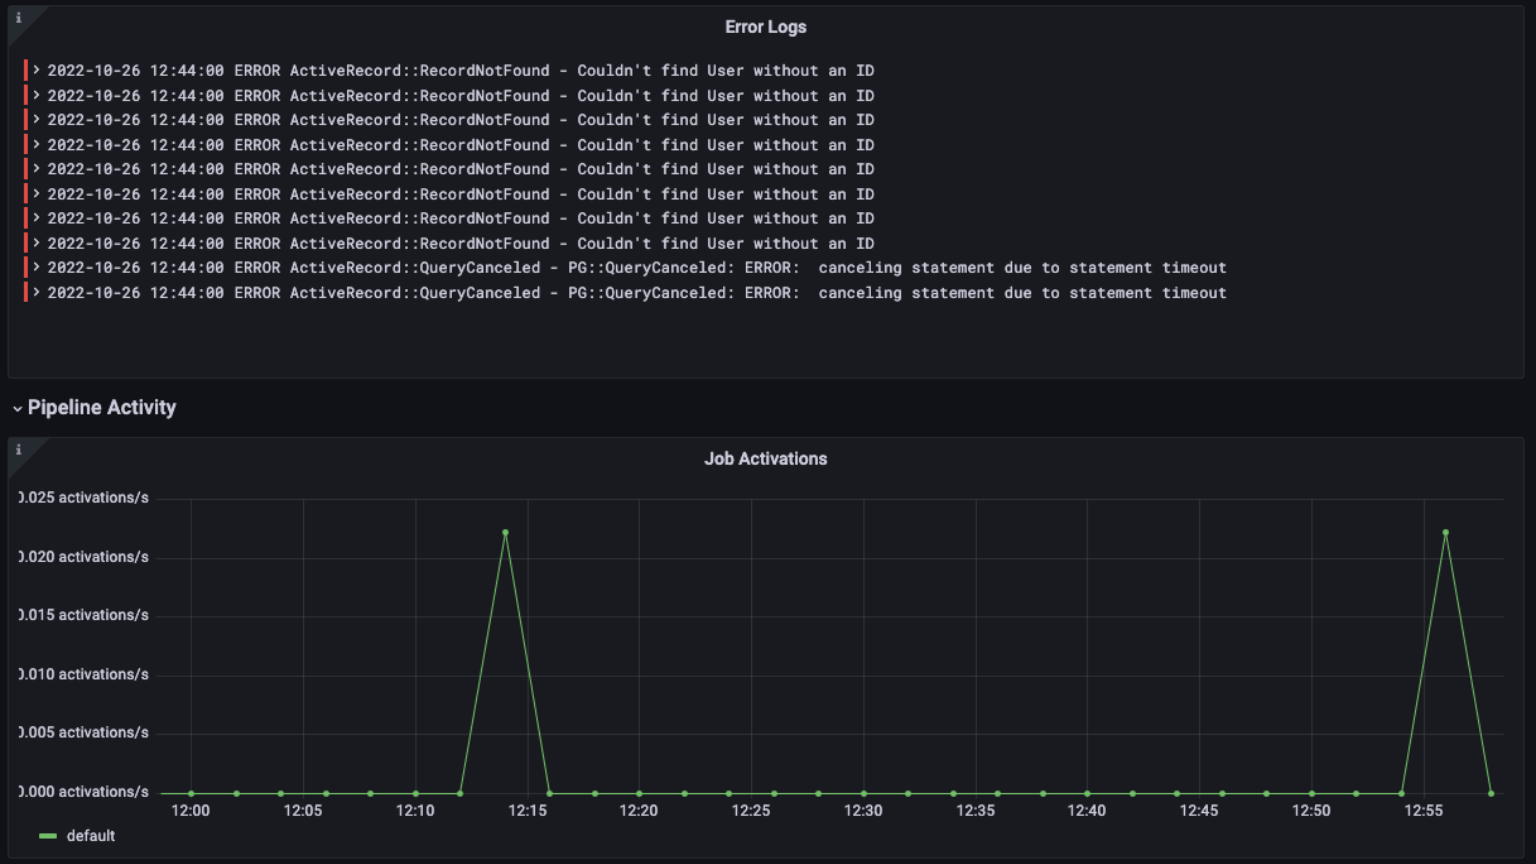
The dashboard also contains a log panel so you can correlate logs and metrics for troubleshooting and identify any errors or issues that may be impacting the system.

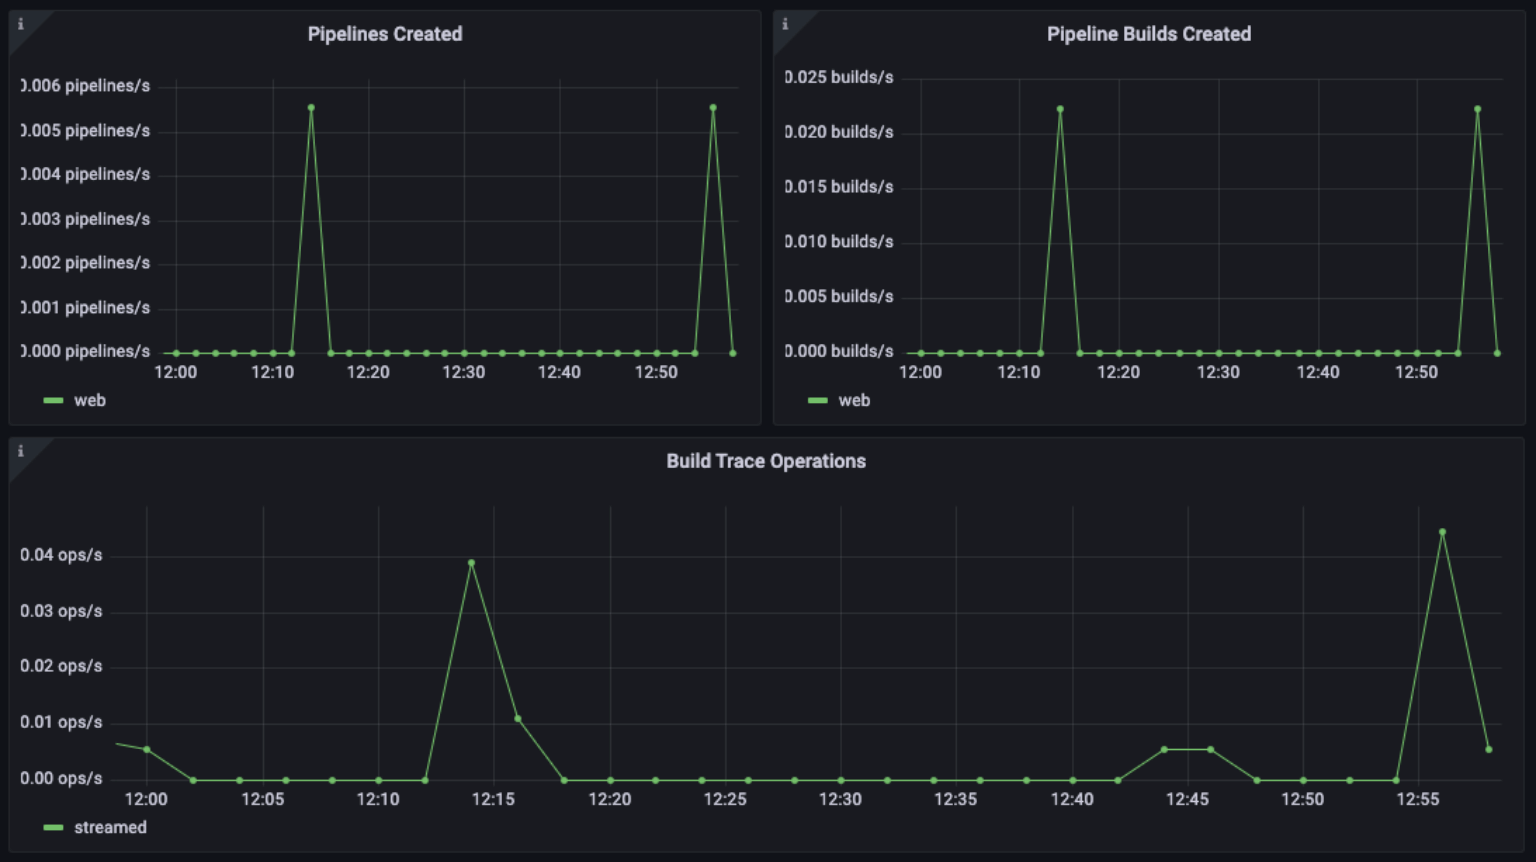
Further down the dashboard, we help you monitor pipeline activity with metrics on job activations, pipelines created, pipeline build created, and build trace operations.

Why monitor those? Let’s look at one example: A job activation in GitLab occurs when a job is initiated within a pipeline to perform a specific task, such as building an application, running tests, or deploying code. By keeping a close eye on job activations, you can ensure that your pipelines are running smoothly and efficiently and that there are no bottlenecks that impact your overall performance.
Some of the metrics we monitor include:
- gitlab_ci_active_jobs_sum
- gitlab_ci_runner_authentication_failure_total
- gitlab_ci_trace_operations_total
- http_requests_total
- job_register_attempts_failed_total
- pipelines_created_total
- user_session_logins_total
GitLab alerts
The integration also comes packaged with a number of handy alerts. Let me explain a couple of them.
GitLabHighRunnerAuthFailure
This will warn you if there is a large percentage of runner authentication failures.
In GitLab, a runner is a program that runs on a machine and executes jobs defined in a GitLab CI/CD pipeline. When a pipeline is triggered, GitLab selects a runner to execute the jobs defined in the pipeline. The runner then pulls the pipeline code and any required dependencies and executes the pipeline jobs. Runner authentication failures occur when a runner is unable to authenticate with GitLab to execute the assigned jobs. This can happen for a variety of reasons, such as incorrect authentication credentials, network issues, or a misconfiguration of the runner.
If there are many auth failures, you should make sure that there is no security issue such as someone trying to gain unauthorized access to the runner..
GitLabHigh5xxResponses
You’d surely want to know when there are lots of failing requests- we’ll alert you if they cross a critical threshold for over 5 minutes.
GitLabHigh4xxResponses
We’ll send you a warning if there is a high rate of HTTP 4XX errors.
For example, if there are a high number of 404 errors (Not Found) or 403 errors (Forbidden), this may indicate that there are issues with the runners accessing the GitLab repository or registry.
All alerts thresholds are default examples, and can be configured to meet the needs of your environment.
Get started with the GitLab integration for Grafana Cloud today
These dashboards and alerts can help you get your GitLab instance monitored in no time. Once you have the integration up and running, you can troubleshoot issues faster and ensure your software development life cycle is progressing smoothly.
Give our GitLab integration a try, and let us know what you think! You can reach out to us in our Grafana Labs Community Slack in the #Integrations channel.
And if you’re looking to monitor additional environments, check out our solutions page for a list of other tools and platforms we can help you visualize and monitor with Grafana Cloud. At Grafana Labs, we have a “big tent” philosophy of providing a consistent experience across as many data sources and environments as possible, and we’re continuing to expand our integrations to support our community’s needs.
Grafana Cloud is the easiest way to get started with metrics, logs, traces, and dashboards. We have a generous forever-free tier and plans for every use case. Sign up for free now!


