How to monitor Oracle Database with Grafana Cloud
Oracle Database is an enterprise multi-model database system capable of handling large amounts of data across multiple database servers with support for a wide variety of workloads. It’s a widely used and proven database software, so we are incredibly pleased to announce that it now has a dedicated cloud integration in Grafana Cloud.
With the Oracle Database (OracleDB) integration, you can monitor your database’s performance with ease. Let’s walk through how to easily set up a Grafana Cloud account and start monitoring your Oracle Database instance!
How to configure your Oracle Database integration with Grafana Cloud
The OracleDB integration utilizes metrics generated by the open source oracledb_exporter project. We embedded it into Grafana Agent, which makes it easier to run in your environment and start collecting both metrics and logs from your deployment with a single agent and configuration. You can start monitoring your Oracle Database deployment with Grafana Cloud by following these simple steps:
- A Grafana Cloud account is required to use the Oracle Database integration. If you don’t have a Grafana Cloud account, you can sign up for a free account today.
- In your Grafana instance on Grafana Cloud use the left-side menu to navigate to the Connections Console (Home > Connections > Connect data).
- Install the OracleDB Infrastructure Integration and configure the Grafana Agent to collect logs and metrics from it. Please refer to the documentation on how to install and manage integrations for more information. For details around configuring Grafana Agent for this integration, read the corresponding documentation.
Start monitoring your Oracle Database instance
After the integration is installed, you will see a pre-built overview dashboard for Oracle Database and a set of Oracle Database-related alerts automatically installed into your Grafana Cloud account.
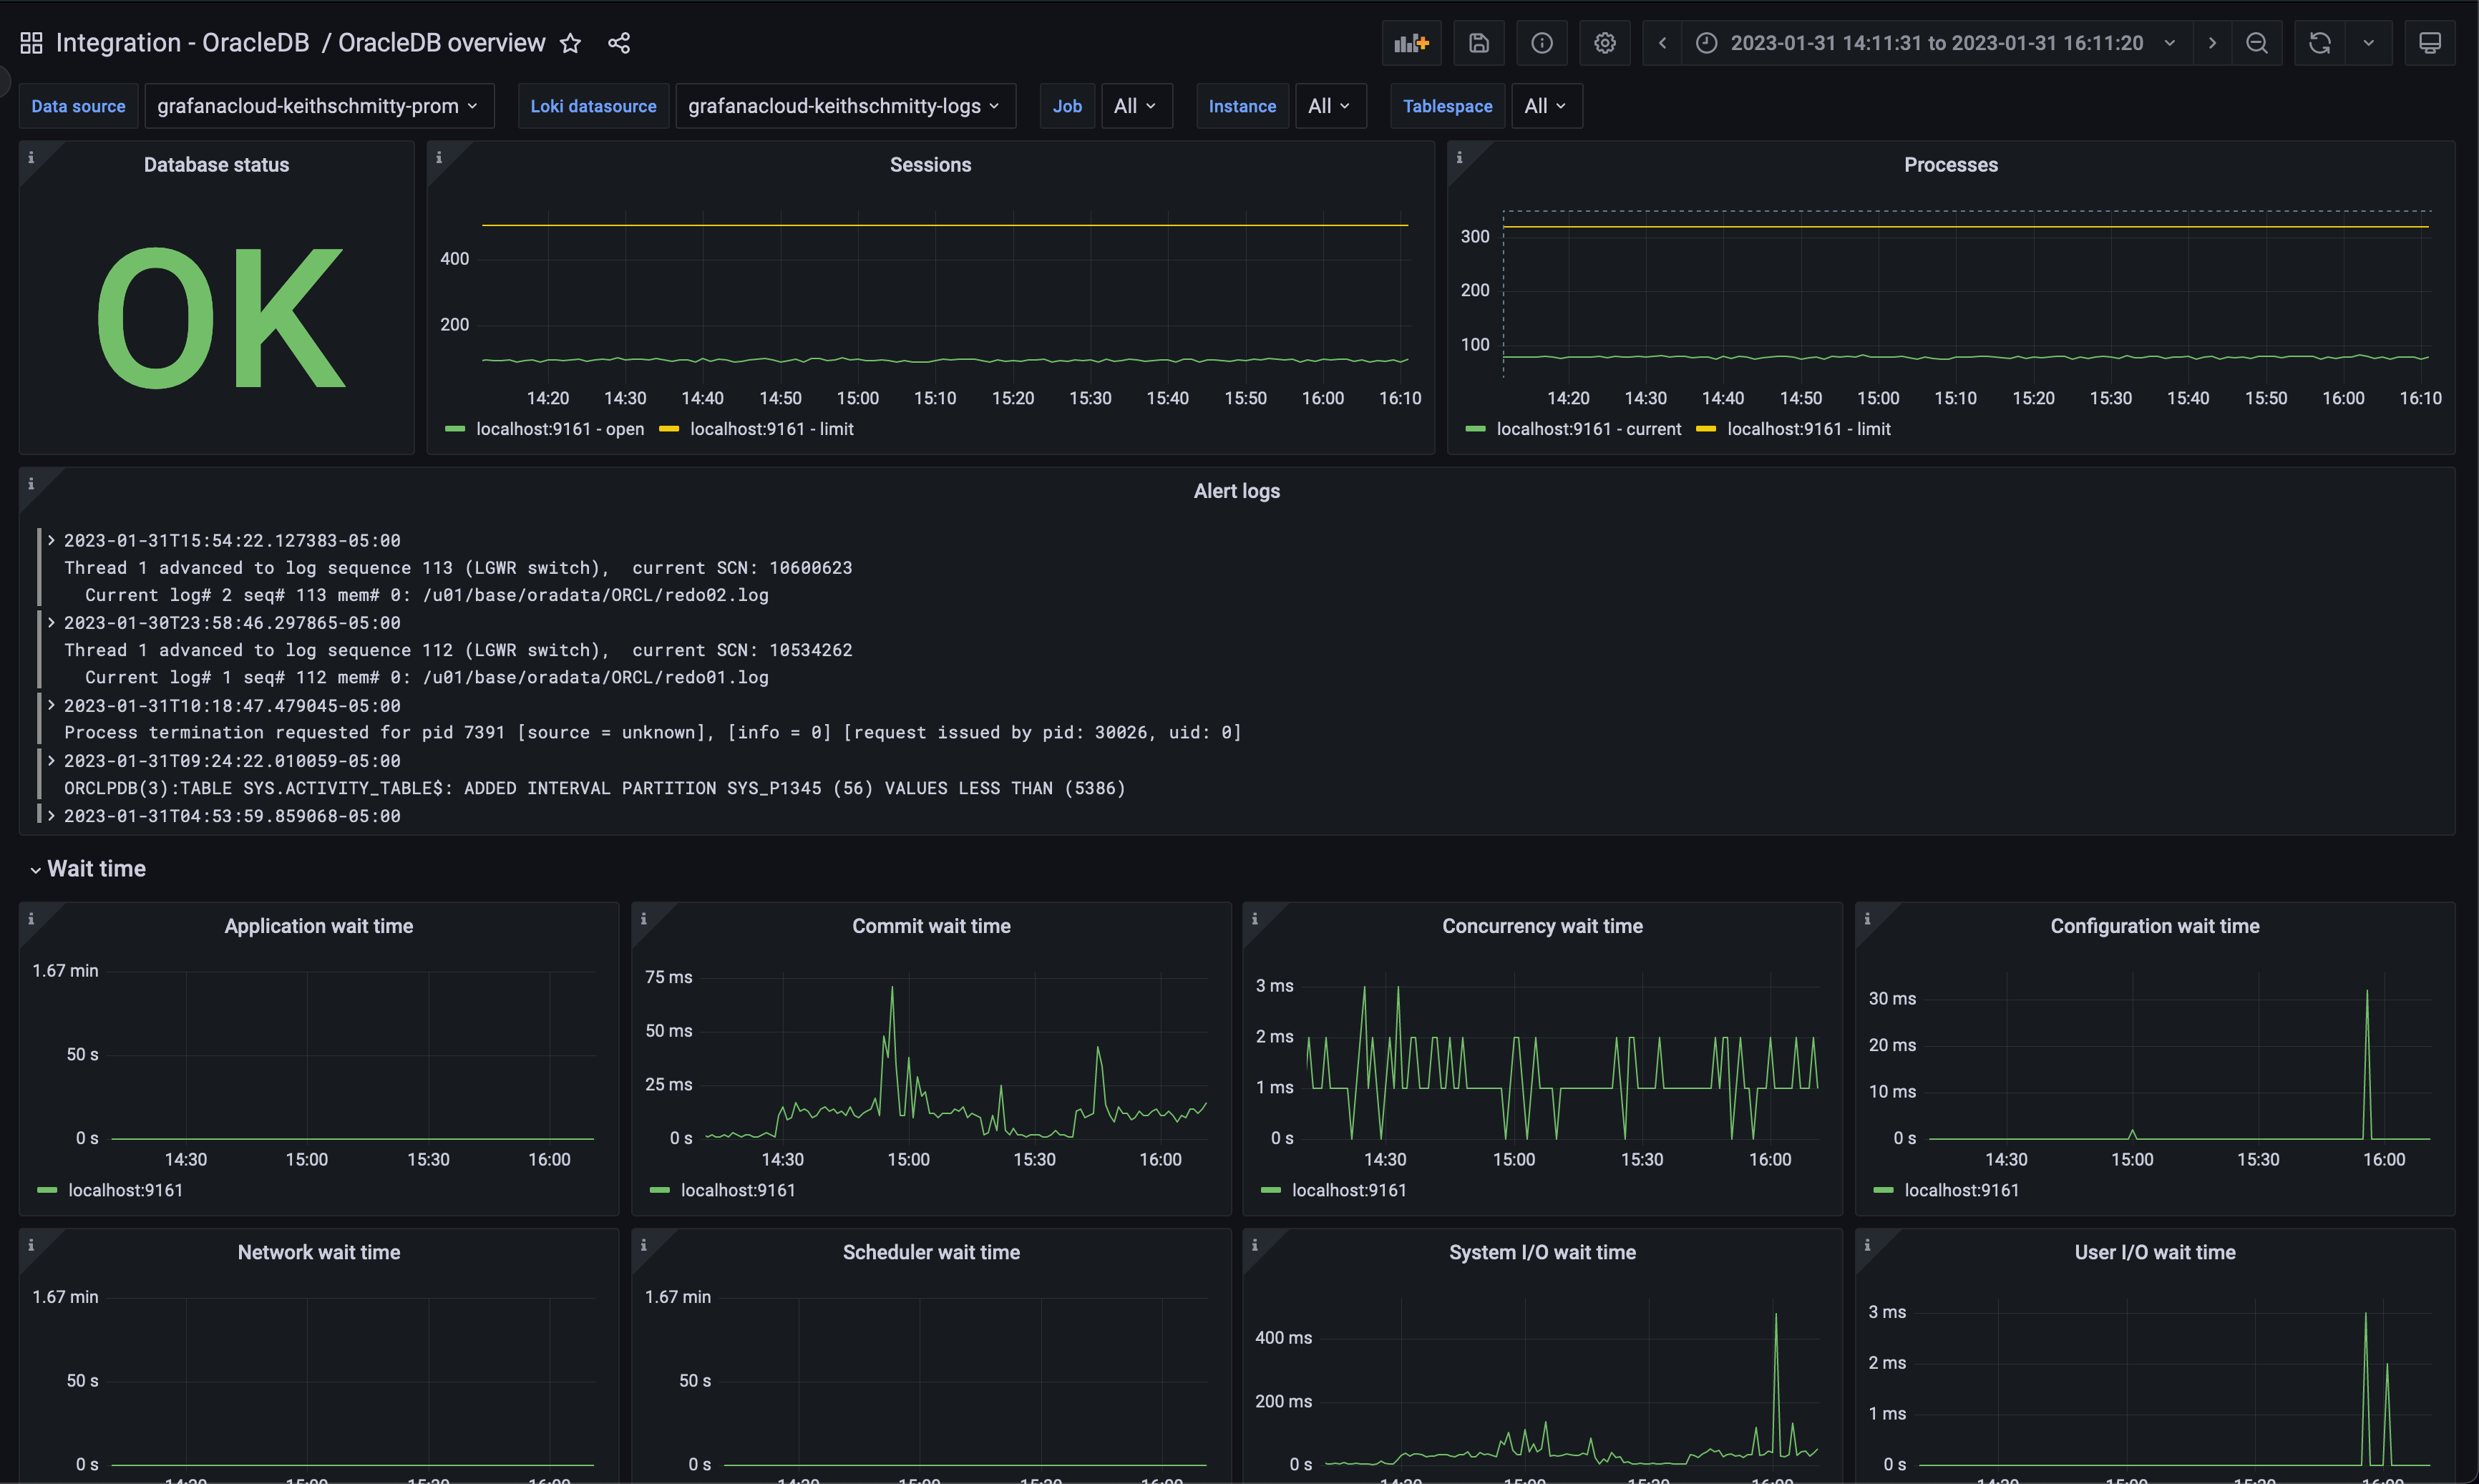
OracleDB overview dashboard
This dashboard gives a general overview of the Oracle Database instance based on all the metrics exposed by the embedded Prometheus exporter.

The key metrics monitored are the following:
- oracledb_resource_current_utilization
- oracledb_wait_time_commit
- oracledb_wait_time_concurrency
- oracledb_tablespace_bytes
The OracleDB overview dashboard provides a quick insight into the state of your Oracle Database instance. You have immediate access to resource insights like number of sessions and processes, along with important wait time metrics, such as commit wait time and concurrency wait time.
Additionally, the current tablespace size is easily compared with the tablespace limit, allowing an easy way to spot surges in storage utilization. This is further backed up by the OracledbTablespaceReachingCapacity alert seen below.
A log panel is also included to help you correlate logs and metrics for troubleshooting.
Oracle Database alerts
The integration also comes packaged with a number of handy alerts.
Below are a sample of the included alerts. (Note: The thresholds listed for each alert are set as defaults in the integration and can be configured to meet your requirements.)
OracledbReachingSessionLimit
This alert monitors the oracledb_resource_currenty_utilization metric’s resource_name label and theoracledb_resource_limit_value metric and alerts if the number of sessions have exceeded 85% of the database session limit for the past five minutes.
OracledbReachingProcessLimit
This alert monitors the oracledb_resource_currenty_utilization metric’s resource_name label and the oracledb_resource_limit_value metric and alerts if the number of processes have exceeded 85% of the database process limit for the past five minutes.
OracledbTablespaceReachingCapacity
This alert monitors the oracledb_tablespace_bytes and oracledb_tablespace_max_bytes and alerts if tablespace size has exceeded 85% of the database’s tablespace size allocation for the past five minutes.
Get started with the Oracle Database integration today
The dashboards, metrics, and alerts packaged in the new OracleDB integration in Grafana Cloud can help you get your Oracle Database monitoring up and running instantly.
Give our Oracle Database integration a try, and let us know what you think! You can reach out to us in our Grafana Labs Community Slack in the #Integrations channel.
Grafana Cloud is the easiest way to get started with metrics, logs, traces, and dashboards. We have a generous forever-free tier and plans for every use case. Sign up for free now!


