Introducing Adaptive Metrics: A new cost management feature in Grafana Cloud
Update: During the opening keynote of ObservabilityCON 2023 on Nov. 14, we announced that Adaptive Metrics is generally available across all tiers of Grafana Cloud, including our generous forever-free tier. To learn more about Adaptive Metrics and other cost management tools available in Grafana Cloud, read our recent blog post.
You’ve convinced your organization that cloud native is the way forward. You’ve championed Kubernetes and sworn by Prometheus. You’ve onboarded multiple teams to your centralized observability platform. Then you open your latest bill and see a lot of commas in your invoice, and a sinking feeling sets in. Sound familiar?
We’re keenly aware of the pain this can bring. As metric cardinality grows in cloud native environments, so does the cost to store and retrieve the data. That growth can be rapid, which leads to uncontrolled costs that negatively impact planning and budgeting, and even inspire skepticism about the value of observability metrics.
We’re always looking for ways to make observability more cost-effective, which is why we are thrilled to announce Adaptive Metrics, a new feature in Grafana Cloud that enables teams to aggregate unused and partially used metrics into lower cardinality versions of themselves to reduce costs. This announcement follows on the heels of our updates to the Cardinality Management dashboards (now available across all Grafana Cloud plans, including our generous free forever plan), which can be used to identify unused metrics in your environment.
Adaptive Metrics is available in a public access program to users in all tiers of Grafana Cloud, including our generous forever-free tier. If you are interested in trying Adaptive Metrics in your Grafana Cloud environment, navigate to the Adaptive Metrics plugin that can be found under Apps in the hamburger menu in Grafana Cloud.
In this post, we’ll explore how Adaptive Metrics works and the value it brings to organizations struggling with rapidly rising costs and cardinality in their Prometheus environments. We’ll also share real results as seen in our own internal Grafana Labs operations environment as well as those experienced by some of our customers.
What is Adaptive Metrics?
Adaptive Metrics is a new metrics management and cardinality optimization feature in Grafana Cloud that allows teams to identify and eliminate unused time series data through aggregation.
Manually analyzing usage patterns for millions of time series is not for the faint of heart. It is an imperfect practice that is cumbersome: You need to wade through all the possible ways a metric can be used, which can include dashboards, recording rules, alerting rules, ad-hoc queries in Grafana Explore, and automated scripts that call the query API. Not only is pulling together all these usage signals onerous; it is also high stakes. If you make a mistake, you may end up deciding to eliminate a critical metric powering a dashboard or an alert, impairing your ability to observe your systems. Adaptive Metrics takes the guesswork out of the process, saving you time and giving you peace of mind.
There’s supposed to be a video here, but for some reason there isn’t. Either we entered the id wrong (oops!), or Vimeo is down. If it’s the latter, we’d expect they’ll be back up and running soon. In the meantime, check out our blog!
But just understanding usage isn’t enough. Even if you know what is being used and not used, how do you then act on that information to drive down costs? Adaptive Metrics is aimed at closing this insight to action loop by providing not only an analysis engine but also an aggregation engine. Its analysis of usage patterns gets turned into recommendations for what metrics can be aggregated, which can then be applied in Grafana Cloud.
In our own operations environment, where we monitor the infrastructure powering Grafana Cloud, Adaptive Metrics has allowed us to identify and realize a 40% reduction in time series. Several of our early access customers have also already applied our recommended aggregations to eliminate millions of time series.
“We carefully watch our metric and cost consumption, and in the past we manually evaluated every metric to identify what to drop, which was extremely time consuming and a tedious process,” says Lydia Clarke, DevOps Engineer at SailPoint. “Grafana Cloud Adaptive Metrics simplified this process for us by generating recommendations curated for our environment, reducing the amount of time spent by half. I wish I had this feature sooner.”
How Adaptive Metrics helps with metrics management
We believe that every observability deployment is unique and that a “one-size-fits-all” approach is not the way to go. Instead, we wanted to find savings through a more targeted approach that doesn’t eliminate the ability to answer questions about your systems or require re-architecting your labels or alerts.
Adaptive Metrics recommends which metrics to aggregate based on the actual usage within your cloud environment. It then continuously reanalyzes your usage, updating its recommendations to reflect changes in your observability needs. This allows it to “adapt” its recommendations to suit you.
Here’s how Adaptive Metrics works:
Identify which metrics are unused
Adaptive Metrics analyzes every metric coming into Grafana Cloud and compares it to how users access and interact with the metric. In particular it looks at whether each metric is:
- used in an alerting or a recording rule.
- used to power a dashboard.
- queried ad hoc via Grafana Explore or our API.
To answer the first two questions, it analyzes the alerting rules, recording rules, and dashboards in a user’s hosted Grafana. To answer the third, it looks at the last 30 days of a user’s query logs. With these three signals, Adaptive Metrics determines if a metric is unused, partially used, or an integral part of your observability ecosystem.
- Unused metrics. There has been no reference made to the metric based on any of those three signals.
- Partially used metrics. The metric is being accessed, but it has been segmented with labels to create many time series, and people are only using a small subset of them.
- Used metrics. All the labels on that metric are being used to slice and dice the data.
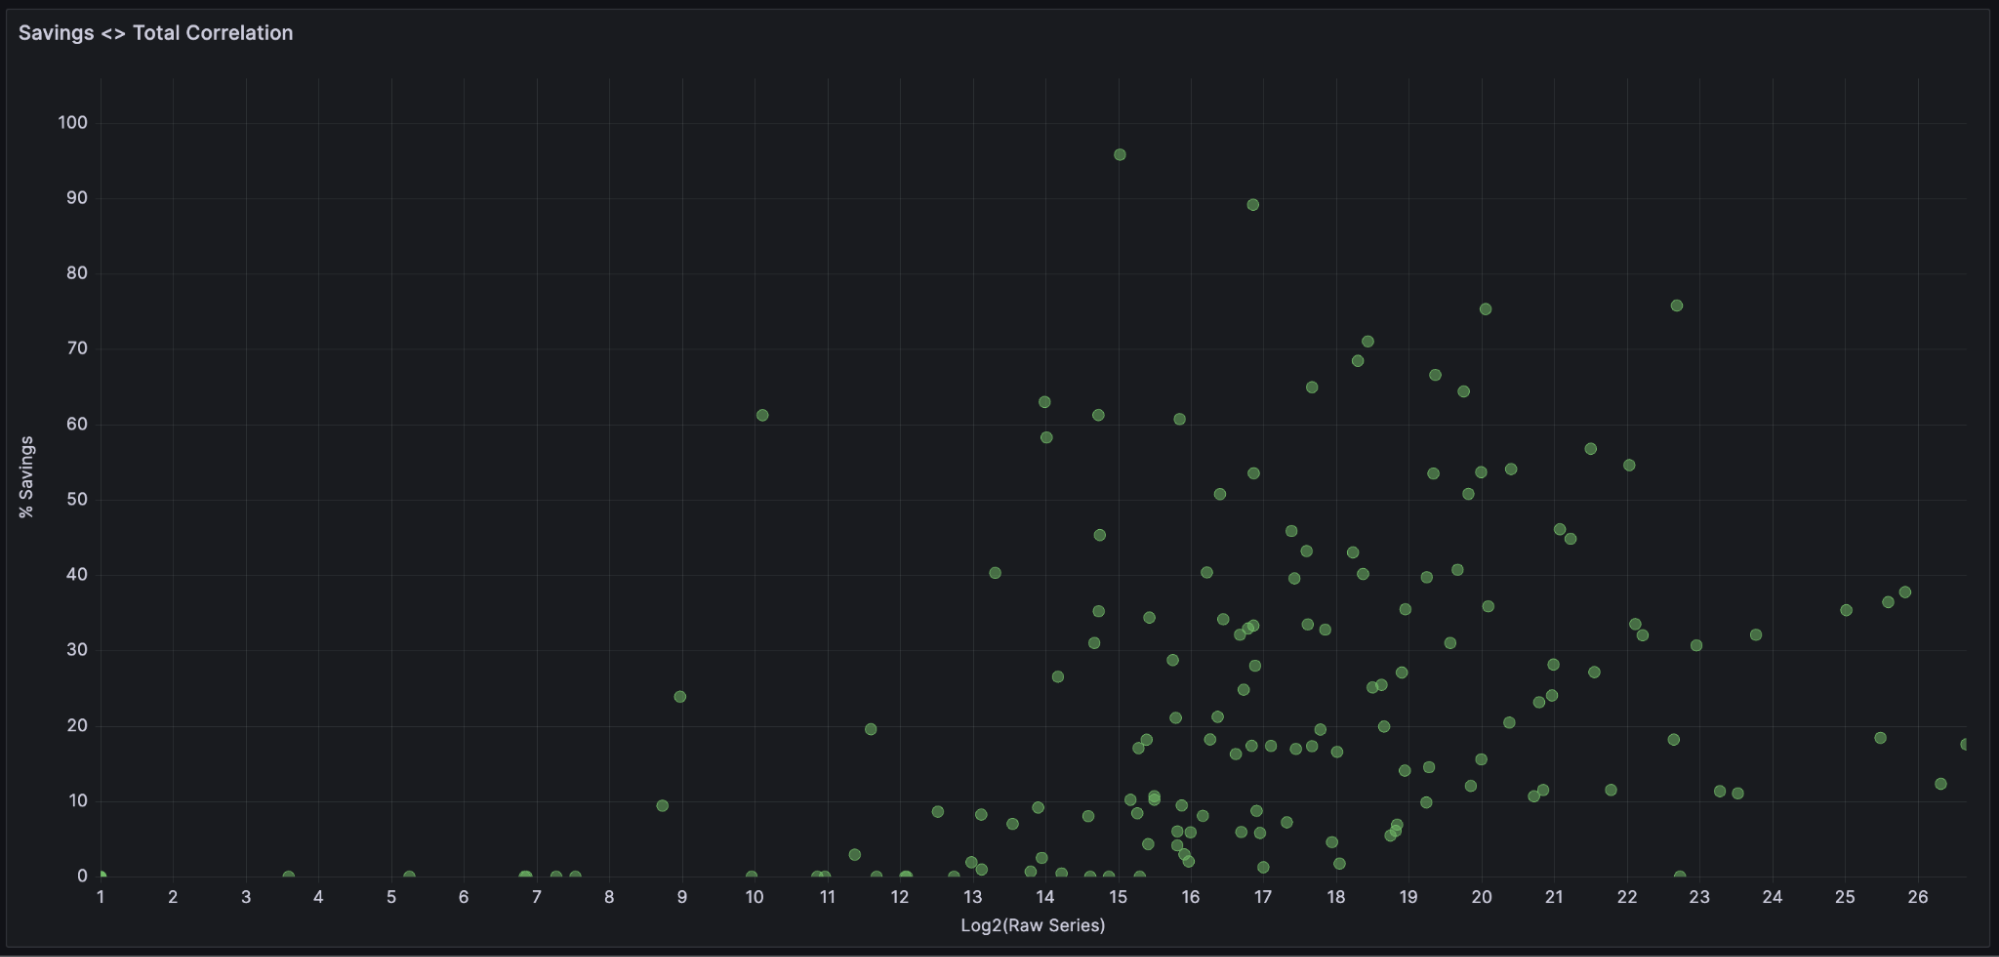
Our initial tests in more than 150 customer environments show that on average, Adaptive Metrics users can reduce time series volume by 20%-50% by aggregating unused and partially used metrics into lower cardinality versions of themselves.

Generate recommendations
Adaptive Metrics realizes savings for users by eliminating time series without compromising on observability. Instead of taking a hatchet approach of simply dropping metrics, Adaptive Metrics focuses on aggregating unused and partially used metrics into lower cardinality versions of themselves.
To determine how to best aggregate a metric, Adaptive Metrics looks at more than just your usage patterns. It also analyzes factors such as metric type (is it a counter or a gauge?), number of label values associated, and churn (how long is a time series alive?) so that it can provide efficient aggregation recommendations.

For metrics that are unused, Adaptive Metrics recommends aggregating away the ones that are driving the majority of the cardinality while preserving the others.
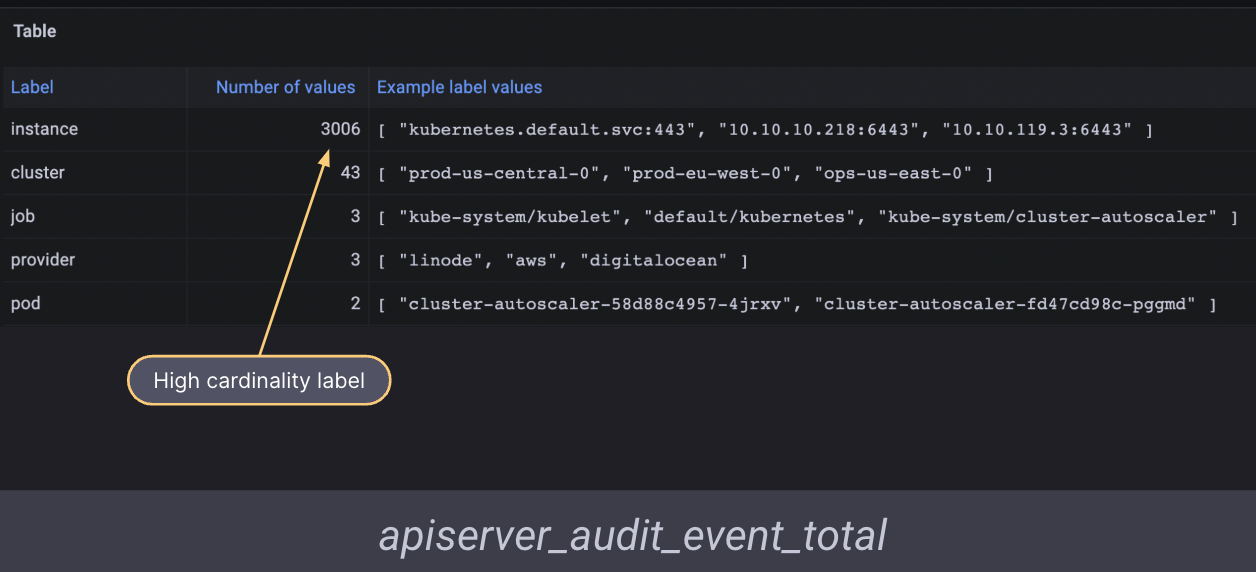
For example, in our Grafana Labs environment, we noticed the metric apiserver_audit_event_total was not used in any recording rules, alerts, query logs, or dashboards in 30 days, but accounted for 3,130 time series. Instead of dropping the entire unused metric, Adaptive Metrics aggregates the label {instance}, which is the highest cardinality, highest churn label.
After applying the aggregation, we reduced the total time series to 88 — a 96.9% reduction in cardinality for the metric — while still maintaining all the other labels related to the metric. In this way, we get the best of both worlds: We keep some trace of this metric around so that developers can discover it in the future, but we do so in a cost-efficient way that means we’re not spending a ton of money to ingest and store it.

For metrics that are partially used, Adaptive Metrics recommends an aggregation that respects the existing access patterns. Labels that have been used are preserved, while the rest are removed.
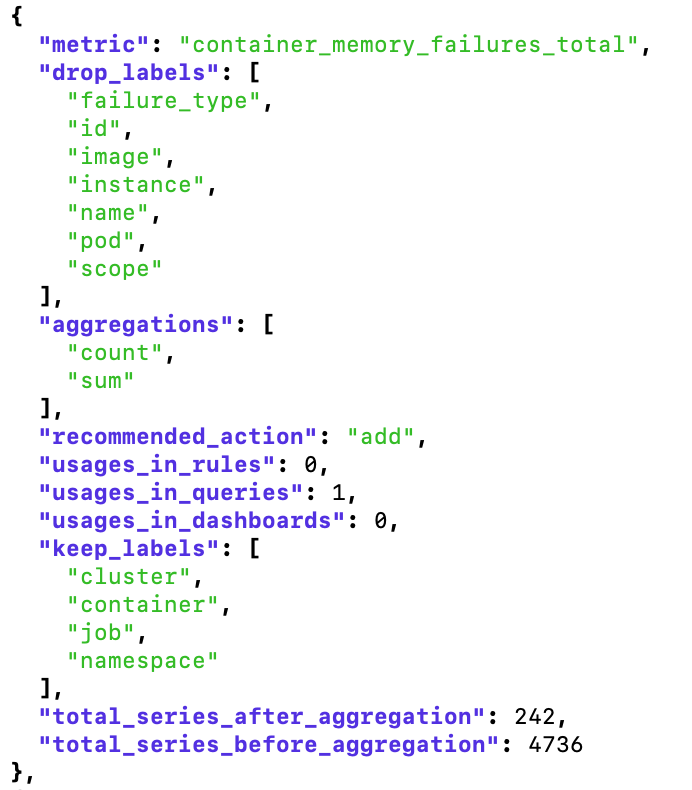
For instance, the example from our environment below shows the Adaptive Metrics recommendation for the metric grafana_http_request_duration_seconds_bucket. This is a partially used metric with a total of 10 labels. In the two dashboards and 18 queries where this metric is referenced, Adaptive Metrics determined that {cluster, container, job, le, method, namespace, status_code} labels were necessary. The {handler, instance, pod} labels were not.
Based on this analysis, Adaptive Metrics recommended aggregations on the unused labels (drop_labels:) , while leaving the rest untouched (keep_labels). Applying this recommended aggregation would allow the user to reduce the total time series associated with this metric by ~ 5,000. That equals a 92% reduction in cardinality, all while guaranteeing that existing dashboards, alerts, recording rules, and historic queries continue to work.

Realize reduced cardinality (and cost savings)
Applying the recommended Adaptive Metrics aggregations is at the discretion of the user. You can simply take the recommendations as they are and apply them via a CLI or API, knowing that your existing usages of the metric (in dashboards, rules, and ad-hoc queries) will continue to work
Alternatively, you can also modify the recommendations or completely skip applying some of them. This allows you to preserve important metrics or labels that you want to keep around, regardless of whether or not they’ve been recently used. You can also apply aggregation rules that Adaptive Metrics didn’t even recommend. Perhaps you want to aggregate away a high cardinality label even if it is being used in a dashboard because you don’t think that keeping that dashboard working is worth the cost to store that metric. Overall, this flexibility reflects our belief that you’re the expert on your observability system and can choose the tradeoffs that make sense for you.
We have seen our customers take a combination of these approaches, at times bringing in dev teams for awareness and giving them a heads up before aggregating a metric.
Adjust aggregations as needed
While the concept of aggregation is not new and available in other time series databases, what makes Adaptive Metrics unique is the ability to recommend customized aggregations that honor your usage patterns and therefore do not require you to rewrite your dashboards, alerting rules, recording rules, or previously executed queries.
Over time, we understand that metrics usage can change. Because we know we can’t predict the future, Adaptive Metrics makes it just as easy to remove aggregations as it does to apply them. Once the user tells Adaptive Metrics they want to stop aggregating a metric that’s currently being aggregated, the metric will be stored in its full cardinality state going forward.
In short, Adaptive Metrics is always updating its recommendations to meet your changing needs and reflect what’s best for your current usage.
How to get started with Adaptive Metrics in Grafana Cloud
After a successful private preview for a limited number of customers, we are thrilled to expand access to Adaptive Metrics to all Grafana Cloud users looking to control their metrics volume, optimize cardinality, and reduce costs.
To learn more about Adaptive Metrics, check out our Adaptive Metrics webpage and our documentation.
Grafana Cloud is the easiest way to get started with metrics, logs, traces, and dashboards. We have a generous free forever tier and plans for every use case. Sign up for free now!


