Grafana 9.5 release: Grafana Alerting updates, stronger security with service accounts, upgraded dashboards, and more
Grafana 9.5 has arrived! 🔥🎉
The latest Grafana release introduces new features and improvements, such as major Grafana Alerting improvements, dashboard and visualization enhancements, a redesigned navigation experience, support bundles for faster issue resolution, and much more to provide you with better insights into your data.
For a full rundown of features in Grafana 9.5, read our What’s New documentation, and for complete details on Grafana’s recent updates, refer to the changelog.
Note: The Grafana 9.5 and 9.5.1 releases also include security fixes for CVE-2023-28119 and CVE-2023-1387. To learn more, please read our latest security release blog.
Alerting updates for efficient monitoring
Generally available in Grafana OSS, Grafana Cloud (Free, Pro, Advanced), and Grafana Enterprise
Experience significant improvements to the Grafana Alerting system, such as searching for alert rules from multiple data sources, accessing alert rules directly from dashboards or panels, and navigating to relevant dashboards or panels from alert rules. There are also updates to alert rule settings and notification policies that help reduce alerting noise.
Fuzzy search, direct access to alert rules from dashboards, and more make managing your alert rules and monitoring your data a seamless experience. To learn more, check out our Grafana Alerting documentation.

Improve your security with service accounts
Generally available in Grafana OSS, Grafana Cloud (Free, Pro, Advanced), and Grafana Enterprise
Harness the power of service accounts, ensuring a more secure and controlled approach to access management within your organization. By leveraging service accounts, you’ll benefit from improved role-syncing behavior when using external authentication providers, keeping your data safe and accessible only to those who need it.
*Recommendation: Migrate your existing API keys to service accounts and start using new service accounts instead of creating new API keys. This is a more secure and controlled approach to access management.

Grafana dashboards made easy
Generally available in Grafana OSS, Grafana Cloud (Free, Pro, Advanced), and Grafana Enterprise
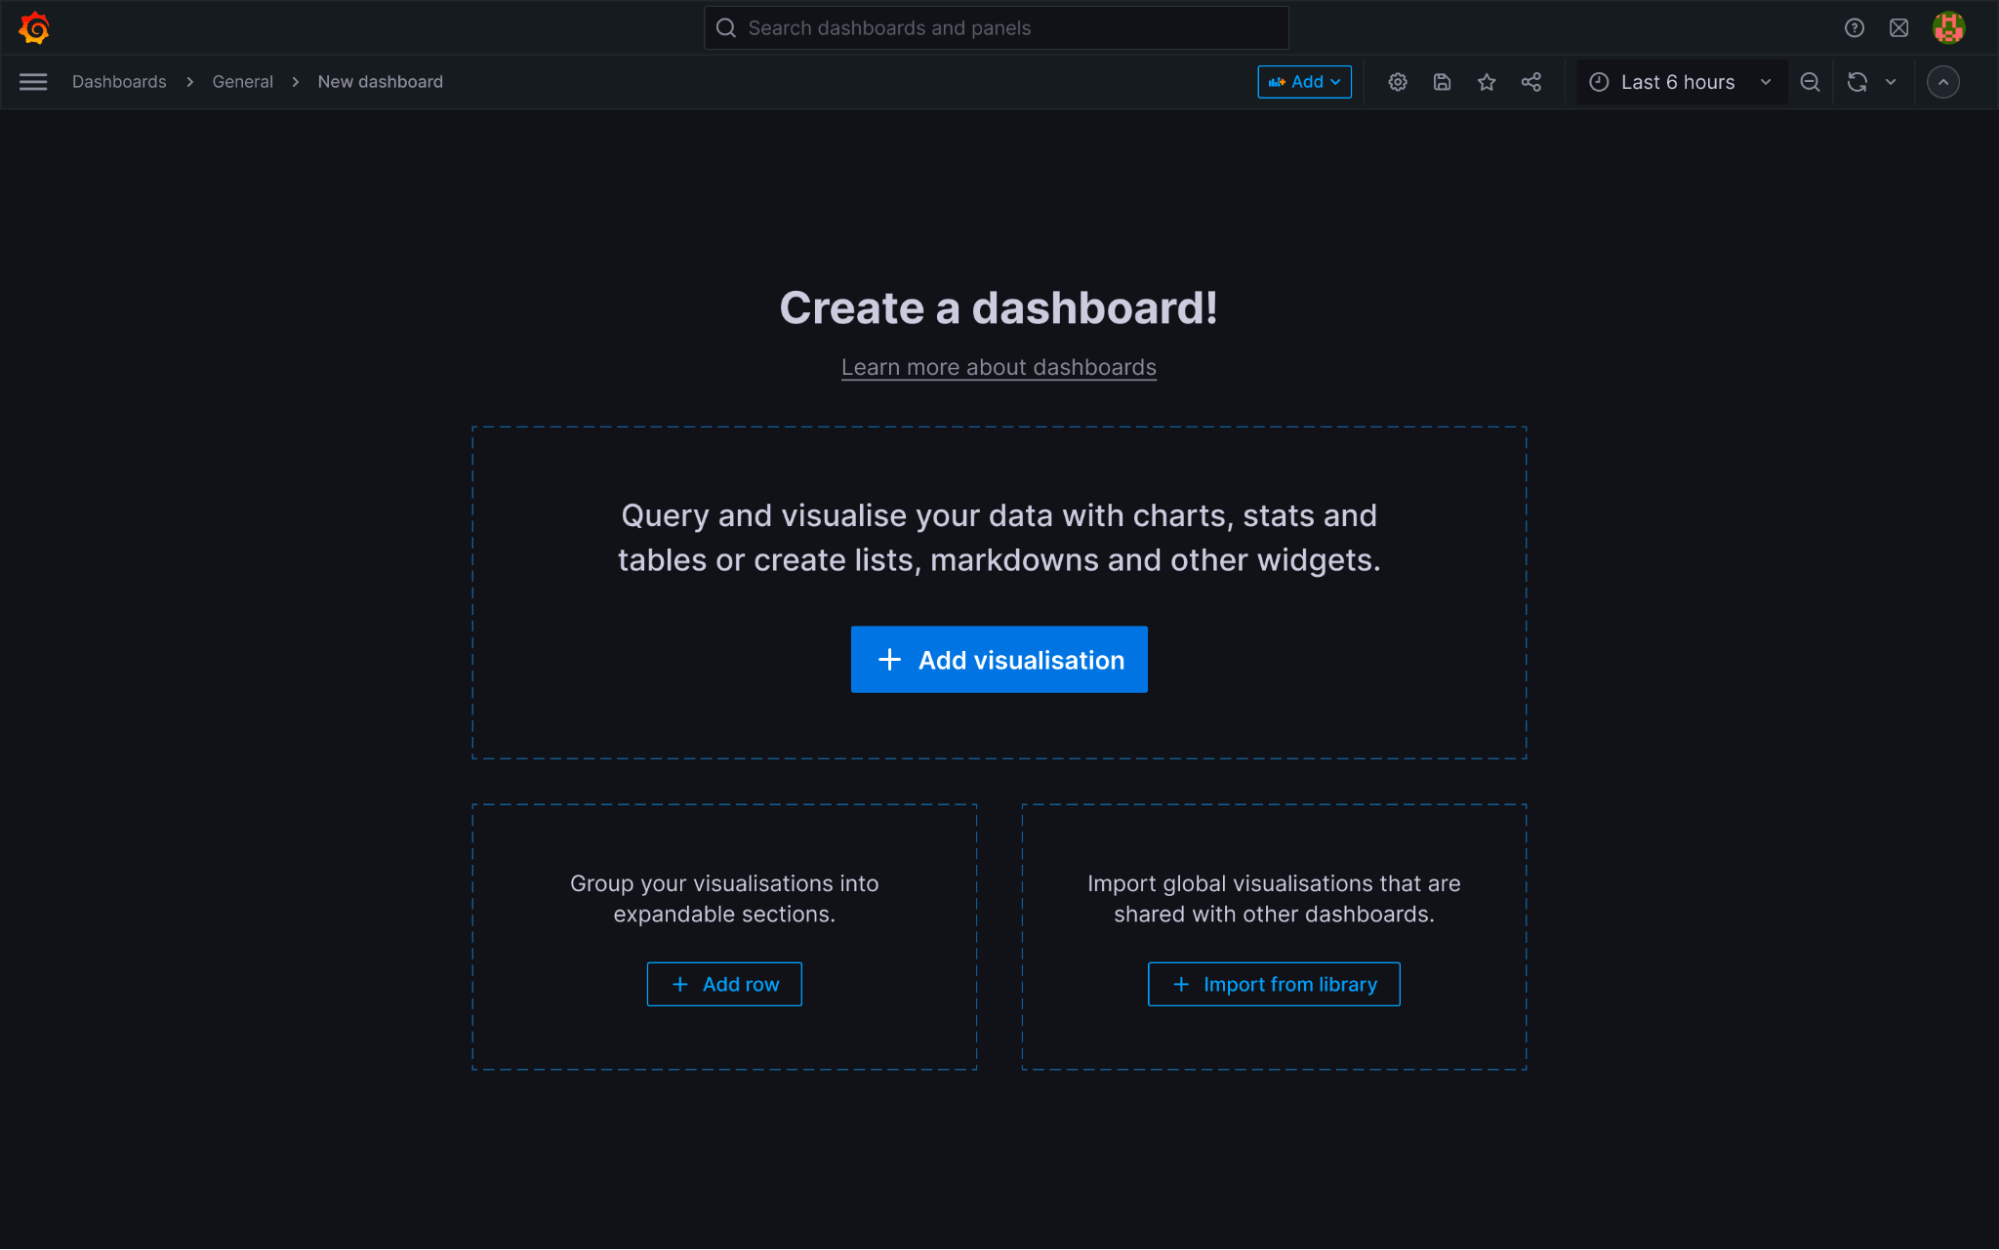
When you kick-start your Grafana dashboard building experience, you’ll find more tips and explanations built into the UI for adding visualizations, rows, or importing panels. With the added guidelines, you can make more informed decisions as you create intuitive, powerful dashboards.

Enhanced accessibility with redesigned dashboard panels
Generally available in Grafana OSS, Grafana Cloud (Free, Pro, Advanced), and Grafana Enterprise
Easily interact with your panels through an optimized layout, offering better accessibility and a more intuitive experience. Discover improvements such as concise panel descriptions, streamlined error messages, and accessible key actions in the panel header.

Maximize uptime with support bundles
Generally available in Grafana OSS, Grafana Cloud (Free, Pro, Advanced), and Grafana Enterprise
Reduce the time spent on troubleshooting and resolving issues by taking advantage of support bundles, a collection of files that you can share with your colleagues and contributors. Quickly gather essential diagnostic information, logs, and configuration details to help your support team identify and fix problems faster. Spend less time resolving issues and more time optimizing your monitoring and observability.
Discover advanced features in Grafana Enterprise
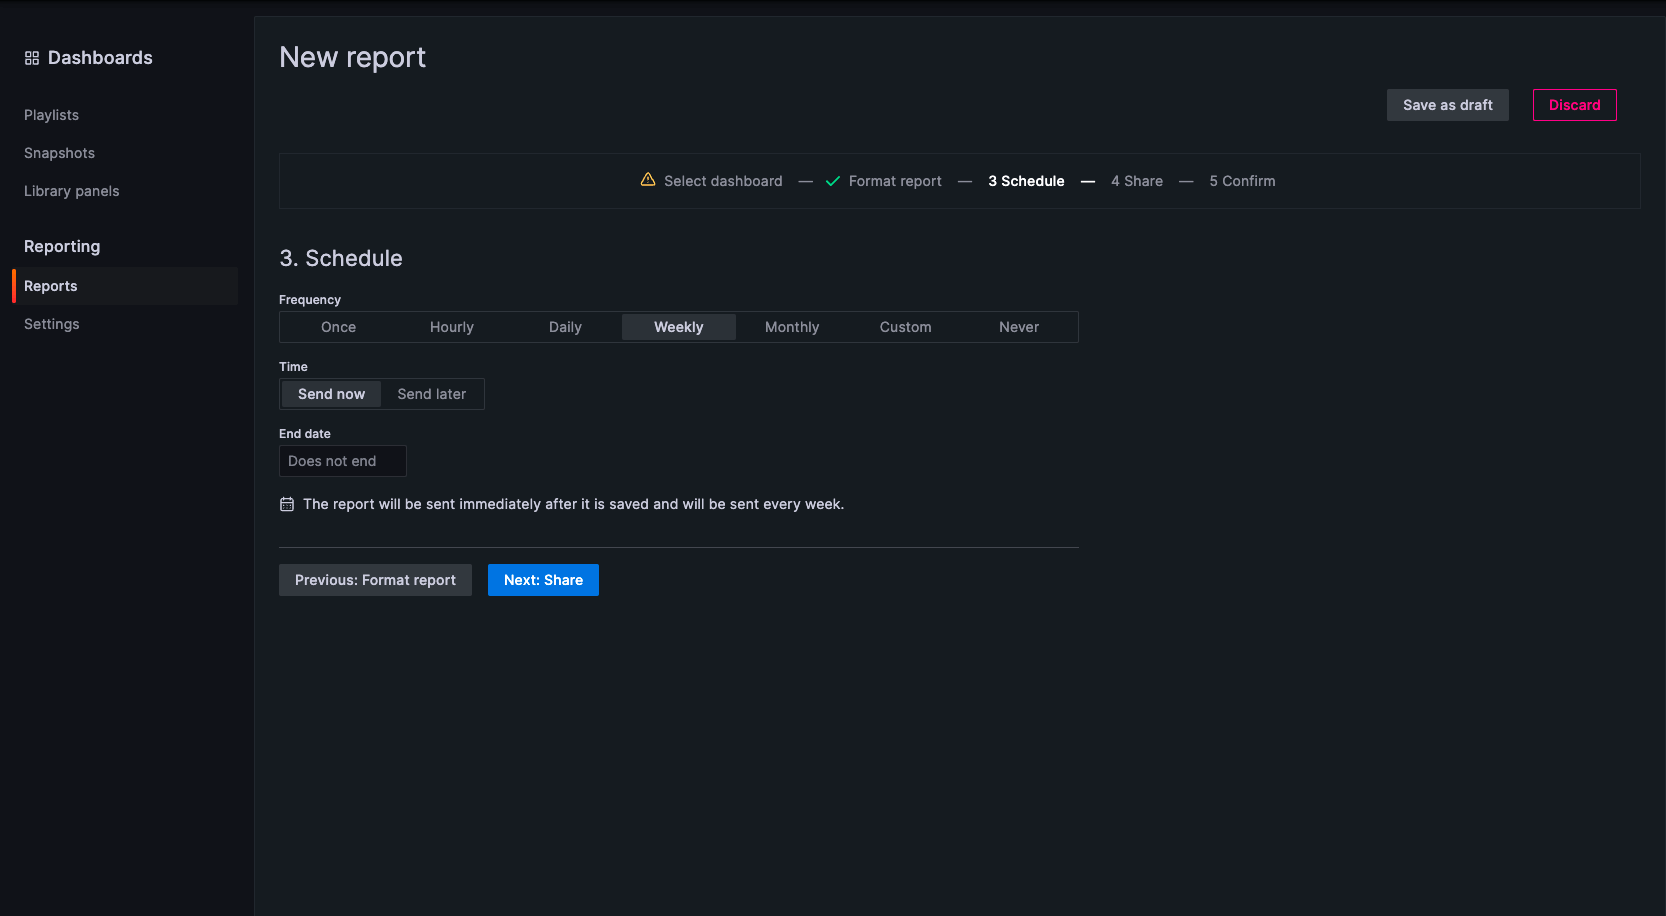
Grafana Enterprise customers can unlock even more powerful features with this release, such as advanced RBAC controls, custom reporting options, and extended data source capabilities. Leverage these additional tools and features to maximize the value of your Grafana investment while driving better insights and outcomes for your organization.
Get started with Grafana 9.5
For a complete list of new features, check out the Grafana documentation, changelog, or the What’s New 9.5 documentation
You can also join us on our Grafana Labs community forums to discuss any of the new features, workflows, or how to incorporate these changes into your dashboards, queries, and visualizations.
Plus check out our “Getting started with Grafana” webinar on demand for free!
Upgrade to Grafana 9.5
Download the latest version of Grafana today or try it out on Grafana Cloud, which has a generous free forever tier and plans for every use case. Sign up for free today!
Refer to our upgrade Grafana documentation for more information about upgrading your Grafana installation.
Thank you!
A huge thanks to all the Grafana users who contributed by submitting PRs, bug reports, and feedback! Your involvement and support help make Grafana better with each release.


